Abstract
There is increasing acceptance of the critical importance of correlating the morphologic features of tissue with the data obtained from various molecular analytic techniques. Access to archived formalin-fixed and paraffin-embedded (FFPE) tissue specimens via shotgun-based proteomic analyses may, therefore, open new avenues for both prospective and retrospective translational research. However, one of the remaining issues in performing comparative proteomic measurements among FFPE tissues relates to potential variability in protein composition and retrieval based on length of storage periods.
Optimized protein extraction and digestion procedures for handling FFPE tissues are coupled with the capillary isotachophoresis-based proteome technology to evaluate the effects of length of storage period on archival tissue proteome analysis across ten archived uterine mesenchymal tumor tissue blocks, including nine uterine leiomyomas dating from 1990 to 2002 and a single case of alveolar soft part sarcoma (ASPS) from 1980. Several statistical measures, including the Pearson correlation coefficient, coefficient of variance, k-means clustering, and ANOVA, are employed to evaluate the possibility of an archival effect on individual proteins or groups of proteins within nine leiomyomas. Low abundance proteins may be more susceptible to the long term storage as these proteins are more difficult to be retrieved and extracted as the tissue block ages in paraffin.
Despite using tissue blocks stored for as many as 28 years, high confidence and comparative proteome analysis between the leiomyomas and the sarcoma is achieved. Though sharing over 1,800 common proteins in a core set, a total of 80 proteins unique to the sarcoma are identified distinguishing the ASPS from the leiomyomas. Vacuolar proton translocating ATPase 116 kDa subunit isoform a3, one of the unique proteins expressed in the ASPS, is further validated by immunohistochemistry (IHC). Although IHC is highly sensitive and provides the subcellular resolution, mass spectrometry-based proteome profiling enables global identification and quantification of thousands of proteins without a priori knowledge of individual proteins being analyzed or the need of validated antibodies.
INTRODUCTION
The criteria employed by pathologists for the diagnosis of numerous diseases, including essentially all cancers, have been established in formalin-fixed and paraffin-embedded (FFPE) tissue sections stained by hematoxylin and eosin (H&E). Furthermore, FFPE specimens, such as those collected under clinical trials, present invaluable resources for conducting retrospective investigations on molecular determinants associated with therapeutic response. Technological innovations already allow RNA profiling of FFPE sections for assessment of patterns of altered gene expression caused by specific exposures or disease outcomes1, 2. However, formalin-induced cross-linking of protein hinders efficient extraction of proteins from FFPE tissues for performing subsequent immunohistochemistry (IHC) and proteomic measurements.
Boiling the FFPE tissue sections in buffer solutions dramatically reduced the detection thresholds of IHC staining for a wide range of antibodies in the antigen retrieval methodology3-6. To increase the amounts of protein extractable from FFPE sections, the heat-induced antigen retrieval approach was combined with the application of a radioimmunoprecipitation buffer containing sodium dodecyl sulfate (SDS)7 or a denaturing solution containing both urea and SDS8. A commercial Liquid Tissue™ kit was introduced for processing FFPE tissues also in the presence of heating at 95 °C for 90 min9. Two recent FFPE proteome studies were based on the use of lysis buffers containing either guanidine hydrochloride10 or organic solvent11 at high temperature.
Combined capillary isoelectric focusing (CIEF)/nano-reversed phase liquid chromatography (nano-RPLC) separations coupled with electrospray ionization-mass spectrometry (ESI-MS) have been demonstrated in our laboratory to enable ultrasensitive analysis of minute proteins extracted from whole and microdissected FFPE tissues12, 13. A capillary isotachophoresis (CITP)-based proteome platform, capable of providing selective analyte enrichment and high resolving power, was recently developed to further address the challenges of protein complexity and relative abundance inherent in FFPE specimens14. As evidenced in our comparison studies using human saliva and mouse brain mitochondria samples15, 16, the degree of peptide overlapping among CITP fractions was even lower than that achieved using CIEF-based multidimensional separations. When evaluating the protein sequence coverage by the number of distinct peptides mapping to each protein identification, CITP similarly achieved superior performance.
From a practical point of view, one of the remaining issues in performing comparative proteomic measurements among FFPE tissues relates to potential variability in protein composition and retrieval during different storage periods. Thus, the CITP proteome technology coupled with the spectral counting approach17-19 is employed in this work for the first time to investigate the effects of archival time on protein expression profiles over a set of mesenchymal tumors, including nine leiomyomas dating from 1990 to 2002 and a single vaginal alveolar soft part sarcoma (ASPS) from 1980.
EXPERIMENTAL SECTION
Materials and Reagents
Fused-silica capillaries (50 μm i.d./375 μm o.d. and 100 μm i.d./375 μm o.d.) were acquired from Polymicro Technologies (Phoenix, AZ). Acetic acid, dithiothreitol (DTT), formalin, iodoacetamide (IAM), and octane were obtained from Sigma (St. Louis, MO). Acetonitrile, ammonium acetate, hematoxylin, SDS, tris(hydroxymethyl)aminomethane (Tris), and urea were purchased from Fisher Scientific (Pittsburgh, PA). Pharmalyte 3-10 was acquired from Amersham Pharmacia Biotech (Uppsala, Sweden). Sequencing grade trypsin was obtained from Promega (Madison, WI). All solutions were prepared using water purified by a Neu-Ion system (Baltimore, MD) equipped with a UV sterilizing lamp and a 0.05 μm membrane final filter.
Tissue Sample Preparation
A blinded set of ten mesenchymal tumors was obtained from Dr. Fattaneh Tavassoli’s laboratory at the Yale University School of Medicine. FFPE tissues were de-paraffinized using octane, followed by vortexing and centrifugation12. Proteins were recovered from tissue sections of 1 cm × 1 cm × 10 μm by following heat-induced retrieval conditions described previously12-14. Briefly, sections of fixed tissues were treated with a 20 mM Tris buffer containing 2% SDS (w/v), followed by heating at 100 °C on a heat block (VWR Scientific Products, West Chester, PA) for 20 min, then incubation at 60 °C in an incubator (Robbins Scientific, Sunyvale, CA) for 2 hr. The proteins collected in the supernatant were placed in a dialysis cup (Pierce, Rockford, IL) and dialyzed overnight at 4 °C against 100 mM Tris-HCl at pH 8.2.
The retrieved and dialyzed proteins were denatured, reduced, and alkylated by sequentially adding urea, DTT, and IAM with final concentrations of 8 M, 10 mg/mL, and 20 mg/mL, respectively. The solution was incubated at 37 °C for 1 hr in the dark and then diluted 8-fold with 100 mM ammonium acetate at pH 8.0 with a final solution volume of 10 mL. Trypsin was added at a 1:40 (w/w) enzyme-to-substrate ratio, and the solution was incubated at 37 °C overnight. Tryptic digests were desalted using a Peptide MacroTrap column (Michrom Bioresources, Auburn, CA), lyophilized to dryness using a SpeedVac (Thermo, San Jose, CA), and then stored at -80 °C.
Transient CITP/Capillary Zone Electrophoresis (CZE)-Based Tissue Proteome Analysis
Similar to the procedures described in our previous studies14-16, a 80-cm long CITP capillary (100 μm i.d./365 μm o.d.) coated with hydroxypropyl cellulose20, 21 for the elimination of electroosmotic pumping and protein adsorption was initially filled with a background electrophoresis buffer of 0.1 M acetic acid at pH 2.8. The sample containing protein digests retrieved and processed from FFPE tumor tissues was prepared in a 2% pharmalyte solution with a final concentration of 1 μg/μL determined by a modified Bradford assay (Bio-Rad, Hercules, CA). A 50-cm long sample plug, corresponding to 4.0 μL sample volume (total protein content of 1 μg/μL × 4.0 μL = 4μg), was hydrodynamically injected into the capillary. A positive electric voltage of 24 kV was then applied to the inlet reservoir, which was filled with a 0.1 M acetic acid solution.
The cathodic end of the capillary was housed inside a stainless steel tube (460 μm i.d./785 μm o.d.) using a coaxial liquid sheath flow configuration22. A sheath liquid composed of 0.1 M acetic acid was delivered at a flow rate of 1 μL/min using a Harvard Apparatus 22 syringe pump (South Natick, MA). The stacked and resolved peptides in the CITP/CZE capillary were sequentially fractionated and loaded into individual wells on a moving microtiter plate. The entire capillary content was separated and sampled into individual fractions in less than 2 hr. The CITP separation and fractionation apparatus was operated on an in-house built robotic platform controlled by LabView (National Instruments, Austin, TX).
To couple transient CITP/CZE with nano-RPLC, peptides collected in individual wells were sequentially injected into dual trap columns (3 cm × 200 μm i.d. × 365 μm o.d.) packed with 5 μm porous C18 reversed phase particles. Each peptide fraction was subsequently analyzed by nano-RPLC equipped with an Ultimate dual-quaternary pump (Dionex, Sunnyvale, CA) and a dual nano-flow splitter connected to two pulled-tip fused-silica capillaries (50 μm i.d. × 365 μm o.d.). These two 15-cm long capillaries were packed with 3.5-μm Zorbax Stable Bond (Agilent, Palo Alto, CA) C18 particles.
Nano-RPLC separations were performed in parallel in which a dual-quaternary pump delivered two identical 2-hr organic solvent gradients with an offset of 1 hr. Peptides were eluted at a flow rate of 200 nL/min using a 5-45% linear acetonitrile gradient over 100 min with the remaining 20 min for column regeneration and equilibration. The peptide eluants were monitored using a linear ion-trap mass spectrometer (LTQ, ThermoFinnigan, San Jose, CA) equipped with an electrospray ionization interface and operated in a data dependent mode. Full scans were collected from 400 - 1400 m/z and 5 data dependent MS/MS scans were collected with dynamic exclusion set to 30 sec.
MS Data Analysis
Raw LTQ data were converted to peak list files by msn_extract.exe (ThermoFinnigan). Open Mass Spectrometry Search Algorithm (OMSSA)23 developed at the National Center for Biotechnology Information was used to search the peak list files against the UniProt sequence library (April 20, 2006) with decoyed sequences appended. This decoyed database was constructed by reversing all sequences and appending them to the end of the sequence library. Searches were performed using the following parameters: fully tryptic, 1.5 Da precursor ion mass tolerance, 0.4 Da fragment ion mass tolerance, 1 missed cleavage, alkylated Cys as a fixed modification and variable modification of Met oxidation. Searches were run in parallel on a 14 node, 28 CPU Linux cluster (Linux Networx, Bluffdale, UT).
False discovery rates (FDRs) were determined using a target-decoy search strategy introduced by Elias and co-workers24 and employed in our previous study for a comparative evaluation among commonly used tandem MS identification search algorithms25. An E-value threshold corresponding to a 1% FDR in total peptide identifications was used as a cutoff in this analysis as this correlates with the maximum sensitivity versus specificity in our previous work25. No other cutoffs, such as requiring a minimum number of distinct peptides per protein identification, were utilized.
As reported in the literature, most false peptide identifications tend to be ones in which the corresponding protein is only identified by just that one peptide. Thus, many proteome research laboratories routinely discard single peptide identifications to significantly reduce the FDR of distinct protein identifications. However, as previously demonstrated by Dr. Gygi’s26 and our laboratories25, these single-protein identifications, after filtering, are mostly correct and often represent 30-50% of a proteome dataset. As illustrated in our recent studies14, several low abundance proteins, including CD74, CD117, CD45, and S-100, were identified by single peptide hits during the proteome analysis of FFPE liver tissues and were successfully validated by subsequent IHC measurements. The removal of these protein identifications greatly and negatively impacts the coverage and the sensitivity of overall proteome analysis. As advocated by Elias and Gygi26 and also implemented in our proteome studies, the target-decoy search strategy is employed as the routine practice to design more stringent criteria for single-peptide identifications. All single peptide hits together with their corresponding E-values were summarized and provided as the supplemental information.
The UniProt sequence library consists of entries from both SwissProt and TrEMBL. Due to the minimally redundant nature of SwissProt, only peptides mapping to the SwissProt subset were reported here. After generation of search data, the OMSSA XML result files were parsed using a Java parser and loaded into an Oracle 10g database for analysis and reporting using in-house software.
The Pearson correlation coefficient was employed to measure how well a linear equation describes the quantitative correlation between two proteome runs to assess analytical reproducibility and allow for easy visual identification of outlier features (proteins). The calculation of the Pearson correlation coefficient and the analysis of variance (ANOVA) were performed using the MATLAB Statistics Toolbox (MathWorks, Natick, MA). k-means clustering was conducted using Cluster 3.027. Arrays were classified by k-means into ten clusters using the Euclidean distance metric.
Validation of Proteins Retrieved and Identified from FFPE Tissues Using IHC
Three proteins, including actin, desmin, and progesterone receptor, were chosen from MS-based proteomic measurements of leiomyomas for validation using IHC. Vacuolar proton translocating ATPase 116 kDa subunit isoform a3 (VPP3) as one of candidate markers whose expression profiles distinguish ASPS from leiomyoma was selected for validation using IHC. Primary (monoclonal) antibodies against actin, desmin, and progesterone receptor were obtained from Dako (Carpinteria, CA). The mouse primary (polyclonal) antibody against VPP3 was purchased from Abcam (Cambridge, MA) and incubated with a dilution ratio of 1:150 at 4 °C overnight.
The biotinylated anti-mouse immunoglobulins were employed as the link antibody and were incubated for 30 min. The avidin-biotin-peroxidase complex (Vector Laboratories, Burlingame, CA) was utilized as the labeling reagent and incubated for 30 min. A 10-min wash step with Tris buffered saline (TBS) was carried out between each step. Slides were counterstained by hematoxylin and mounted for examination. Negative controls were conducted using TBS instead of the primary antibody. Immunostained slides were evaluated by microscopy. The intensity of immunostaining was graded as + and − for positive and negative, respectively.
RESULTS AND DISCUSSION
Because the capacity to store large numbers of catalogued clinical fresh frozen samples under optimal conditions is limited by cost, space, and personnel limitations, it is important to explore the utility of a large number of archival FFPE tissue banks available worldwide for extraction of molecular data using novel technologies. These tissue banks particularly constitute invaluable resources for translational studies of cancer. In cancer research, where knowledge of disease outcome is critical in the evaluation of the significance of particular phenotypes or genotypes, and where it may take five or more years to complete expensive prospective studies, the ability to analyze documented archival cancer cases with known outcome is highly desirable.
From the onset, it was apparent that proper sample preparation is critical in application of IHC to FFPE tissues28, 29. Shi et al.4, 30 clearly illustrated that hydrolysis of cross-linkages between formalin and protein can be induced by high temperature heating. As demonstrated in our previous studies12-14, the ability to achieve excellent protein recovery from FFPE tissues for shotgun proteome analysis was attributed to the use of both heating and detergents such as SDS. In fact, Fowler et al.31 have compared 6 different protocols for protein extraction from FFPE tissues, and concluded that the most effective protein extraction buffer tested is a 20 mM Tris solution containing 2% SDS under high temperature heating protocol12-14. Furthermore, under this protein retrieval protocol, there were no significant differences in protein quality and quantity extracted from FFPE tissues treated by various fixation times14. In fact, the protein yield obtained from a FFPE tissue for all of fixation conditions investigated was comparable (~95%) to those extracted from an equal amount of fresh-frozen tissue.
Following optimized protein extraction and digestion procedures for handling FFPE tissues, ten archived and blinded mesenchymal tumor tissue blocks, including nine uterine leiomyomas and a single vaginal ASPS, were employed for performing shotgun-based tissue proteome analysis. The leiomyomas were categorized into three groups of three cases each by the archival year of 1990, 1997, and 2002. The sarcoma case was collected from 1980. It was unknown to the analyzers that this tissue was a significantly different type of mesenchymal tumor - an ASPS in contrast to the benign nature of the leiomyomas that are of smooth muscle derivation. As shown in Fig. 1, the morphology revealed by H&E staining is markedly different between leiomyoma and sarcoma.
Figure 1.
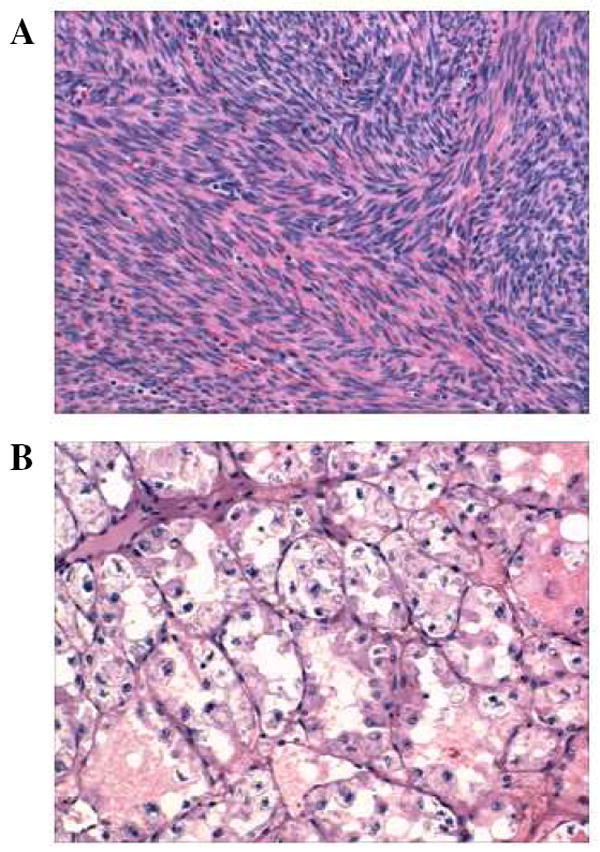
H&E staining of (A) uterine leiomyoma and (B) vaginal alveolar soft part sarcoma.
The proteomic results with the corresponding E-value thresholds and the numbers of decoy hits were summarized in Table 1 for all ten mesenchymal tumor tissues examined in this study. The 1990 group of leiomyomas returned slightly poorer proteome performance compared to the leiomyomas cataloged in 1997 and 2002. There was no discernable difference between the 1997 and 2002 groups. The 1980 ASPS case yielded over 2,400 protein identifications which were near the upper end of what were detected for all 10 tumors, despite being the oldest FFPE tissue sample.
Table 1.
Summary of Proteomic Results Obtained from Mesenchymal Tumor Tissues
| Tumor | Year | Spectral counts | Distinct Peptides | Distinct Proteins | E-Value (× 10-3) | Decoy Hits |
|---|---|---|---|---|---|---|
| Sacroma | 1980 | 18,254 | 8,994 | 2,418 | 1.20 | 91 |
| Leiomyoma | 1990 | 15,193 | 5,887 | 1,714 | 0.09 | 76 |
| Leiomyoma | 1990 | 12,556 | 5,599 | 1,593 | 0.20 | 63 |
| Leiomyoma | 1990 | 12,976 | 5,064 | 1,707 | 0.09 | 65 |
| Leiomyoma | 1997 | 22,267 | 7,897 | 2,138 | 0.27 | 111 |
| Leiomyoma | 1997 | 34,810 | 12,413 | 2,671 | 0.53 | 174 |
| Leiomyoma | 1997 | 26,325 | 9,259 | 2,227 | 0.55 | 132 |
| Leiomyoma | 2002 | 41,711 | 10,020 | 2,406 | 0.09 | 209 |
| Leiomyoma | 2002 | 18,134 | 6,852 | 1,977 | 0.17 | 91 |
| Leiomyoma | 2002 | 29,335 | 10,961 | 2,825 | 0.39 | 147 |
The Venn diagrams shown in Fig. 2 present the overlap among proteins identified in each of the leiomyoma groups cataloged in 1990, 1997, and 2002, respectively. Reasonable degree of protein overlap was observed among different biological samples archived in the same year. By including proteins identified by at least two distinct (different) peptide sequences, the Venn diagram shown in Fig. 3 illustrates the overlap among proteins identified in the sarcoma (ASPS) and leiomyomas. It is not surprising that, of the 2,583 proteins identified, 653 were found uniquely in the leiomyomas. This may be simply the result of the larger number of leiomyoma samples compared to a single example of sarcoma analyzed. The 80 proteins identified uniquely in the sarcoma case are significant, however, exactly because they were not discovered in the leiomyomas despite having evaluated nine different tumors. For example, VPP3 was one of unique proteins expressed in the ASPS which was identified by three distinct peptides and validated by IHC (Fig. 4).
Figure 2.
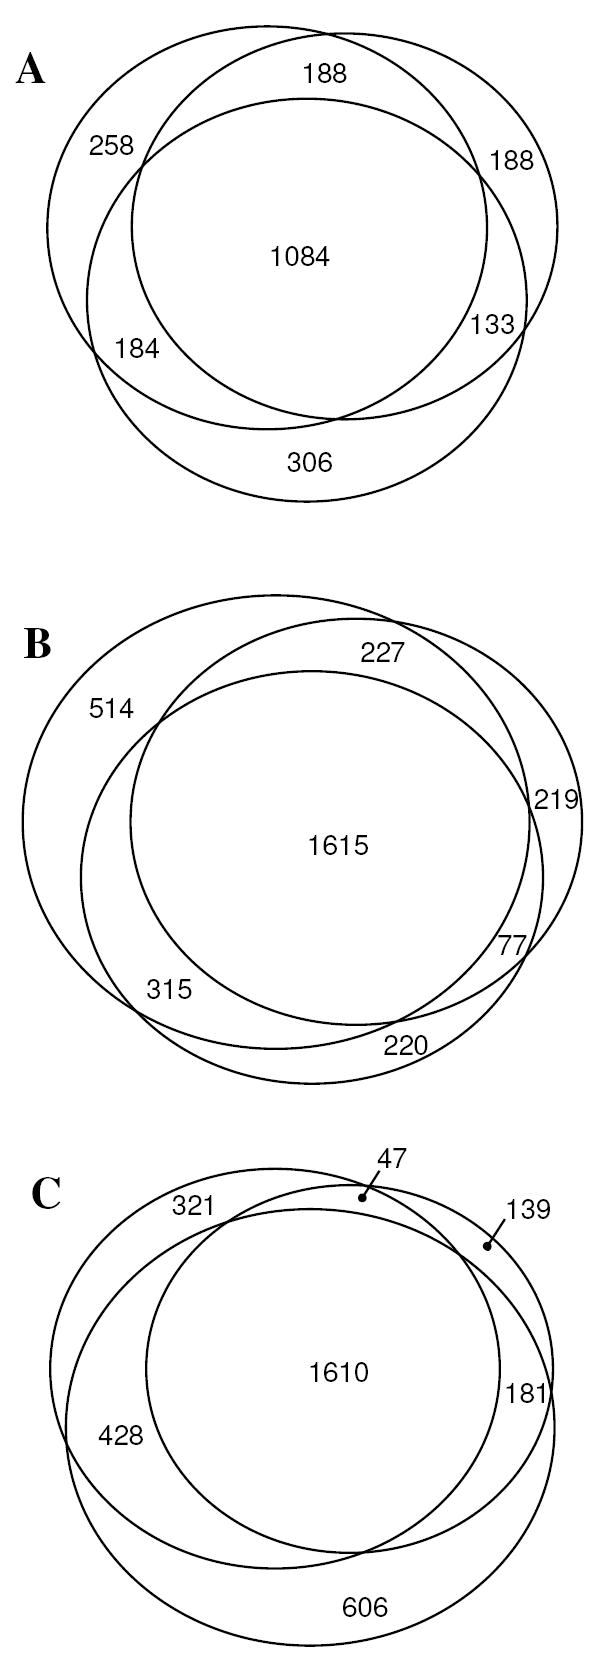
The Venn diagrams showing overlap of identified proteins for the (A) 1990, (B) 1997, and (C) 2002 leiomyoma sets.
Figure 3.
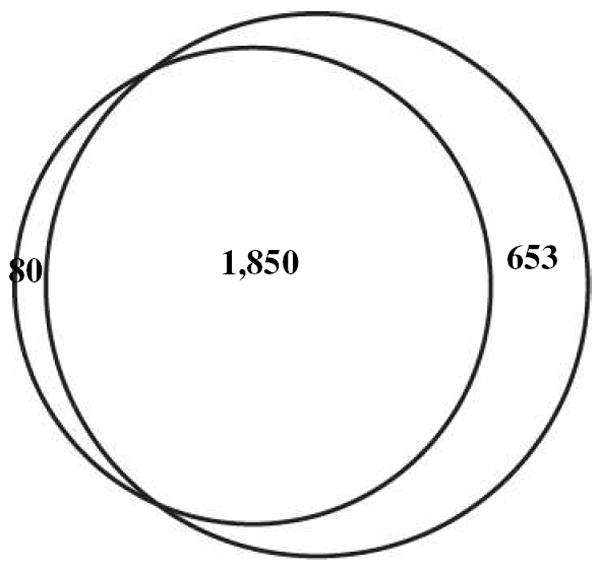
The Venn diagram comparing proteins identified from the sarcoma (small circle) and leiomyomas (large circle).
Figure 4.
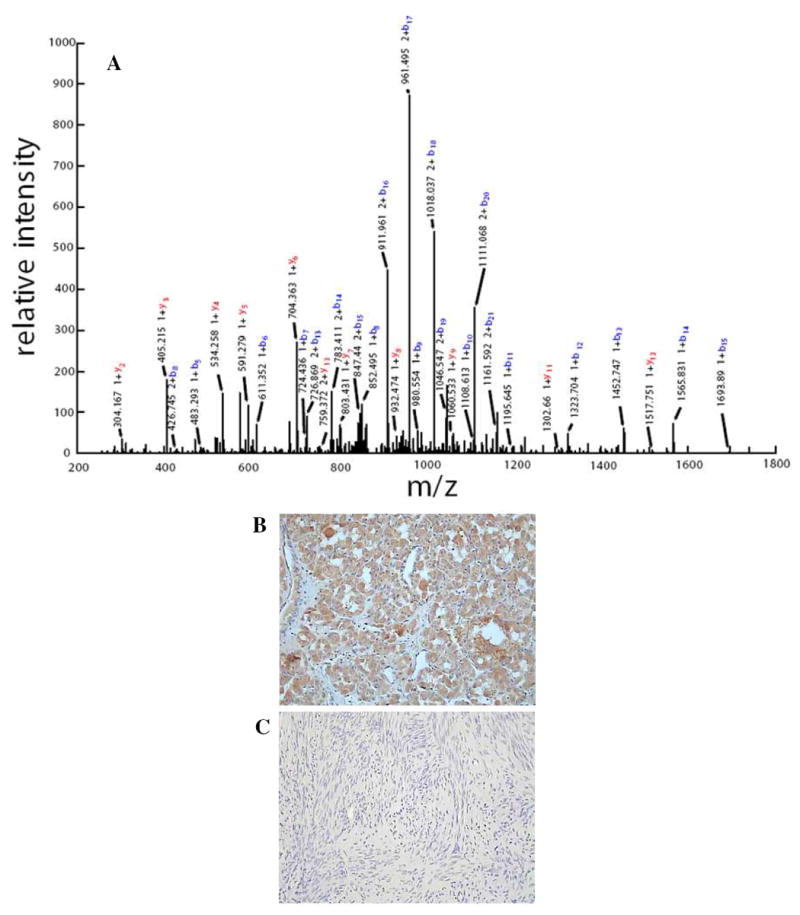
(A) Tandem MS spectrum of unique peptide LGALQQLQQQSQELQEVLGETER leading to the identification of VPP3. IHC staining of VPP3 on (B) alveolar soft part sarcoma and (C) leiomyoma tissue sections.
Besides comparing identified proteins, the CITP-based proteome platform was coupled with the spectral counting approach17-19 to quantify changes in protein expression between the ASPS and leiomyomas. The average number of spectral counts per protein on a per-run basis was normalized across runs. The spectral counts of individual proteins were then adjusted against this normalized value and termed expression values (summarized and provided in the supplemental information). All proteins with spectral counts ≥ 1 were included in the determination of the Pearson correlation coefficient for the assessment of proteomic data quality and reproducibility.
The capabilities of the spectral counting approach coupled with the CIEF-based proteome platform were demonstrated in our recent studies for achieving confident and reproducible quantification of proteins and changes in protein expression levels among yeast cell lysates32. Furthermore, Zhang and co-workers33 have performed a systematic analysis of various sampling statistics approaches to quantifying differential protein expression in eukaryotic Saccharomyces cerevisiae and prokaryotic Rhodopseudomonas palustris. Among three label-free sampling statistics, the spectral count has the highest technical reproducibility, followed by the less-reproducible peptide count and relatively non-reproducible sequence coverage. The relative amounts of eight model proteins present in two mixtures were determined by the Association of Biomolecular Resource Facilities Proteomics Research Group 2006 Study34. For the majority of quantitative methods, the greatest percent error of ratio was seen for glycogen phosphorylase. However, MS using ion current or spectral counting and two-dimensional polyacrylamide gel electrophoresis using radioactivity yielded ratios closest to the expected for glycogen phosphorylase. Furthermore, ratios obtained by MS ion current or spectral counting were as close to the expected values as those obtained by stable isotope labeling.
Excellent correlation among quantitative proteome results obtained from leiomyomas was achieved in this study. For example, correlation of any of the three leiomyoma groups (archived in 1990, 1997, and 2002) with any of the other two sets yielded a Pearson R2 value of greater than 0.97 (Fig. 5A). Despite correlating among different patient samples, this value compares favorably with a recent report of a Pearson R2 correlation of 0.88 for performing technical replicates of the same protein digest using a multidimensional liquid chromatography system35.
Figure 5.
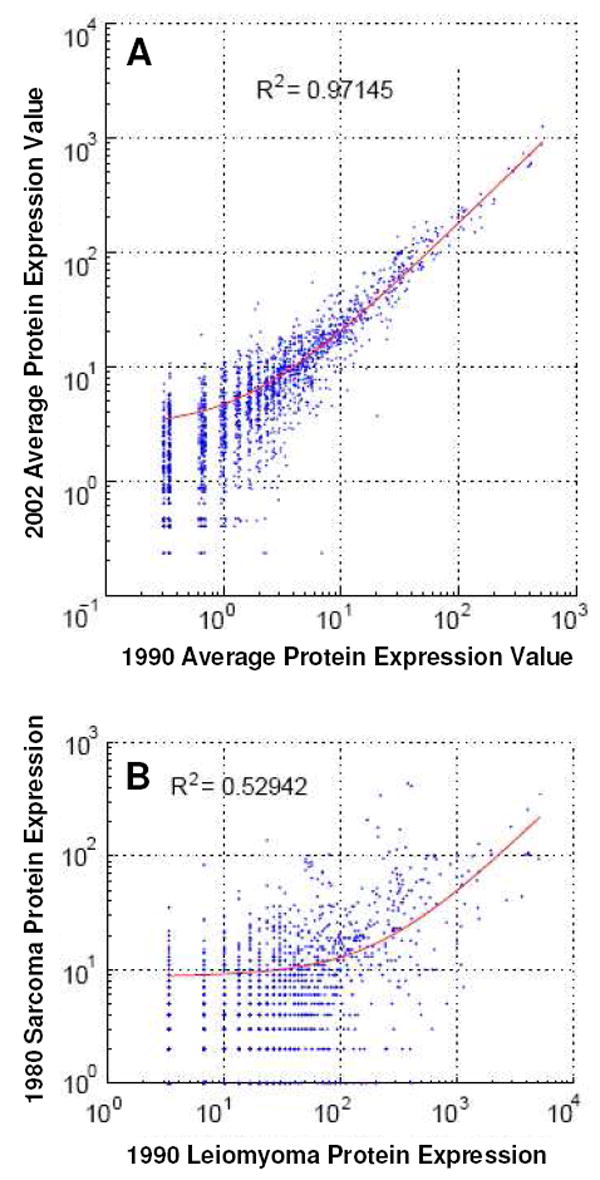
(A) Pearson correlation plot between 2002 and 1990 leiomyoma tumor groups. (B) Pearson correlation plot between 1980 sarcoma and 1990 leiomyoma tumor groups.
In contrast, the correlation between the vaginal sarcoma (ASPS) and the uterine leiomyomas was moderate, with a Pearson R2 value of 0.53 (Fig. 5B). Despite sharing over 1,800 common proteins in a core set (Fig. 3), significant differences in protein expression were clearly observed between the two tumor types. Based on spectral counts of identified proteins, categorization of tumor specimens was achieved by an unsupervised hierarchical cluster analysis27. As shown in Fig. 6, the single sarcoma case was well-separated from the nine leiomyomas.
Figure 6.
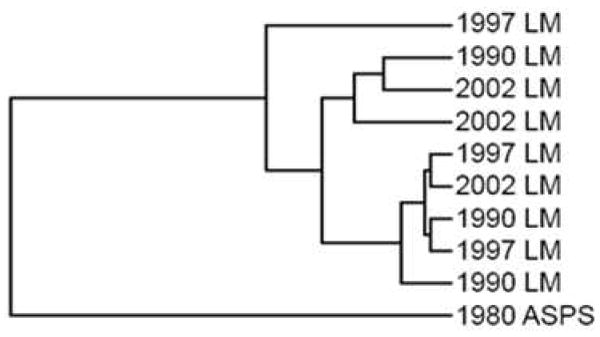
The hierarchical cluster analysis of all ten mesenchymal tumors.
It is important to rule-out the possibility of comparison bias due to sample archival time. From this perspective it is interesting to note that the nine leiomyomas do not cluster by the archival year (Fig. 6). Neither do they group by diagnosis or patient age (data not shown). Furthermore, as discussed previously, all three leiomyoma groups (archived in 1990, 1997, and 2002) strongly correlate with each other in quantitative proteome measurements evaluated by the Pearson coefficient (Fig. 5A).
The expression values of three proteins, including actin, desmin, and progesterone receptor as commonly used markers for leiomyomas, were selected from proteome datasets to further investigate potential effects of archival time on the tissue proteome. As shown in Fig. 7, protein expression of these three markers was remarkably consistent over twelve years of archival time from 1990 to 2002. Representative IHC results shown in Fig. 8 validated MS-based proteome profiling of FFPE tumor tissues which dated back as many as 18 years.
Figure 7.
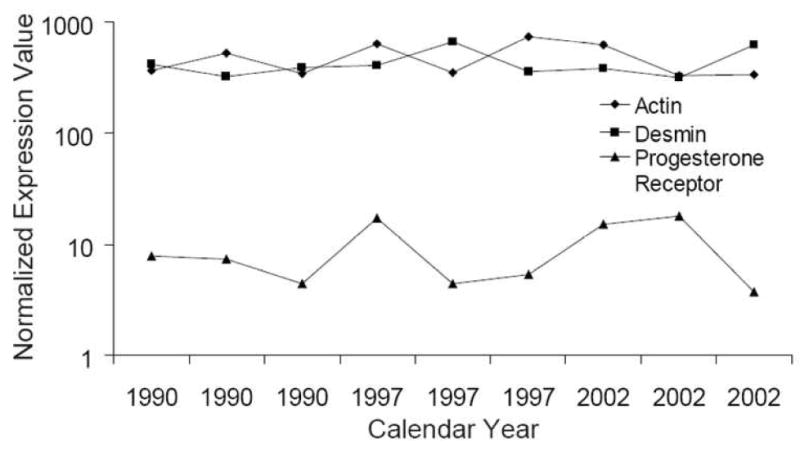
Distribution of protein expression of three leiomyoma markers, including actin, desmin, and progesterone receptor, over the archival years from 1990 to 2002.
Figure 8.
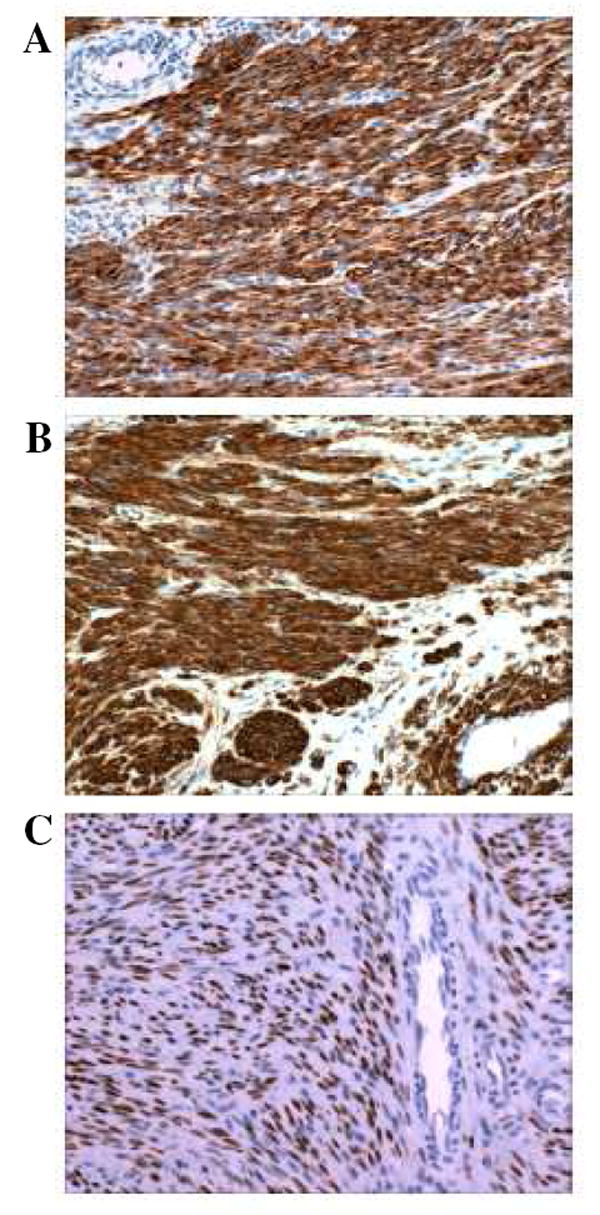
Representative IHC staining of three leiomyoma markers, including (A) desmin, (B) actin, and (C) progesterone receptor, on the same tissue blocks employed for MS-based proteome profiling.
The modest disparity in the expression value of markers among nine leiomyomas (Fig. 7) could easily be attributed to case-to-case variation. The mean coefficient of variance (CV) for all quantified proteins across the leiomyoma cases was determined to be 48.9%. Considering a mean analytical CV of about 15-20% due solely to variation in sample preparation and instrumentation performance, a CV of less than 50% determined from nine patient samples does not seem excessive, nor does it indicate an archival effect.
In an attempt to evaluate the possibility of an archival effect on individual proteins or groups of proteins, k-means clustering was performed on all proteins across the average of the archival time points (Fig. 9). Proteins were organized into ten clusters. The bottom right-hand corner of each panel displays the average change in protein expression with the upper and lower percentages representing comparisons between the 1990 and 2002 groups and among the 1997 and 2002 cases, respectively. Expression changes in all ten clusters were substantially less than 2-fold and were often within the analytical variability of the proteome platform.
Figure 9.
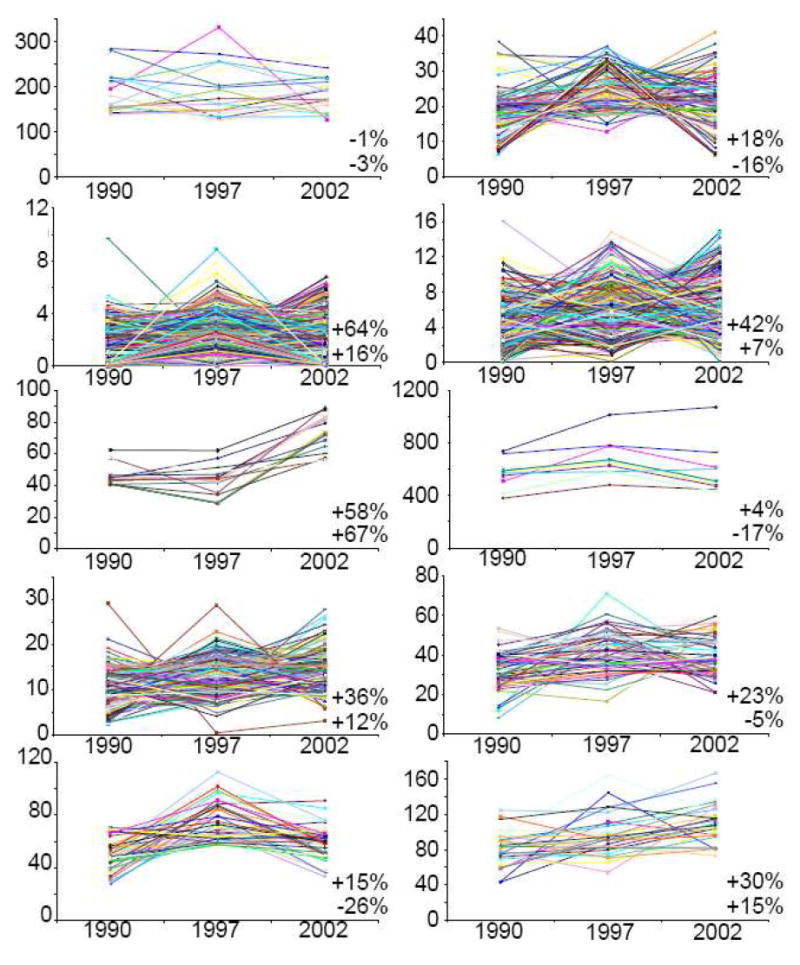
The k-means clustering of all leiomyoma proteins over the archival years from 1990 to 2002 on the x-axis. Proteins in each of ten clusters are varied in abundance as determined by the number of spectral counts on the y-axis.
While some individual proteins exhibited significant changes in expression between some cases on average, there was only modest change across time points consistent with an archival effect. That is, an archival effect may influence the retrieval of a protein or group of proteins over time and thus impact the subsequent proteomic measurements. Averaging the entire proteome data set for each averaged archival year shows an overall increase of average protein expression by 23% from the 1990 to 2002 groups. The same calculation, however, indicates almost no difference in protein expression among the 1997 and 2002 cases. Furthermore, the k-means cluster suggests that there may be an archival effect for low abundance proteins detected and quantified by less than ten spectral counts in which these proteins are more difficult to be retrieved as the tissue block ages beyond 10 years. Still, it should be noted that this study was conducted using only ten blinded tissues and non-pooled replicates. Cautions should be taken to generalize a trend in archival quality for all FFPE repositories.
Finally, ANOVA was performed for comparing each of the three archived leiomyoma groups to the others to assess data normality. As shown in Fig. 10A, comparison showed a consistent bias toward p-values below 0.5. When the cases were split for a two-way comparison such that each group had a roughly equal mix of cases from each archival date, the comparison data presented a more normal distribution (Fig. 10B). ANOVA results shown in Figs. 10A and 10B suggest that statistical comparisons across cases collected at different times may require the use of non-parametric methods or parametric comparisons should be performed only among groups archived at similar times.
Figure 10.
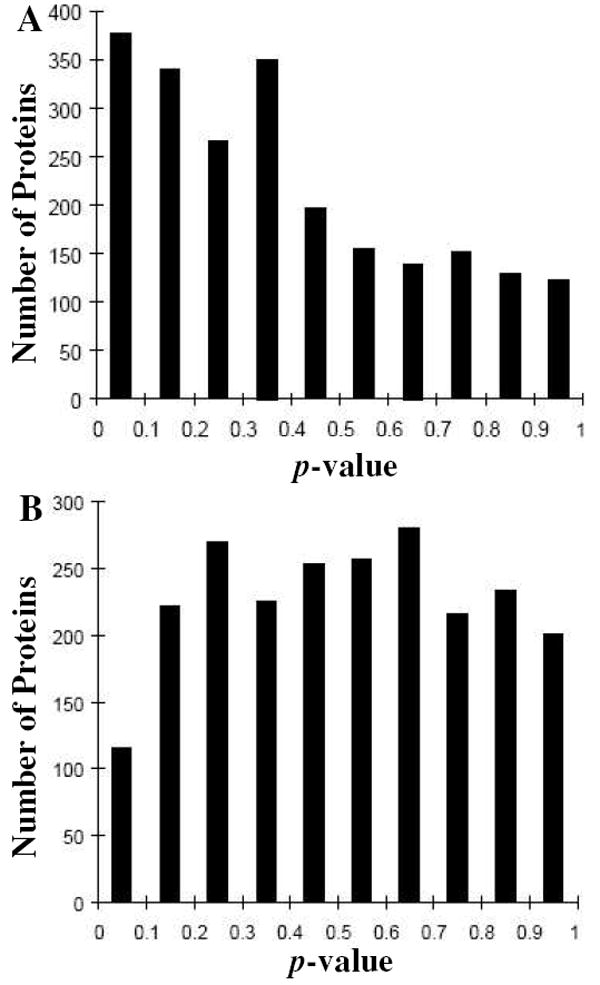
Performing ANOVA among proteomic results obtained from leiomyomas collected in 1990, 1997, and 2002. (A) Two-way comparison between 1990 and 2002 leiomyoma tumor groups. (B) Two-way comparison with each company containing a roughly equal mix of cases from each archival date.
CONCLUSION
By coupling optimized protein extraction and digestion procedures for handling FFPE tissues12-14 with the CITP-based proteome platform14-16, ten archived mesenchymal tumor tissue blocks, including nine uterine leiomyomas dating from 1990 to 2002 and a single 1980 vaginal ASPS case, were employed for investigating potential effects of archival time on tissue proteome analysis. Although the 1990 group of leiomyomas demonstrated a slightly worse proteome performance in terms of total peptide, distinct peptide, and distinct protein identifications compared to leiomyomas cataloged in 1997 and 2002, excellent correlation among leiomyomas in quantitative proteomics was still achieved with a Pearson R2 value of greater than 0.97. Despite correlating among different patient samples, this value compares favorably with a recent report of a Pearson R2 correlation of 0.88 for performing technical replicates of the same protein digest using a multidimensional liquid chromatography system35.
Besides assessing proteomic data quality and reproducibility, several statistical measures, including the CV, k-means clustering, and ANOVA, were used to evaluate the possibility of an archival effect on individual proteins or groups of proteins within nine leiomyomas. That is, an archival effect may influence the retrieval of a protein or group of proteins over time and thus impact the subsequent proteomic measurements. For example, averaging the entire proteome data set for each averaged archival year shows an overall increase of average protein expression by 23% from the 1990 to 2002 groups. Furthermore, the k-means clustering suggests that there may be an archival effect for low abundance proteins detected and quantified by less than ten spectral counts in which these proteins are more difficult to be retrieved and extracted as the tissue block ages.
The expression values of three commonly used leiomyoma markers, including actin, desmin, and progesterone receptor, were remarkably consistent over twelve years of archival time from 1990 to 2002 and validated using IHC measurements. Furthermore, high confidence and comparative proteome analysis between the uterine leiomyomas and the vaginal sarcoma (ASPS) was achieved using the sarcoma tissue block dating back as many as 28 years ago. Despite sharing over 1,800 common proteins in a core set, a total of 80 proteins were uniquely identified in the sarcoma tissues. Furthermore, the single 1980 sarcoma case was well-distinguished from the nine leiomyomas by an unsupervised hierarchical cluster analysis27 even though the analyzers had no knowledge that one of the samples they had received was a substantially different tumor type.
The results summarized in this study indicate the possibility and potential of using archived specimens as an extensive resource of normal and diseased tissue for conducting retrospective and prospective screening of disease biomarkers. Still, the study is limited by the sample size with only ten blinded tissues and the lack of technical replications and replicate pooling. Variations in tissue sample preparation such as the degree of heat-induced reversal of protein cross-links36 further complicate the study. It should be emphasized that no attempts were made to discover remaining cross-linked peptides as our searches only sought to detect proteolytic peptides as the result of tryptic digestion with limited modifications. Thus, those protein fragments remained in cross-linking conditions after the retrieval treatment and overall sample preparation processes were not identified through our FFPE tissue proteome efforts.
Supplementary Material
Acknowledgments
This work was supported by NIH grants GM073723 to CSL and CA 122715 to FAT and BMB.
References
- 1.Lewis F, Maughan NJ, Smith V, Hillan K, Quirke P. J Pathol. 2001;195:66–71. doi: 10.1002/1096-9896(200109)195:1<66::AID-PATH921>3.0.CO;2-F. [DOI] [PubMed] [Google Scholar]
- 2.Hong H-HL, Dunnick J, Herbert R, Devereux TR, Kim Y, Sills RC. Environ Mol Mutagen. 2007;48:299–306. doi: 10.1002/em.20197. [DOI] [PubMed] [Google Scholar]
- 3.Shi SR, Cote RJ, Taylor CR. J Histochem Cytochem. 2001;49:931–937. doi: 10.1177/002215540104900801. [DOI] [PubMed] [Google Scholar]
- 4.Shi SR, Key ME, Kalra KL. J Histochem Cytochem. 1991;39:741–748. doi: 10.1177/39.6.1709656. [DOI] [PubMed] [Google Scholar]
- 5.Shi SR, Cote RJ, Taylor CR. J Histochem Cytochem. 1997;45:327–343. doi: 10.1177/002215549704500301. [DOI] [PubMed] [Google Scholar]
- 6.Gown AM. Am J Clin Pathol. 2004;121:172–174. doi: 10.1309/9G5F-Y3U3-QB4R-15DR. [DOI] [PubMed] [Google Scholar]
- 7.Ikeda K, Monden T, Kanoh T, Tsujie M, Izawa H, Haba A, Ohnishi T, Sekimoto M, Tomita N, Shiozaki H, Monden M. J Histochem Cytochem. 1998;46:397–403. doi: 10.1177/002215549804600314. [DOI] [PubMed] [Google Scholar]
- 8.Yamashita S, Okada Y. J Histochem Cytochem. 2005;53:1421–1432. doi: 10.1369/jhc.4A6579.2005. [DOI] [PubMed] [Google Scholar]
- 9.Prieto DA, Hood BL, Darfler MM, Guiel TG, Lucas DA, Conrads TP, Veenstra TD, Krizman DB. Biotechniques. 2005;Suppl:32–35. doi: 10.2144/05386su06. [DOI] [PubMed] [Google Scholar]
- 10.Jiang X, Jiang X, Feng S, Tian R, Ye M, Zou H. J Proteome Res. 2007;6:1038–1047. doi: 10.1021/pr0605318. [DOI] [PubMed] [Google Scholar]
- 11.Hwang SI, Thumar J, Lundgren DH, Rezaul K, Mayya V, Wu L, Eng J, Wright ME, Han DK. Oncogene. 2007;26:65–76. doi: 10.1038/sj.onc.1209755. [DOI] [PubMed] [Google Scholar]
- 12.Shi S-R, Liu C, Balgley BM, Lee C, Taylor CR. J Histochem Cytochem. 2006;54:739–743. doi: 10.1369/jhc.5B6851.2006. [DOI] [PubMed] [Google Scholar]
- 13.Guo T, Wang W, Rudnick PA, Song T, Li J, Zhuang Z, Weil RJ, DeVoe DL, Lee CS, Balgley BM. J Histochem Cytochem. 2007;55:763–772. doi: 10.1369/jhc.7A7177.2007. [DOI] [PubMed] [Google Scholar]
- 14.Xu H, Yang L, Wang W, Shi S-R, Liu C, Liu Y, Fang X, Taylor CR, Lee CS, Balgley BM. J Proteome Res. 2008;7:1098–1108. doi: 10.1021/pr7006768. [DOI] [PubMed] [Google Scholar]
- 15.Fang X, Yang L, Wang W, Song T, Lee C, Devoe D, Balgley B. Anal Chem. 2007;79:5785–5792. doi: 10.1021/ac070611a. [DOI] [PubMed] [Google Scholar]
- 16.Fang X, Wang W, Yang L, Chandrasekaran K, Kristian T, Balgley BM, Lee CS. Electrophoresis. 2008;29:2215–2223. doi: 10.1002/elps.200700609. [DOI] [PMC free article] [PubMed] [Google Scholar]
- 17.Liu H, Sadygov RG, Yates JR. Anal Chem. 2004;76:4193–4201. doi: 10.1021/ac0498563. [DOI] [PubMed] [Google Scholar]
- 18.Rappsilber J, Ryder U, Lamond AI, Mann M. Genome Res. 2002;12:1231–1245. doi: 10.1101/gr.473902. [DOI] [PMC free article] [PubMed] [Google Scholar]
- 19.Ishihama Y, Oda Y, Tabata T, Sato T, Nagasu T, Rappsilber J, Mann M. Mol Cell Proteomics. 2005;4:1265–1272. doi: 10.1074/mcp.M500061-MCP200. [DOI] [PubMed] [Google Scholar]
- 20.Shen Y, Berger SJ, Anderson GA, Smith RD. Anal Chem. 2000;72:2154–2159. doi: 10.1021/ac991367t. [DOI] [PubMed] [Google Scholar]
- 21.Chen J, Balgley BM, DeVoe DL, Lee CS. Anal Chem. 2003;75:3145–3152. doi: 10.1021/ac034014+. [DOI] [PubMed] [Google Scholar]
- 22.Yang L, Lee CS, Hofstadler SA, Smith RD. Anal Chem. 1998;70:4945–4950. doi: 10.1021/ac980223w. [DOI] [PubMed] [Google Scholar]
- 23.Geer LY, Markey SP, Kowalak JA, Wagner L, Xu M, Maynard DM, Yang X, Shi W, Bryant SH. J Proteome Res. 2004;3:958–964. doi: 10.1021/pr0499491. [DOI] [PubMed] [Google Scholar]
- 24.Elias JE, Haas W, Faherty BK, Gygi SP. Nat Methods. 2005;2:667–675. doi: 10.1038/nmeth785. [DOI] [PubMed] [Google Scholar]
- 25.Balgley BM, Laudeman T, Yang L, Song T, Lee CS. Mol Cell Proteomics. 2007;6:1599–1608. doi: 10.1074/mcp.M600469-MCP200. [DOI] [PubMed] [Google Scholar]
- 26.Elias JE, Gygi SP. Nat Methods. 2007;4:207–214. doi: 10.1038/nmeth1019. [DOI] [PubMed] [Google Scholar]
- 27.Eisen MB, Spellman PT, Brown PO, Botstein D. Proc Natl Acad Sci U S A. 1998;95:14863–14868. doi: 10.1073/pnas.95.25.14863. [DOI] [PMC free article] [PubMed] [Google Scholar]
- 28.Taylor CR. J Histochem Cytochem. 1979;27:1189–1191. doi: 10.1177/27.8.383824. [DOI] [PubMed] [Google Scholar]
- 29.Taylor CR. J Histochem Cytochem. 1980;28:777–787. doi: 10.1177/28.8.7003004. [DOI] [PubMed] [Google Scholar]
- 30.Shi SR, Cote C, Kalra KL, Taylor CR, Tandon AK. J Histochem Cytochem. 1992;40:787–792. doi: 10.1177/40.6.1588025. [DOI] [PubMed] [Google Scholar]
- 31.Fowler CB, Cunningham RE, O’Leary TJ, Mason JT. Lab Invest. 2007;87:836–846. doi: 10.1038/labinvest.3700596. [DOI] [PubMed] [Google Scholar]
- 32.Balgley BM, Wang W, Song T, Fang X, Yang L, Lee CS. Electrophoresis. 2008;29:3047–3054. doi: 10.1002/elps.200800050. [DOI] [PubMed] [Google Scholar]
- 33.Zhang B, VerBerkmoes NC, Langston MA, Uberbacher E, Hettich RL, Samatova NF. J Proteome Res. 2006;5:2909–2918. doi: 10.1021/pr0600273. [DOI] [PubMed] [Google Scholar]
- 34.Turck CW, Falick AM, Kowalak JA, Lane WS, Lilley KS, Phinney BS, Weintraub ST, Witkowska HE, Yates NA. Mol Cell Proteomics. 2007;6:1291–1298. doi: 10.1074/mcp.M700165-MCP200. [DOI] [PubMed] [Google Scholar]
- 35.Lu P, Vogel C, Wang R, Yao X, Marcotte EM. Nat Biotechnol. 2007;25:117–124. doi: 10.1038/nbt1270. [DOI] [PubMed] [Google Scholar]
- 36.Nirmalan NJ, Harnden P, Selby PJ, Banks RE. Mol Biosyst. 2008;4:712–720. doi: 10.1039/b800098k. [DOI] [PubMed] [Google Scholar]
Associated Data
This section collects any data citations, data availability statements, or supplementary materials included in this article.


