Abstract
The Q cycle mechanism proposed by Peter Mitchell in the 1970’s explicitly considered the modification of ubiquinone two-electron redox properties upon binding to Complex III to match the thermodynamics of the other single-electron redox cofactors in the complex, and guide electron transfer to support the generation of a proton electro-chemical gradient across native membranes. A better understanding of the engineering of Complex III is coming from a now moderately well defined thermodynamic description of the redox components as a function of pH, including the Qi/heme bH cluster. The redox properties of the most obscure component, Qo, is finally beginning to be resolved.
Keywords: Complex III, cytochrome bc1, quinone, Q-cycle, redox midpoint potential
How Complex III fits into chemiosmotic bioenergetic scheme
More than 40 years ago Peter Mitchell (Figure 1) proposed a revolutionizing view of how the various bioenergetic membrane proteins, then being biochemically resolved, worked together to convert the redox energy of respiration and photosynthesis into the ATP phosphorylation potential required for powering the cytosolic synthetic reactions in the cell (Mitchell, 1961). At the core of the chemiosmotic hypothesis is the special chemical properties of two-electron redox centers that couple electron transfer and proton transfer. In Mitchell’s view, the respiratory chain was made up of a series of transmembrane redox loops in which protons joined with electrons in a carrier, such as oxidized quinone (Q), at binding sites on one face of the membrane, drifted across the membrane in electrically neutral reduced form (QH2), and were released to the other aqueous compartment upon carrier oxidation. Electrons were passed through a series of one-electron redox centers back across the membrane in an electrogenic fashion. The net effect was to convert redox energy into an electrochemical gradient across the membrane comprised of both a proton gradient and a transmembrane electric field.
Figure 1.
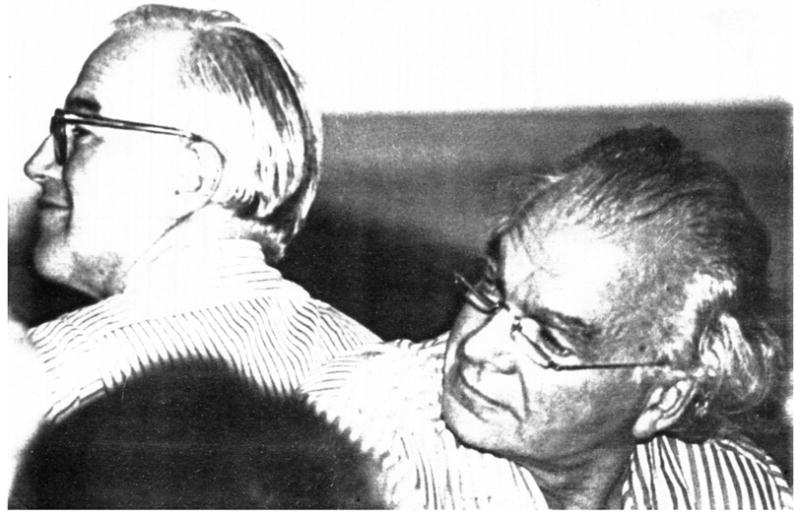
Chance (left) and Mitchell (right) at a 1978 “Molecules to Tissues” meeting sponsored by the Johnson Foundation in Philadelphia. Photographer Ken Ray.
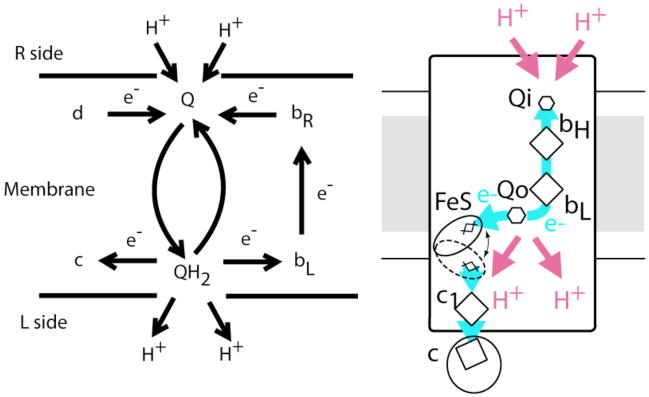
It was clear that Complex III, the bc1 complex in mitochondrial respiration, was more sophisticated than a simple loop. In 1952, Chance (Figure 1) had observed the peculiar phenomena of “oxidant-induced reduction” in which the addition of an oxidant to anaerobic yeast cells resulted in the reduction of the b cytochromes (Chance, 1952). Mitchell responded to attempts to explain Chance’s puzzling observation in terms of the two-electron quinone chemistry (Wikstrom & Berden, 1972) with the development of his Q cycle for Complex III (Mitchell, 1975a; Mitchell, 1975b; Mitchell, 1976). In the Q-cycle, Complex III has two quinone binding sites on opposite sides of the membrane, and is capable of splitting the two electrons of the redox couple into electron transfers with two different 1-electron redox cofactors (Figure 2). For every two electrons delivered to Complex III in the form of reduced quinone QH2 and guided eventually to two oxidized water soluble cytochromes c, the Qo site is host to two full quinone oxidations and the Qi site to one full quinone reduction. At each turnover of the Qo site, one electron is delivered to the high potential chain, and one to the low potential chain. The cycling of oxidized quinone from the Qo site to the Qi site for re-reduction, together with electrogenic return of the electrons from Qo to Qi along the low potential cytochrome b chain, gives Complex III a relatively high energy-transduction efficiency per mV of redox energy expended.
Figure 2.
A Q-cycle for Complex III as proposed by Mitchell (left) and as realized in a schematic of Complex III based upon structural information from x-ray crystallography (right).
In the Mitchell representation, redox component “c” is now associated with the Reiske FeS cluster and high potential redox chain components cyt c1 and c; the R side cyt bR is now called cyt bH, for high potential cytochrome b; redox component “d” and cyt bR are one and the same, as the quinone at Qi receives electrons in succession from cyt bH.
Redox properties of Q in Complex III
The action of Complex III is utterly dependent upon the ability of the Complex III protein to modify the redox properties of the pool ubiquinone at each of the binding sites. At Qo, the first electron is removed from the reduced QH2 at a relatively oxidizing midpoint potential to head down the high potential c chain, while the second electron is removed at a relatively reducing midpoint potential, to head down the low potential chain. This large split of the two redox couples of the quinone leads to a small equilibrium constant for the intermediate semiquinone state at complete redox equilibrium, sometimes referred to as a low semiquinone stability constant, or Kstab. The concept of Kstab as a measure of the Em split is useful even if the quinones bound to the bc1 complex are not in complete redox equilibrium. Some experimental estimate of the Qo redox couples has recently been provided (see next section).
In contrast, the environment of the Qi binding site forces the two quinone redox couples to be much more similar. Indeed, semiquinone at Qi has been observed many times; under mildly alkaline conditions in certain species the redox midpoint potentials of the couples are essentially identical and the three redox species, oxidized quinone, semiquinone and fully reduced quinol, can reach equilibrium at equal 1/3 concentrations. For example, SQi reaches a maximum amplitude of ~0.3 to 0.4 per Complex III at the average Q/QH2 Em at alkaline pH (Robertson et al., 1984).
Search for SQo
Although Mitchell’s proposal explicitly considered a semiquinone as part of his Q-cycle mechanism at both the Qo and Qi sites, direct observation of the predicted SQ at Qo has proven much more difficult. Indeed, the process has taken 30 years and the results are still not without question.
In 1979 Takamiya and Dutton (Takamiya & Dutton, 1979) redox poised Rb. sphaeroides bioenergetic membranes and extracted the quinone to determine the amount of quinone oxidized and the amount reduced as a function of poised redox potential (Eh). In this way they defined the size and redox midpoint potential of the bulk of the quinones in the membrane, the quinone pool: 19 out of 25 quinone per reaction center with an Em7 of 90 mV. They also examined the redox poised membranes explicitly for evidence of semiquinone by EPR and at pH 6 did not detect any clear signal.
A couple years later, de Vries et al. (de Vries et al., 1981) announced the trapping of SQo in mitochondrial Complex III as a BAL sensitive signal uncovered under non-equilibrium conditions after adding NADH and antimycin and freezing beef heart submitochondrial particles. BAL or British anti-lewisite (2,3-dimercaptopropanol) chelates heavy metals and is expected to destroy the Rieske FeS center and so probe adjacent Qo. Compared with the antimycin sensitive SQ signal at Qi (g=2.005, 10 gauss wide) the signal attributed to SQo was narrower (8.8 gauss), with a slightly different g value (2.006) and required less power to saturate. Since this was a non-equilibrium method, the redox midpoint potential of the semiquinone couples could not be determined. However, in 1998, Junemann et al. (Junemann et al., 1998) revisited this work to show that de Vries’s putative SQ signal was insensitive to a modern collection of Qo site inhibitors (myxothiaol, MOA-stilbene and stigmatelin) and thus highly unlikely to be associated with the Qo site. Even quite recent stopped flow work failed to uncover any signal associated with SQ at Qo (Zhu et al., 2007).
Last year there were two new approaches that reveal a semiquinone signal associated with Complex III that is sensitive to stigmatellin, a tight binding Qo site inhibitor. Anaerobic freeze-quenching 10 ms after rapid mixing of antimycin inhibited Complex III isolated from the photosynthetic bacterium Rb. capsulatus with decyl-ubiquinone (Cape et al., 2007) revealed a stigmatellin sensitive semiquinone EPR signal. The g-value was 2.0054 with an 11.9 gauss line width. Although this signal appears to be at or near the Qo site, it does not show any clear magnetic interactions with the Rieske FeS cluster.
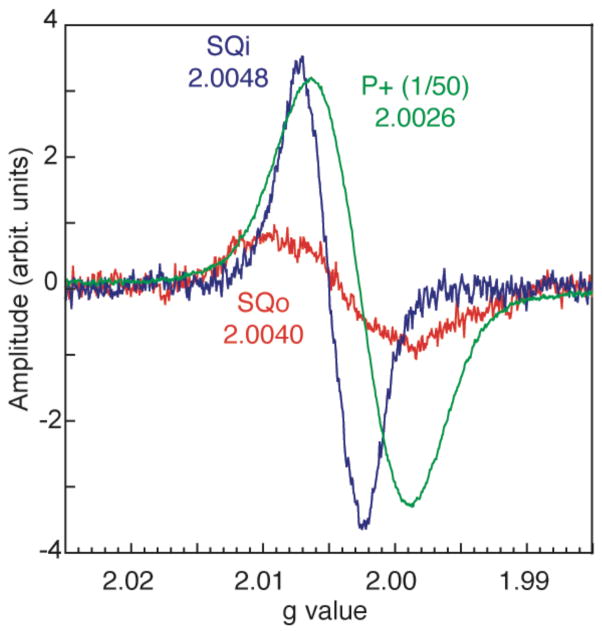
A very different approach was explored by Zhang et al. (Zhang et al., 2007). They used light activated photosynthetic membranes in which the thermodynamics of the Qo site was deliberately driven to make the production of SQo most favorable. After a series of light flashes, the high potential c chain becomes highly oxidized. This in turn stimulates Q pool oxidation at the Qo site and loads the low potential b chain with reducing equivalents. With a bH knock out mutant of Complex III, there is only cyt bL to absorb the reducing equivalents and establish a pseudo-equilibrium in which the average of the redox potential of the c chain and the b chain balances the redox potential of the Q pool (Osyczka et al., 2004). This pseudo-equilibrium lasts for about 15 seconds before short-circuit reactions begin to take place between the high and low potential redox chains, long enough to take visible spectra and freeze the samples for EPR spectroscopic analysis. These conditions, in which the high potential chain is very oxidized, are the most favorable to strip an electron from a second QH2 at Qo to form SQ. Figure 4 reveals that under alkaline conditions at pH 9, the high potential chain is sufficiently oxidizing to generate a SQ. The g value of this species appears to be around 2.0040 and is wider than Qi at 11.7 gauss. Because the stoichiometry of the redox components involved in the pseudo-equilibrium between the c and b chains and the Q pool is known, the split between the redox couples for the Qo species can be estimated at about 880 mV with the QH2/SQ couple at about 410 mV at pH 9. The effective stability constant is about 10−14 to 10−15, which means that under most physiologically active conditions the concentration of SQ at Qo will be very small, and unproductive side reactions of this radical species (such as interaction with oxygen to form superoxide under aerobic conditions) will be minimized.
Figure 4.
Stigmatellin sensitive SQ associated with the Qo site of flash activated Complex III has different g values and line widths compared with light activated radical signals associated with antimycin sensitive Qi or the oxidized bacteriochlorophyll dimer P+ produced in frozen samples under continuous illumination.
This signal can also be observed in purified systems in addition to the native membranes just described. A hybrid protein system of purified Complex III mixed with purified reaction center and cytochrome c2 allows us to adjust the stoichiometry of each protein and hence the oxidizing power of high potential chain upon flash activation. This allows us to reproduce the flash-induced SQo signal even with the operation of the full cyt b chain in purified wild type Complex III, when the Qi site is inhibited with antimycin. Surprisingly, the flash induced semiquinone signal is highly sensitive to the Qo site inhibitor stigmatellin but relatively insensitive to the inhibitor myxothiazol, which also prevents full turnover of the Qo site. However, myxothiazol binds to a different region in the Qo site than stigmatellin, and there is evidence from EPR studies of native and quinone extracted membranes that quinone can still be bound near the FeS cluster when myxothiazol is present (Sharp et al., 1999). It appears that when quinone is bound near the FeS cluster and an oxidized high potential chain, it is still capable of forming the semiquinone on the seconds timescale of the flash and freeze experiments described here.
The role of these semiquinone signals associated with Qo is still far from certain. It is not clear, for example, that the SQ so formed is part of the ordinary catalytic cycle or some sort of reactive side product that is avoided in normal activity. Semiquinone radical states in the Qo site have the potential to participate in physiologically productive reactions or unproductive short circuit reactions or destructive reactions in the presence of oxygen. By engineering a large split in the Qo redox couples, the steady state concentration of SQo will be lowered. However, unless the physiological reaction is a truly concerted reaction with no recognizable semiquinone intermediate, SQ needs to be formed fast enough to allow catalysis, which raises the short-circuit and by pass reaction dangers (Osyczka et al., 2004). This means that more than one type of gating sensitive to the Qo, heme bL and FeS redox states is required to permit productive electron transfer to and from SQo while preventing the several possible short-circuit reactions. After 30 years of searching, these signals provide an opportunity to observe the properties of intermediate quinone redox states and test the various hypotheses about the engineering of this central bioenergetic reaction.
Redox states of other Complex III centers
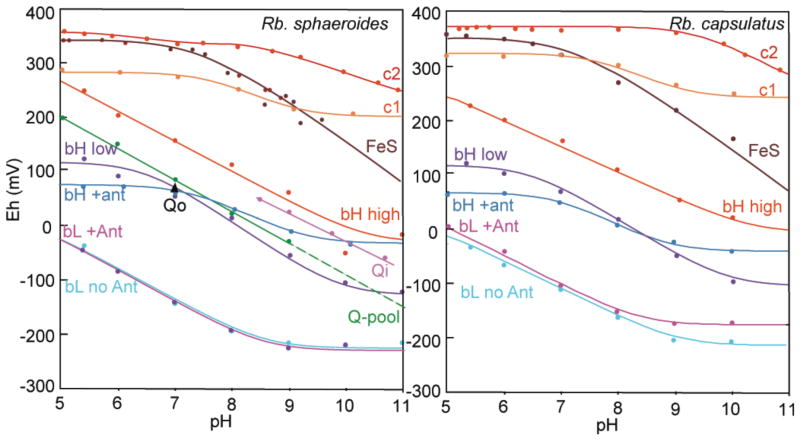
Understanding the engineering design of Complex III and the operating limits of failure of the Q-cycle require a firm understanding of the redox properties of all the components. The redox properties are well described for the c heme and FeS components (Figure 5). The high potential end is held by cyt c2, which has a mild pH dependence as measured by Pettigrew (Pettigrew et al., 1976). The Rieske FeS cluster has a pKox near neutral pH and a mixed pH dependency in both Rb. sphaeroides (Ugulava & Crofts, 1998; Zu et al., 2003) and Rb. capsulatus (Osyczka et al., 2004). Cytochrome c1, measured in the two species here, has pKox and pKred close to one another near neutral pH and a mild pH dependency. Mutants of c1 that affect iron ligation or important disulfides can profoundly modulate the cyt c1 midpoint potential, and slow, or even disable electron transfer through the high potential chain (Osyczka et al., 2001; Zhang et al., 2006).
Figure 5.
Redox midpoint potentials of the components of Complex III in two different species of photosynthetic bacteria as a function of pH.
Measurements of the Qpool size and redox properties were performed by Takamiya as described and measurements of the Qi redox properties under alkaline conditions where SQi is readily detectable have also been done (Robertson et al., 1984). The average Qo redox properties have been measured in Rb. sphaeroides using the proxy of the nearby FeS cluster which changes its spectral properties as quinone is oxidized, reduced, or removed (Ding et al., 1992).
The redox properties of the b hemes are a little more difficult to access, as they are apparently less accessible to typical redox dyes, are prone to a certain amount of hysteriesis when comparing oxidative and reductive titrations, and also have overlapping spectral properties. Our group and others (Crofts et al., in press) have measured the pH dependency of the redox behavior of the b hemes. There is a strong pH dependence of the heme bL under acidic conditions, with a pKred between pH 8 and 9, which begins the pH independence of the Em. These redox properties are mostly independent of added antimycin, which binds near heme bH not bL.
The redox behavior of heme bH has been a puzzle for more than 30 years. Original redox titrations of b hemes in Complex III in 1971 revealed three waves, with the highest potential species labeled b150 (Dutton et al., 1970). There are only two b hemes in the complex and the extra species seems to be a high vs. low potential form of heme bH. The distinction between a high and low potential form disappears when the Qi site inhibitor antimycin is added. Figure 5 plots our measurement of the pH dependence of the midpoint potential of these high and low potential waves of heme bH and Figure 6 shows the relative amplitude of these waves as a function of pH.
Figure 6.
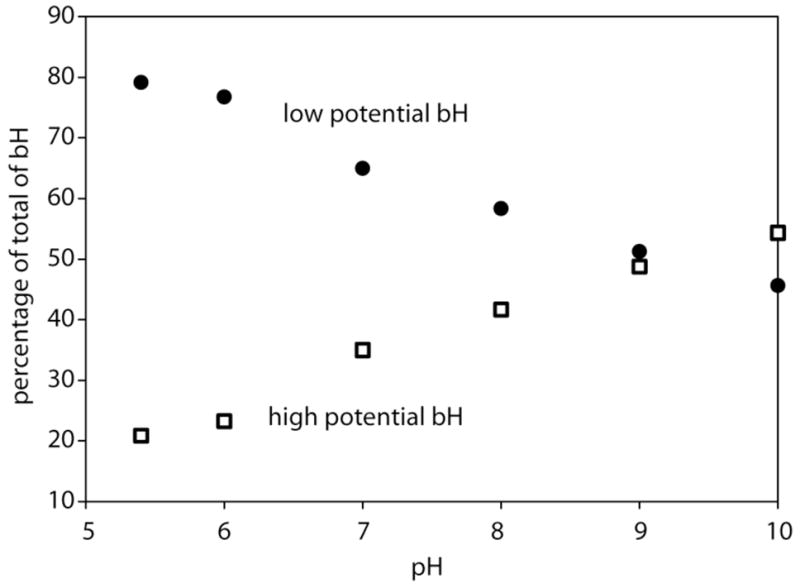
The amplitudes of the high and low potential waves of heme bH in Rb. sphaeroides.
Salerno (Salerno et al., 1989) suggested that the Qi redox state affects bH heme EPR and Em. Indeed, later crystal structures indicated that Qi and heme bH are in near contact, providing ample opportunity for electrostatic interactions between the pairs. Rich (Rich et al., 1990) simulated redox titrations in mitochondria of both the b hemes by optical spectroscopy and the Qi semiquinone by EPR that provided estimates of the energetics of this electrostatic interaction. He considered the idea that semiquinone in the Qi site was responsible for the observation of a high potential form of bH. On the basis of Complex III work by Siedow et al., Rich assumed that there was a diamagnetic, exchanged-coupled complex between the low-spin oxidized b heme and semiquinone that rendered these species EPR invisible and thus underestimated the amount of SQi present when heme bH was oxidized. This spin silencing was considered analogous to the suppression of the spin signal of the Rieske FeS cluster when it interacts with the semiquinone form of the Qo site inhibitor DBMIB in cytochrome b6f (Malkin, 1981). Thus it was possible that much of the high potential bH form was correlated with the presence of EPR silent SQi. With these assumptions, his simulations arrived at values of the bH redox potential that dropped about 60 mV when Qi was reduced to semiquinone or fully reduced quinol. In a complementary way, the Qi redox couples were affected by the redox state of the nearby heme bH.
These early Siedow redox experiments with purified Complex III from yeast (Siedow et al., 1978) found a peculiar discrepancy between the optical and magnetic signatures of the total b heme redox changes as aliquots of the reductant dithionite were added to the preparation. Because no redox dyes were added to assure redox equilibrium and provide a measurement of redox potential, the data were plotted as equivalents of dithionite added per heme c1. Later experiments with quinone-extracted preparations did not see this mismatch of the heme b EPR and optical signals, which re-enforced the model that semiquinone was responsible for the invisibility of the oxidized b heme in EPR and vice versa (de la Rosa & Palmer, 1983).
There are other reports that the cast doubt on this Qi site magnetic interaction and EPR invisibility. A more careful examination of the SQi EPR properties by Kolling et al. (Kolling et al., 2003), in which the SQi state was created in several different ways, casts doubt on the spin silencing proposed by de la Rosa. Also, Salerno’s (Salerno et al., 1989) EPR titrations of b heme and SQi don’t seem to show the discrepancy noted by Siedow. One possibility is that Siedow’s redox-mediator-free preparations allowed some discrepancies in his distribution of redox states in his optical vs. EPR samples, a situation that is exacerbated by the tendency of the b hemes to reach redox equilibrium more slowly than the other redox centers.
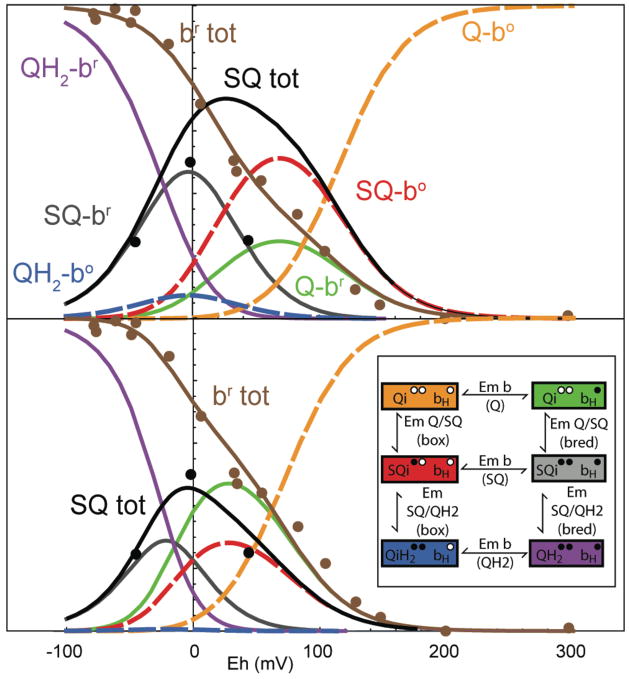
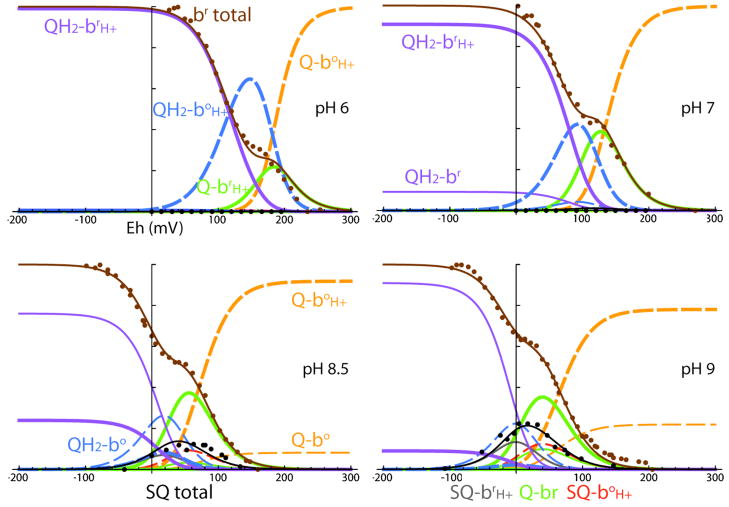
Our analysis shows it is not necessary to assume that SQi is invisible when heme bH is oxidized in order to understand the redox titration behavior of bH and Qi together. Perfectly consistent fits can be made to the data without assuming EPR invisibility. Indeed, we prefer a model in which EPR signals can be taken at face value, if only because of its simplicity. Figure 7 compares the ‘invisibility’ and ‘no invisibility’ models with the data considered by Rich at a single pH. Figure 8 shows a more extensive set of data we collected from the Rb. sphaeroides system and a fit model that assumes no invisibility. In this fit, the Em of heme bH was dropped 14 mV when oxidized Qi is replaced by SQi and 37 mV when Qi is replaced by QiH2. The model fits the low potential Em of heme bH at 127 mV with a pKred of 8.4 when QH2 is present. The low pH midpoint potentials of the two Qi couples are split by 180 mV (so that little SQi is seen at acidic pH) with pK values on the quinone, semiquinone and quinol states that are high (9.6), low (6.0) and in the middle (8.0) respectively, which allows SQi to be conspicuous at alkaline pH.
Figure 7.
Experimental redox titrations of heme bH (brown) and SQi (black) in mitochondria at pH 8.45, can be fit by Nernst models that assume SQi is EPR silent when heme bH is oxidized (top, (Rich et al., 1990)), or that SQi is not EPR silent (bottom, this work). The 6 redox microstates and the 7 redox midpoint potentials between them are shown at lower right.
Figure 8.
Redox titrations at several different pHs for heme bH (brown) and SQi (black) in Rb. sphaeroides membranes. These fits do not assume that SQi is EPR silent when heme bH is oxidized. With three redox states of Qi and two redox states of heme bH, each of which can be protonated or not, there are in principle 12 possible species in this system; however, in practice several minor species can be ignored. Protonated states of heme bH are shown as thick lines, unprotonated as thin; reduced states of heme bH are shown as solid lines, oxidized states as dashed lines. Optical redox titrations of heme bH reported here are shown as brown dots, with the brown fit line showing the total b reduced. EPR redox titrations of semiquinone (Robertson et al., 1984) are shown as black dots, with the black fit line the total SQi.
Not only do the redox states of Qi affect the redox properties of heme bH, but replacing the quinone with the inhibitor antimycin has its own effect (see Figure 5). Not surprisingly, extraction of the quinone from the Qi site also affects the redox properties of heme bH. Salerno (Salerno et al., 1989) suggests Q extraction (like oxidized Qi) makes bH high potential in mitochondria. We disagree with this suggestion, at least in extracted chromatophore membranes, as redox titrations of extracted chromatophores show that heme bH is not high potential. This effect of unbound Qi may also help to explain the b heme titrations of mutants around the Qi site of Gray et al. (Gray et al., 1994). We suspect some of the Gray observations can be attributed to Qi binding weakly in some mutants.
Summary
The redox properties of quinone in Complex III are beginning to be filled out. It appears that the split between the two redox couples, which Mitchell estimated at about 600 mV in the Q pool (Mitchell, 1976), is dramatically decreased at Qi, to a value near zero at alkaline pH. This leads to a moderately stable SQ at Qi with moderately reducing redox midpoint potential, allowing it to fulfill the role of single electron acceptor from heme bH. In contrast, the split between the two redox couples of the Q pool is increased when the quinone binds at Qo, to about 880 mV, leading to very small amount of SQo being formed under normal circumstances. This split allows a match of the two quinone redox couples with their redox partners in the high potential chain and in the low potential chain. This redox split reduces the amount of SQo seen under normal circumstances and would contribute to reducing the threat of short circuits and harmful side reactions with oxygen. It does however, open up the threat of quinone redox couples reacting with the wrong redox chain which would lead to energy wasting short-circuits, suggesting that if the SQo is a genuine intermediate in the normal Complex III catalytic cycle, then it should be subject to gates that minimize the short-circuit possibilities (Osyczka et al., 2004; Osyczka et al., 2005).
The puzzling behavior of redox titrations of heme bH can be largely understood as redox titrations of a Qi/bH binuclear center with moderately strong electrostatic interactions between the couples. The heme bH optical redox titration follows only one of the two redox components and shows multiple waves. Indeed, it is even possible during the redox titration of strongly coupled redox center pairs, that dropping the redox potential can lead to a slight oxidation of one of the couples while the other member goes reduced, leading to strange looking redox titrations. Redox behavior of the Qi/bH redox pair does not appear to require a special EPR coupling between SQi and oxidized heme bH in order to simultaneously model the observed levels of reduction of both Qi and bH.
Figure 3.
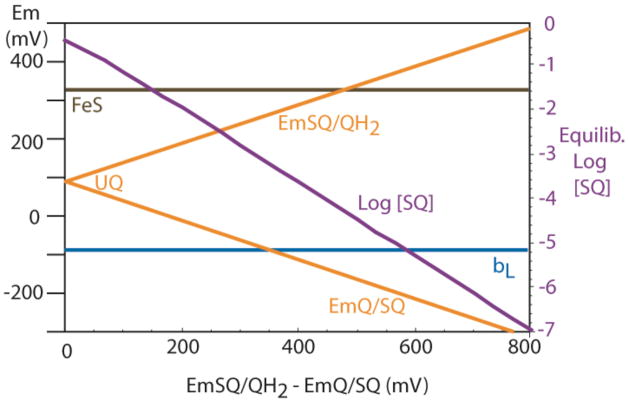
Increasing the split in the two one-electron redox couples of quinone (left and horizontal axes) leads to less and less SQ produced under equilibrium conditions (right axis). Eventually, the electron transfer reactions of reduced ubiquinol at the Qo site becomes unfavorable for electron transfer with both of its redox partners, first cyt bL, then Rieske FeS.
Acknowledgments
Supported by grants GM 27309 (PLD) and a NSF Graduate Student Research Fellowship (SEC).
Footnotes
“Peter Mitchell 30th anniversary” issue of Journal of Bioenergetics & Biomembranes
References
- Cape JL, Bowman MK, Kramer DM. Proc Natl Acad Sci, U S A. 2007;104 doi: 10.1073/pnas.0702621104. [DOI] [PMC free article] [PubMed] [Google Scholar]
- Chance B. Second International Conference of Biochemistry; Paris. 1952. [Google Scholar]
- Crofts AR, Holland JT, Victoria D, Kolling RJ, Dikanov SA, Gilbreth R, Lhjee S, Kuras R, Kuras MG. Biochim Biophys Acta. 2008 doi: 10.1016/j.bbabio.2008.04.037. In Press. [DOI] [PMC free article] [PubMed] [Google Scholar]
- de la Rosa FF, Palmer G. FEBS Lett. 1983;163:140–143. doi: 10.1016/0014-5793(83)81181-8. [DOI] [PubMed] [Google Scholar]
- de Vries S, Albracht SPJ, Berden JA, Slater EC. J Biol Chem. 1981;256(23):11996–11998. [PubMed] [Google Scholar]
- Ding H, Robertson DE, Daldal F, Dutton PL. Biochemistry-Us. 1992;31(12):3144–3158. doi: 10.1021/bi00127a015. [DOI] [PubMed] [Google Scholar]
- Dutton PL, Wilson DF, Lee CP. Biochemistry-Us. 1970;9(26):5077–5082. doi: 10.1021/bi00828a006. [DOI] [PubMed] [Google Scholar]
- Gray KA, Dutton PL, Daldal F. Biochemistry-Us. 1994;33(3):723–733. doi: 10.1021/bi00169a014. [DOI] [PubMed] [Google Scholar]
- Junemann S, Heathcote P, Rich PR. Journal of Biological Chemistry. 1998;273(34):21603–21607. doi: 10.1074/jbc.273.34.21603. [DOI] [PubMed] [Google Scholar]
- Kolling DRJ, Samoilova RI, Holland JT, Berry EA, Dikanov SA, Crofts AR. J Biol Chem. 2003;278(41):39747–39754. doi: 10.1074/jbc.M305913200. [DOI] [PubMed] [Google Scholar]
- Malkin R. Febs Lett. 1981;131:169–172. [Google Scholar]
- Mitchell P. Nature. 1961;191:144–148. doi: 10.1038/191144a0. [DOI] [PubMed] [Google Scholar]
- Mitchell P. FEBS Lett. 1975a;59:137–139. doi: 10.1016/0014-5793(75)80359-0. [DOI] [PubMed] [Google Scholar]
- Mitchell P. FEBS Lett. 1975b;56:1–6. doi: 10.1016/0014-5793(75)80098-6. [DOI] [PubMed] [Google Scholar]
- Mitchell P. J Theor Biol. 1976;62:327–367. doi: 10.1016/0022-5193(76)90124-7. [DOI] [PubMed] [Google Scholar]
- Osyczka A, Dutton PL, Moser CC, Darrouzet E, Daldal F. Biochemistry-Us. 2001;40:14547–14556. doi: 10.1021/bi011630w. [DOI] [PubMed] [Google Scholar]
- Osyczka A, Moser CC, Daldal F, Dutton PL. Nature. 2004;427(6975):607–612. doi: 10.1038/nature02242. [DOI] [PubMed] [Google Scholar]
- Osyczka A, Moser CC, Dutton PL. Trends in Biochemical Sciences. 2005;30(4):176–182. doi: 10.1016/j.tibs.2005.02.001. [DOI] [PubMed] [Google Scholar]
- Pettigrew GW, Meyer TE, Bartsch RG, Kamen MD. Biochim Biophys Acta. 1976;430(2):197–208. doi: 10.1016/0005-2728(76)90079-7. [DOI] [PubMed] [Google Scholar]
- Rich PR, Jeal AE, Madgwick SA, Moody AJ. Biochim Biophys Acta. 1990;1018(1):29–40. doi: 10.1016/0005-2728(90)90106-e. [DOI] [PubMed] [Google Scholar]
- Robertson DE, Prince RC, Bowyer JR, Matsuura K, Dutton PL, Ohnishi T. J Biol Chem. 1984;259:1758–1763. [PubMed] [Google Scholar]
- Salerno JC, Xu Y, Osgood MP, Kim CH, King TE. J Biol Chem. 1989;264(26):15398–15403. [PubMed] [Google Scholar]
- Sharp RE, Gibney BR, Palmitessa A, White JL, Dixon JA, Moser CC, Daldal F, Dutton PL. Biochemistry-Us. 1999;38(45):14973–14980. doi: 10.1021/bi9914863. [DOI] [PubMed] [Google Scholar]
- Siedow JN, Power S, de la Rosa FF, Palmer G. J Biol Chem. 1978;253:2392–2399. [PubMed] [Google Scholar]
- Takamiya K, Dutton PL. Biochim Biopphys Acta. 1979;546:1–16. doi: 10.1016/0005-2728(79)90166-x. [DOI] [PubMed] [Google Scholar]
- Ugulava NB, Crofts AR. FEBS Lett. 1998;440:409–413. doi: 10.1016/s0014-5793(98)01493-8. [DOI] [PubMed] [Google Scholar]
- Wikstrom MK, Berden JA. Biochim Biophys Acta. 1972;283(3):403–420. doi: 10.1016/0005-2728(72)90258-7. [DOI] [PubMed] [Google Scholar]
- Zhang HB, Osyczka A, Moser CC, Dutton PL. Biochemistry-Us. 2006;45(48):14247–14255. doi: 10.1021/bi061345i. [DOI] [PubMed] [Google Scholar]
- Zhang HB, Osyczka A, Dutton PL, Moser CC. Biochim Biophys Acta. 2007;1767:883–887. doi: 10.1016/j.bbabio.2007.04.004. [DOI] [PMC free article] [PubMed] [Google Scholar]
- Zhu J, Egawa T, Yeh SR, Yu L, Yu CA. Proc Natl Acad Sci, U S A. 2007;2007:4864–4869. doi: 10.1073/pnas.0607812104. [DOI] [PMC free article] [PubMed] [Google Scholar]
- Zu Y, Couture MM, Kolling DR, Crofts AR, Eltis LD, Fee JA, Hirst J. Biochemistry-Us. 2003;42:12400–12408. doi: 10.1021/bi0350957. [DOI] [PubMed] [Google Scholar]


