

Abstract
The biological effects of 1α,25-dihydroxyvitamin D3 (1,25(OH)2D3) are terminated primarily by P450-dependent hydroxylation reactions. However, the hormone is also conjugated in the liver and a metabolite, presumably a glucuronide, undergoes enterohepatic cycling. In this study, the identity of human enzymes capable of catalyzing the 1,25(OH)2D3 glucuronidation reaction was investigated in order to better understand environmental and endogenous factors affecting the disposition and biological effects of vitamin D3. Among twelve different UGT isozymes tested, only UGT1A4 ≫ 2B4 and 2B7 supported the reaction. Two different 1,25(OH)2D3 monoglucuronide metabolites were generated by recombinant UGT1A4 and human liver microsomes. The most abundant product was identified by mass spectral and NMR analyses as the 25-O-glucuronide isomer. The formation of 25-O-glucuronide by UGT1A4 Supersomes and human liver microsomes followed simple hyperbolic kinetics, yielding respective Km and Vmax values of 7.3 and 11.2 μM, and 33.7 ± 1.4 and 32.9 ± 1.9 pmol/min/mg protein. The calculated intrinsic 25-O-glucuronide M1 formation clearance for UGT1A4 was 14-fold higher than the next best isozyme, UGT2B7. There was only limited (4-fold) inter-liver variability in the 25-O-glucuronidation rate, but it was highly correlated with the relative rate of formation of the second, minor metabolite. In addition, formation of both metabolites was inhibited > 80% by the selective UGT1A4 inhibitor, hecogenin. If enterohepatic recycling of 1,25(OH)2D3 represents a significant component of intestinal and systemic 1,25(OH)2D3 disposition, formation of monoglucuronides by hepatic UGT1A4 constitutes an important initial step.
Keywords: human liver microsomes, high performance liquid chromatography, liquid chromatography-tandem mass spectrometry, liquid chromatography-mass spectrometry
1. Introduction
Variable CYP3A4 catalytic activity in the small intestine contributes to inter-individual differences in the oral bioavailability and efficacy/toxicity of many drugs. Much of this variability results from differences in CYP3A4 protein content, which can vary more than 8-fold even in mucosal epithelium obtained from healthy volunteers [1, 2]. Although the source of that variability is probably multi-factorial, some studies have documented dynamic changes in CYP3A4 transcription that can occur following activation of the vitamin D receptor (VDR) by its natural ligand, 1α,25-dihydroxyvitamin D3 (1,25(OH)2D3) [3, 4, 5, 6]. The intestinal mucosa is an important target tissue for 1,25(OH)2D3, where it regulates the expression of calcium binding and transport proteins and helps maintain calcium homeostasis throughout the body [7, 8, 9]. In addition, we have recently shown that up-regulation of CYP3A4 gene expression by 1,25(OH)2D3 may provide negative feedback control of the hormone’s biological effects in the intestine through CYP3A4-catalyzed metabolism of 1,25(OH)2D3 to inactive oxidation products [10].
Delivery of 1,25(OH)2D3 to the intestinal mucosa can occur by either vascular or luminal routes. Although 1,25(OH)2D3 is highly bound to plasma proteins, diffusion of free 1,25(OH)2D3 and/or its uptake across the basolateral enterocyte cell surface are thought to occur[11]. Alternatively, studies utilizing radiolabeled 1,25(OH)2D3 have shown that a putative glucuronide conjugate of the hormone is excreted into bile and, in some chemical form, gets reabsorbed through intestinal enterocytes into portal blood [12, 13]. Glucuronidation of different vitamin D species has been well documented [14, 15, 16, 17, 18], and it is reasonable to hypothesize that a glucuronide metabolite of 1,25(OH)2D3 is formed in human liver, exported into the bile, and delivered to the duodenum. Once there, it could be hydrolyzed by β-glucuronidases, permitting absorption of the active hormone across the apical membrane of enterocytes and transcriptional activation of VDR gene targets such as CYP3A4. This mechanism has significant appeal, because it might explain the preferential expression of CYP3A4 in proximal sections of the small intestine, compared to more distal regions [19].
A necessary first step in the enterohepatic recycling of 1,25(OH)2D3 and regulation of intestinal CYP3A4 by the mechanism we propose would likely involve a conjugation reaction catalyzed by hepatic UDP-glucuronosyltransferase(s). In this study, experiments were conducted to characterize the glucuronidation of 1,25(OH)2D3 and to identify which of the human liver UGT isozymes is responsible for catalyzing the reaction(s).
2. Materials and methods
2.1. Chemicals
Uridine-5′-diphosphoglucuronic acid (UDPGA), saccharic acid 1,4-lactone, alamethicin, trifluoperazine, β-estradiol-17-glucuronide, 4-phenyl-1,2,4-triazoline-3,5-dione (PTAD) and β-glucuronidase (Helix pomatia) were purchased from Sigma-Aldrich (St. Louis, MO). 1,25(OH)2D3 and hecogenin were purchased from Tetrionics (Madison, WI) and Science Lab. Com. (Kingwood, TX), respectively. 1,25(OH)2D3 used for Semi-Preparative Biosynthesis of the 25-O-glucuronide metabolite was obtained from Alexis Biochemicals (San Diego, CA). All other chemicals and solvents were of the highest grade commercially available.
2.2. Human liver microsomes and recombinant UGT isozymes
Human liver microsomes (HLM) were prepared by standard ultracentrifugation techniques [20] from nineteen different donor livers selected from the University of Washington Human Liver Bank and five different donor livers selected from the Eli Lilly liver bank. The protein concentration in each HLM was measured by the method of Lowry et al [21] using bovine serum albumin as the reference standard. For some kinetic and inhibition experiments, samples from five representative livers were pooled. Supersomes containing cDNA-expressed human UGT isozymes (UGT1A1, UGT1A3, UGT1A4, UGT1A6, UGT1A7, UGT1A8, UGT1A9, UGT1A10, UGT2B4, UGT2B7, UGT2B15, and UGT2B17) were purchased from BD Gentest (Woburn, MA).
2.3. Identification of 1,25(OH)2D3 monoglucuronide metabolites formed by HLM
Initial characterization of the 1,25(OH)2D3 glucuronidation reaction was performed with 50 mM Tris-HCl (pH 7.4), 1 mg/mL pooled HLM, 50 μg/mL alamethicin, 10 mM MgCl2, 5 mM saccharic acid 1,4-lactone, 40 μM 1,25(OH)2D3, and 5 mM UDPGA. Briefly, 0.2 mL of 250 mM Tris-HCl (pH 7.4), 1 mg of pooled HLM and 50 μg alamethicin were mixed in a total volume of 0.75 mL, and placed on ice for 15 min [22]. MgCl2, (10 mM in incubation), saccharic acid 1,4-lactone (5 mM in incubation), and 1,25(OH)2D3 (40 μM in incubation) were added. To initiate the reaction, UDPGA (5 mM in incubation) was added to give a 1-mL final volume. The reaction was maintained for 180 min at 37°C, and terminated by the addition of chloroform/methanol (3:1, 4 mL). Incubations conducted without UDPGA served as a negative control. The resulting reaction mixtures were vortexed and centrifuged at 800g for 15 min. The aqueous phase from ten replicate incubation mixtures was pooled and concentrated under a N2 gas stream. Reaction products were fractionated by HPLC using a model 1100 series system (Agilent Technologies, Palo Alto, CA). Chromatographic separations were accomplished using a Symmetry C18 (4.6 × 250 mm, 5 μm) column (Waters, Milford, MA) and a mobile phase consisting of 5 mM ammonium acetate (pH 4.5) and acetonitrile maintained at a flow rate of 1.0 mL/min and 45°C. The proportion of acetonitrile was set at 10% for the first two minutes and then increased linearly to 90% at 15 min post-injection. UV detection of the analytes was performed at 265 nm. Two peaks, designated as metabolites M1 and M2, were detected with an approximate peak area ratio of 9:1. Column eluent fractions containing the major metabolite, M1, were pooled and concentrated under N2 gas stream for mass spectral analysis.
Detection of M1 and M2 was performed using an Agilent 1100 series liquid chromatography system with a UV diode array detector and MSD mass spectrometer (Palo Alto, CA). Chromatography was performed on a C18 column (Symmetry C18, 2.1 × 50 mm, 3.5 μm, Waters, Milford, MA) at a flow rate of 0.25 mL/min at 40°C. The mobile phase consisted of 5 mM ammonium acetate (pH 4.5) and acetonitrile. The proportion of acetonitrile was maintained at 10% from 0 to 2 min and then increased linearly to reach 90% at 20 min post-injection. UV detection was performed at 265 nm. The mass spectrometer was operated in the negative ionization mode. The interface was maintained at 350°C with a nitrogen nebulization pressure of 25 psi, resulting in a flow of 10.0 L/min. 1,25(OH)2D3 glucuronides and β-estradiol-17-glucuronide were detected by selective ion monitoring at m/z 591 and 447, respectively, following 70-V ion fragmentation.
To characterize the structure of a conjugated 1,25(OH)2D3 metabolite (M1), derivatization with PTAD prior to mass spectral analysis was carried out. Ethyl acetate (300 μL) containing 70 μg PTAD was added to the dried M1 product (~ 2 μg), and kept at room temperature for 1.5 hr, as described previously [23]. After the addition of 450 μL methanol to decompose excess reagent, the solvent was evaporated and the residue was dissolved in the mobile phase (80 μL), 20 μL of which was subjected to LC/MS analysis using a Micromass Quattro II (Manchester, UK) mass spectrometer coupled to a Shimadzu LC 10 chromatography system with a C18 column (2.1 × 150 mm, 3.5 μm, Waters, Milford, MA) operated at a solvent flow rate of 0.25 mL/min. The mobile phase consisted of 10 mM formic acid and methanol (7:3, v/v). To obtain the characteristic ions that can differentiate the presence of the glucuronic acid moiety on either the A ring or side chain of 1,25(OH)2D3 [23], the PTAD-derivatized 1,25(OH)2D3 metabolite was ionized by atmospheric pressure electrospray ionization (API-ES) in the positive ion mode.
Mass spectral analysis of the HLM generated reaction products revealed that M1 was a monoglucuronide and most likely the 25-O-glucuronide regioisomer. HLM incubation conditions were modified in order to increase the amount of M1 available for NMR analysis. Alamethicin-treated pooled HLM (1 mg/mL × 45, 1mL aliquots) were incubated for 8 hr with 100 μM 1,25(OH)2D3 in 100 mM potassium phosphate buffer, pH 7.4, containing 1 mM MgCl2 and 5 mM UDPGA. A pilot experiment confirmed that formation of M1 was linear with respect to time (up to 24 hr) for that length of time. The reaction was quenched with the addition of 2 volumes of ethanol and protein was removed by centrifugation at 3000g for 20 min. The volume of supernatant was reduced under a stream of nitrogen gas and subjected to semi-preparative high-pressure liquid chromatography. Chromatographic separation of the reaction products was performed with a Waters FractionLynx system consisting of a Waters ZMD 4000 operating in ESI positive, a model 600 solvent delivery system, a model 2700 sample manager, model 2487 dual wavelength UV detector, and a Fraction II Collector, using a Waters Xterra MS C18 column (10 × 300 mm, 10 μm) and a mobile phase consisting of 10 mM ammonium acetate (pH 6.8) and 20% acetonitrile at a flow rate of 4 mL/min. A linear gradient of the acetonitrile concentration was employed: 20% at t = 0 min and 80% at t = 20 min; M1 eluted at 13.5 min under these conditions. The mass peak corresponding to M1 was isolated and the organic solvent content was reduced under nitrogen. Concentrated M1 fractions from replicate injections were pooled and the remaining liquid was removed by lyophilization. The solid residue was used for NMR analysis.
An NMR sample of ~1 mg of 1,25(OH)2D3, and a prepared sample of ~100 μg M1 were separately dissolved in ~150 μL of deuteromethanol and transferred to Wilmad 3mm NMR tubes. Data were acquired on a Varian INOVA 500 NMR spectrometer employed with a Varian gradient, triple-resonance Cold Probe. The suite of experiments included a standard proton, a 2D homonuclear gDQF-COSY, heteronuclear direct-correlation multiplicity-edited HSQCAD and long-range gHMBCAD. The gDQF-COSY data were acquired as 4096 × 128 complex points, accumulating 128 transients per increment and with spectral widths of 5,498 Hz for both frequency domains. The experiment had an interpulse delay of 1.127 sec and a total acquisition time of 14 hr. The HSQCAD data were acquired as 4096 × 128 complex points, accumulating 256 transients per increment and with spectral widths in F2 and F1 of 5,498 and 18,850 Hz, respectively. This experiment had an interpulse delay of 1.127 sec, was optimized for an assumed direct coupling of 135 Hz and had a total acquisition time of 14.5 hr. The gHMBCAD data were acquired as 4096 × 128 complex points, accumulating 256 transients per increment and with spectral widths in F2 and F1 of 5,498 and 22,624 Hz, respectively. This experiment had an interpulse delay of 1.127 sec, was optimized for an assumed long-range coupling of 8 Hz and had a total acquisition time of 30 hr. All data were acquired at 25°C and referenced to the solvent at 3.31 ppm for 1H and 49.15 ppm for 13C.
2.4. Characterization of 1,25(OH)2D3 glucuronidation activity of human UGT isozymes
Supersomes (0.04 mg of microsomal protein) containing different cDNA-expressed human UGT isozymes (UGT1A1, UGT1A3, UGT1A4, UGT1A6, UGT1A7, UGT1A8, UGT1A9, UGT1A10, UGT2B4, UGT2B7, UGT2B15, or UGT2B17) were treated with alamethicin at 50 μg of alamethicin/mg of microsomal protein on ice for 15 min. Each incubation contained Supersomes (0.04 mg of microsomal protein), 2 μg of alamethicin, 50 mM Tris-HCl (pH 7.4), 10 mM MgCl2, 5 mM saccharic acid 1,4-lactone, 5 mM UDPGA, and 1 or 20 μM 1,25(OH)2D3 in a 200-μL final volume. The 1,25(OH)2D3 was dissolved in methanol and the final concentration of the organic solvent in the incubation mixture was <1%. After preincubation for 5 min at 37°C, the reaction was initiated by the addition of UDPGA (5 mM in incubation). The mixture was incubated at 37°C for 30 min, and the reaction was terminated by the addition of 125 μL of ice-cold acetonitrile containing 6% (v/v) acetic acid and 12.5 nmol β-estradiol-17-glucuronide (as an internal standard, IS). Parallel incubations conducted without UDPGA served as a negative control.
Measurement of 25-O-glucuronide M1 and M2 was performed by LC-MS analysis as described above. Quantification of 1,25(OH)2D3 glucuronides in the incubation mixtures was accomplished using a standard solution containing a known amount of 25-O-glucuronide as follows. Purified 25-O-glucuronide was dissolved in 50 mM acetate buffer (pH 4.5), and completely converted to the aglycone, 1,25(OH)2D3, using β-glucuronidase (500 Fishman units). The resulting amount of 1,25(OH)2D3 formed was quantified by LC/UV analysis using a standard curve of 1,25(OH)2D3, and defined an equal amount of 25-O-glucuronide in the acetate solution. Formation of 1,25(OH)2D3 glucuronide (25-O-glucuronide and M2) was quantified by comparing peak area ratios (metabolites/internal standard) from incubations to ratios in a standard solution of 25-O-glucuronide. Analysis of M2 was considered to be semi-quantitative, due to the lack of a standard of known concentration.
2.5. Determination of kinetic parameters for 1,25(OH)2D3 monoglucuronide formation
Kinetic parameters (Km and Vmax) for 1,25(OH)2D3 monoglucuronide formation were determined using pooled HLM (final concentration, 0.5 mg/mL), and UGT1A4, UGT2B4 and UGT2B7 Supersomes (0.2 mg microsomal protein/mL) under conditions that were linear with respect to protein concentration (for HLM up to 1.5 mg/mL, for UGT up to 1 mg/mL) and time (up to 60 min). The range of substrate concentrations were as follows: 0.005–40 μM for pooled HLM and UGT1A4, 2–40 μM for UGT2B4, and 1–40 μM for UGT2B7. Each set of data was fit to a simple hyperbolic (eq. 1) or substrate inhibition (eq. 2) model using nonlinear regression data analysis (GraFit 3.09; Erithacus Software Ltd., Horley, Surrey, UK):
| (1) |
| (2) |
where V is the velocity of reaction, Vmax is the maximum velocity, Km is Michaelis-Menten constant, [S] is the substrate concentration, and Ksi is inhibition constant.
2.6. Inter-liver differences in 1,25(OH)2D3 monoglucuronide formation
To evaluate inter-liver differences in 1,25(OH)2D3 monoglucuronide formation, 19 individual HLM (0.5 mg/mL) were incubated with 1,25(OH)2D3. The assay was carried out as described above, except at a substrate concentration of 10 μM. N-glucuronidation rates for trifluoperazine, a known UGT1A4 specific substrate [24, 25, 26, 27] were determined to compare 1,25(OH)2D3 monoglucuronide formation rates with UGT1A4 activity using the same HLM (0.5 mg/mL). The trifluoperazine assay was carried out as described previously [26, 28]. Correlation coefficients (r) of glucuronide formation were calculated using SAS system for windows version 6.12 (SAS Institute Inc., Cary, NC). A p value of less than 0.05 was regarded as statistically significant.
2.7. Inhibition of 1,25(OH)2D3 monoglucuronide formation
Inhibition of 1,25(OH)2D3 monoglucuronide formation was evaluated using hecogenin, a known inhibitor of UGT1A4 [27, 28]. Pooled HLM (0.5 mg/mL) or UGT1A4 Supersomes (1 mg/mL) were preincubated with alamethicin at 50 μg of alamethicin/mg of microsomal protein, and different concentrations (0, 5, 20, 50, 100, and 200 μM) of hecogenin for 10 min at room temperature, followed by the addition of 50 mM Tris-HCl (pH 7.4), 10 mM MgCl2, 5 mM saccharic acid 1,4-lactone, and 1 μM 1,25(OH)2D3. The reaction was initiated by the addition of 5 mM UDPGA (a final volume of incubation, 200 μL). After incubation at 37°C for 30 min, the reaction was terminated by the addition of 125 μL of ice-cold acetonitrile containing 6% (v/v) acetic acid and 12.5 nmol β-estradiol-17-glucuronide. The final concentration of organic solvent in the incubation mixture was < 2%, and all control incubations contained the same volume of the inhibitor vehicle. Other procedures for quantitating 25-O-glucuronide and M2 formation were carried out as described above.
2.8. Comparison of intestinal and hepatic UGT1A4 gene expression
Paired (same donor) human liver and intestinal (jejunal) samples from nine Caucasian donors were obtained from the University of Washington School of Pharmacy Human Tissue Bank (Seattle, WA). Total RNA was isolated from the tissue samples using TRIzol reagent (Invitrogen, Carlsbad, CA). Analysis of each product revealed no evidence of significant mRNA degradation. Reverse transcription was performed using random hexamers, according to the manufacturer’s instructions for the SuperScript First-Strand Synthesis System for RT-PCR (Invitrogen) and Lin et al [20].
Real-time quantitative PCR was performed with the ABI 7900 system (Applied Biosystems, Foster City, CA). The primers and probe sequences for GAPDH were: GAGGGGCCATCCACAGTCTT (reverse), GATCATCAGCAATGCCTCCT (forward), 6FAM-ACTCATGACAGTCCATGCCATCAC-TAMRA (probe). For all other gene targets (UGT1A1, UGT1A4, UGT1A8, UGT2B4, UGT2B7, and ubiquitin C), Assays-on-Demand™ products from Applied Biosystems (containing appropriate gene-specific primers and probe) were used. GAPDH, shown to be one of the most stably expressed control genes among different tissues [29], was chosen as the internal control gene to compare the gene expression levels between different organs (i.e., liver and intestine for this study). Another internal control gene, UBC (ubiquitin C) was used for validation of results. One intestine and one liver sample with relatively high expression of the target genes were selected to create standard curves after serial dilutions. Therefore, all gene expression levels are expressed in arbitrary units. The real-time quantitative PCR mixture (25 μL final volume) consisted of 50 ng of cDNA (5 μL), the appropriate forward and reverse primers (400 nM each), 100 nM TaqMan probe (or appropriate Assays-on-Demand™ gene expression products, Applied Biosystems, Foster City, CA), and 1x TaqMan Universal PCR Master Mix (Applied Biosystems). Amplification and detection were performed with the ABI 7900 system with the following PCR reaction profile: 50 °C for 2 min, 95°C for 10 min, and 45 cycles of 95°C for 15 sec and 60°C for 1 min.
3. Results
3.1. Identification of 1,25(OH)2D3 monoglucuronide metabolites formed by HLM
After incubation of 1,25(OH)2D3 (Chemical structure shown in Fig. 1) with pooled HLM and UDPGA, two metabolites (M1 and M2) were identified by UV absorbance (not shown) and selective mass detection at m/z 591, which corresponds to [M-H]− under the API–negative ion mode (Fig. 2). Both metabolites were generated in a UDPGA-, microsomal protein- and time-dependent manner at substrate concentrations between 0.005 and 40 μM (not shown). After treatment with β-glucuronidase, LC-UV analysis (265 nm) revealed that M1 and M2 were converted to the aglycone, 1,25(OH)2D3, suggesting that both metabolites are glucuronide conjugates of 1,25(OH)2D3 (data not shown). In addition, when microsomes from several species were screened for 1,25(OH)2D3 glucuronidation activity, the rank order for formation of M1 was human > Beagle dog > Sprague Dawley rat ≫ Cynomologous monkey.
Fig. 1.

Chemical structures of (A) 1,25(OH)2D3 and (B) 1α-hydroxy,25-glucuronide-D3.
Fig. 2.
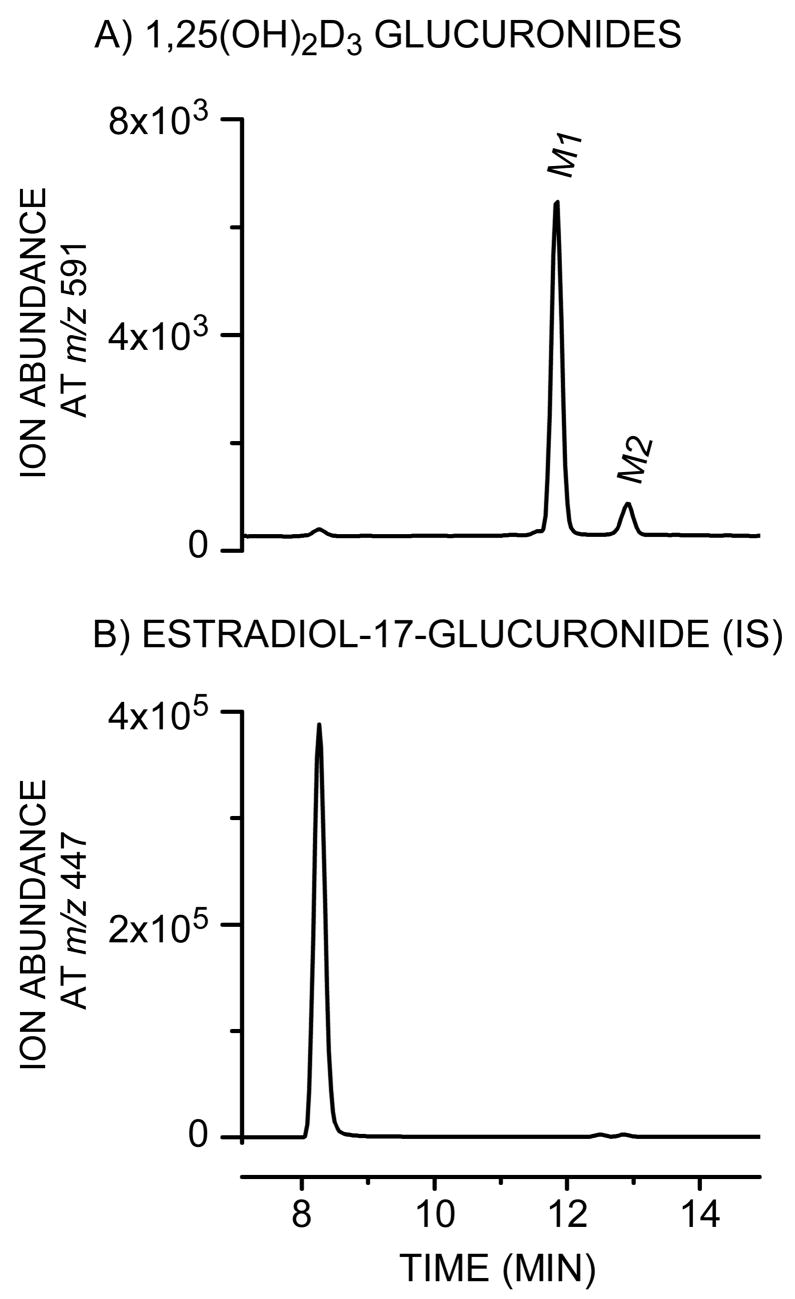
Detection of monoglucuronides generated following incubation of 1,25(OH)2D3 with HLM. The reaction was performed for 30 min at 37°C in a 200-μL mixture containing 40 μM 1,25(OH)2D3, 1 mg/mL HLM, 50 μg/mL alamethicin, 50 mM Tris-HCl (pH 7.4), 10 mM MgCl2, 5 mM saccharic acid 1,4-lactone, and 5 mM UDPGA. 1,25(OH)2D3 glucuronides (M1 and M2, panel A) and estradiol-17-glucuronide (internal standard (IS), panel B) were detected by selective ion monitoring at m/z 591 and m/z 447, respectively, as described under Materials and Methods.
To further identify the most abundant metabolite (M1), LC/MS and NMR analyses were performed. The PTAD adduct of M1 under the API–positive ion mode (full scan) showed the presence of ions at m/z 790 and 768, corresponding to the sodium adduct and the protonated form of the derivative, respectively, and its characteristic fragment ion at m/z 314 (Fig. 3). This fragment originates from cleavage of the C6-7 bond of the A ring skeleton that contains intact (unconjugated) hydroxyl groups at 1α and 3 positions. This result suggests conjugation of the intact molecule at the 25-O position of the side chain (shown in Fig. 1), as described by Higashi et. al [23]. These conclusions were confirmed by daughter ion analysis (MRM) of the m/z 750 precursor ion (MH+-H2O) under the API-positive ion mode (i.e. 750 → 314; data not shown). Formation of M2 was insufficient to permit similar structural identification, but it presumably corresponded to the 1-O or 3-O-glucuronide isomer.
Fig. 3.

Mass spectrum of PTAD adduct of purified M1. Characterization of the chemical structure of M1 was performed using derivatization with 4-phenyl-1,2,4-triazoline-3,5-dione (PTAD) as described previously [23]. The PTAD adduct of M1 gave a characteristic fragment ion of at m/z 314 in the API–positive ion mode.
3.2 Structural identification of M1 by NMR
To confirm the identity of M1 by NMR analysis, semi-preparative purification of M1 from incubation mixtures was carried out. NMR data for 1,25(OH)2D3 was acquired for comparison to M1. The proton and carbon assignments for both 1,25(OH)2D3 and M1 are listed in Table 1. Most of the data for M1 equated well to that of the parent molecule, with the exception of resonances at the side chain terminus. The proton and carbon resonances at positions 24–27 exhibited slight changes to their chemical shifts. The most pronounced was the downfield shift of 7.5 ppm from 71.5 to 79.0 ppm for C25, consistent with the attachment of the glucuronide. The key information to locate the glucuronide at the 25-position was the long-range gHMBCAD data that exhibited a correlation from the anomeric H1′ resonance at 4.45 ppm to the C25 resonance at 79.0 ppm, affording an unequivocal connectivity from the glucuronide ring to the side chain (indicated by an arrow in Fig. 4). The 26/27 methyl protons also exhibited the long-range gHMBCAD correlations to the quaternary C25. All of the gHMBCAD correlations for M1 are listed in Table 1.
Table 1.
Proton and carbon NMR chemical shift assignments for 1,25(OH)2D3 and 1α-hydroxy,25-glucuronide-D3
| 1,25(OH)2D3 | 1α-hydroxy, 25-glucuronide-D3 | ||||
|---|---|---|---|---|---|
| Position | δ1H Mult (J in Hz) | δ13C | δ1H Mult (J in Hz) | δ13C | gHMBCAD 1 |
| 1 | 4.35 t (6.0) | 71.3 | 4.35 t (5.8) | 71.4 | 2, 3, 5, 10, 19 |
| 2 | 1.89 m | 43.5 | 1.89 obsc | 43.6 | 1, 3, 4, 10 |
| 3 | 4.13 m | 67.2 | 4.13 p (5.3) | 67.3 | 1, 5 |
| 4 | 2.27 dd (6.8, 13.6) | 46.0 | 2.26 dd (6.6, 13.5) | 46.1 | 2, 3, 5, 6, 10 |
| 2.52 dd (3.8, 13.6) | 2.52 dd (3.8, 13.5) | 2, 3, 5, 6, 10 | |||
| 5 | -- | 134.2 | -- | 135.7 | -- |
| 6 | 6.33 d (11.1) | 124.8 | 6.33 d (11.2) | 124.8 | 4, 7, 8, 10 |
| 7 | 6.09 d (11.1) | 118.9 | 6.09 d (11.2) | 118.8 | 5, 9, 14 |
| 8 | -- | 142.2 | -- | 142.6 | -- |
| 9 | 1.69 obsc | 29.8 | 1.69 obsc | 30.0 | 8 |
| 2.87 dd (4.2, 12.4) | 2.86 dd (3.6, 12.5) | 7, 12, 14 | |||
| 10 | -- | 148.4 | -- | 149.7 | -- |
| 11 | 1.56, 1.68 obsc | 24.5 | 1.55, 1.68 obsc | 24.6 | 8, 9 |
| 12 | 1.34, 2.05 obsc | 41.7 | 1.32, 2.03 obsc | 41.8 | 9, 13, 14 |
| 13 | -- | 46.7 | -- | 46.9 | -- |
| 14 | 2.02 obsc | 57.4 | 2.02 obsc | 57.5 | 8, 13 |
| 15 | 1.46, 1.55 obsc | 23.1 | 1.44, 1.54 obsc | 23.6 | 16 |
| 16 | 1.29, 1.91 obsc | 28.5 | 1.30, 1.90 obsc | 28.6 | 13, 20 |
| 17 | 1.33 obsc | 57.8 | 1.31 obsc | 57.9 | 13, 16, 20, 22 |
| 18 | 0.58 s | 12.1 | 0.57 s | 12.3 | 12, 13, 14, 17 |
| 19 | 4.90 dd (1.0, 2.5) | 111.9 | 4.86 obsc | 111.9 | na |
| 5.29 dd (1.3, 2.5) | 5.29 s | 1, 5, 10 | |||
| 20 | 1.42 obsc | 37.2 | 1.42 obsc | 37.1 | na |
| 21 | 0.97 d (6.4) | 19.1 | 0.96 d (6.5) | 19.3 | 17, 20, 22 |
| 22 | 1.06, 1.42 obsc | 37.6 | 1.05, 1.40 obsc | 37.7 | na |
| 23 | 1.25, 1.46 obsc | 21.7 | 1.33, 1.45 obsc | 23.4 | 25, 26/27 |
| 24 | 1.37, 1.45 obsc | 45.1 | 1.48, 1.52 obsc | 43.7 | 25, 26/27 |
| 25 | -- | 71.5 | -- | 79.0 | -- |
| 26/27 | 1.18 s | 29.0 | 1.25 s | 26.6 | 24, 25, 26/27 |
| 1′ | -- | -- | 4.45 d (7.6) | 98.5 | 3′, 25 |
| 2′ | -- | -- | 3.17 dd (7.8, 8.7) | 75.0 | 1′, 3′ |
| 3′ | -- | -- | 3.39 t (8.8) | 78.0 | 2′, 4′ |
| 4′ | -- | -- | 3.43 t (8.8) | 73.8 | 3′, 5′, 6′ |
| 5′ | -- | -- | 3.54 d (9.5) | 76.5 | 1′, 3′, 4′, 6′ |
| 6′ | -- | -- | -- | 176.7 | -- |
Correlations observed from the proton to the listed carbon.
s = singlet, d = doublet, t = triplet, dd = doublet of doublets, p = pentet, m = multiplet, obsc = obscured, na = not available
Fig. 4.

Identification of M1 by NMR as the 25-glucuronide metabolite of 1,25(OH)2D3. GHMBCAD spectrum with the proton spectrum shown as the trace across the top of the spectrum. The peak indicated by an arrow affords the major evidence of M1 being a 25-glucuronide (see results).
3.3 Characterization of 1,25(OH)2D3 glucuronidation activity of human UGT isozymes
Screening of 1,25(OH)2D3 glucuronosyltransferase activity was performed using twelve human UGT isozymes (UGT1A1, UGT1A3, UGT1A4, UGT1A6, UGT1A7, UGT1A8, UGT1A9, UGT1A10, UGT2B4, UGT2B7, UGT2B15, and UGT2B17) incubated with 1 or 20 μM of 1,25(OH)2D3. UGT1A4 and UGT2B7 catalyzed 25-O-glucuronide and M2 formation, while UGT2B4 catalyzed 25-O-glucuronide formation only. Other UGT isozymes exhibited no detectable catalytic activity under the incubation conditions that were employed (data not shown).
3.4. Determination of kinetic parameters for 1,25(OH)2D3 monoglucuronide formation
Kinetic analyses of 1,25(OH)2D3 monoglucuronide formation were performed using pooled HLM, and UGT1A4 (UGT1A4*1), UGT2B4 and UGT2B7 Supersomes (Table 2, OFig. 5). The rates of 25--glucuronide and M2 formation by HLM followed simple hyperbolic kinetics yielding respective Km and Vmax values of 11.2 μM and 10.4 μM, and 32.9 ± 1.9 pmol/min/mg protein and 3.3 ± 0.2 pmol/min/mg protein, respectively. The kinetic profile of 25-O-glucuronide and M2 formation by UGT1A4 was similar to that of HLM; the Km and Vmax values were 7.3 μM and 4.1 μM, and 33.7 ± 1.4 and 5.6 ± 0.3 pmol/min/mg protein, respectively. Formation of 25-O-glucuronide by UGT2B4 also followed simple hyperbolic kinetics, yielding a Km value (57.8 μM) that was 5-fold higher than that of HLM. In contrast, UGT2B7 catalyzed 25-O-glucuronidation followed substrate inhibition kinetics, differing from that of HLM, UGT1A4 and UGT2B4. Although both UGT2B isozymes supported the reaction, the calculated maximum intrinsic 25-O-glucuronide formation clearance for UGT1A4 (4.62 μL/min/mg protein) was 14-fold and 62-fold higher than that of UGT2B7 (0.33 μL/min/mg protein) and UGT2B4 (0.07 μL/min/mg protein), respectively.
Table 2.
Kinetic parameters associated with 25-O-glucuronide (M1) and M2 formation in HLM, UGT1A4, UGT2B4 and UGT2B7
| Km (μM) | Vmax (pmol/min/mg protein) | Vmax/Km (μl/min/mg protein) | Ksi (μM) | |
|---|---|---|---|---|
| 25-O-glucuronide (M1) | ||||
| HLM | 11.2±1.8 | 32.9±1.9 | 2.94 | – |
| UGT1A4 | 7.3±1.0 | 33.7±1.4 | 4.62 | – |
| UGT2B4 | 57.8±13.1 | 4.3±0.6 | 0.07 | – |
| UGT2B7 | 4.2±1.3 | 1.4±0.2 | 0.33 | 81.0 ± 42.1 |
|
| ||||
| M2 | ||||
| HLM | 10.4±1.9 | 3.3±0.2 | 0.32 | – |
| UGT1A4 | 4.1±0.8 | 5.6±0.3 | 1.37 | – |
| UGT2B4 | N.D. | N.D. | N.D. | N.D. |
| UGT2B7 | 1.4±0.5 | 0.2±0.02 | 0.14 | – |
Kinetic parameters were derived by fitting data to a simple hyperbolic model (eq. 1) except kinetic parameters for 25-O-glucuronide formation by UGT2B7 (substrate inhibition model, eq. 2). A dash (–) indicates parameter not present in a kinetic model used to fit data.
N.D., not determined due to no activity.
Fig. 5.

Substrate concentration-rate profiles of 25-O-glucuronide (M1) and M2 formation by UGT1A4, UGT2B4 and UGT2B7. Each incubation contained 0.04 mg microsomal protein of Supersomes (UGT1A4, UGT2B4 or UGT2B7), 2 μg of alamethicin, 50 mM Tris-HCl (pH 7.4), 10 mM MgCl2, 5 mM saccharic acid 1,4-lactone, 5 mM UDPGA, and 0.05, 1, 2, 5,10, 20, 30, or 40 μM 1,25(OH)2D3 in a total volume of 200 μL. After preincubation for 5 min at 37°C, the reaction was initiated by the addition of UDPGA. After 30-min incubation, the reaction was terminated by the addition of 125 μL of ice-cold acetonitrile containing 6% (v/v) acetic acid and 12.5 nmol β-estradiol-17-glucuronide (IS). Closed and open circles indicate the catalytic activities of 25-O-glucuronide (M1) formation and M2 formation, respectively.
3.5. Inter-liver differences in 1,25(OH)2D3 monoglucuronide formation
To evaluate inter-liver variability in 1,25(OH)2D3 monoglucuronide formation, a panel of 19 HLM was screened for 25-O-glucuronide and M2 formation rates. The variability in 25-O-glucuronide and M2 formation was only 4-fold (7.7–29.3 pmol/min/mg protein; mean = 16.2 ± 5.7 pmol/min/mg protein) and 6-fold (0.6–3.8 pmol/min/mg protein, mean = 1.7 ± 0.8 pmol/min/mg protein), respectively. There was a strong correlation between 25-O-glucuronide and M2 formation rates catalyzed by the panel of 19 HLM (r = 0.92, p<0.0001). In addition, formation of each 1,25(OH)2D3 monoglucuronide by HLM correlated well with N-glucuronide formation from trifluoperazine, a UGT1A4 probe substrate (25-O-glucuronide formation, r = 0.86, p<0.0001; M2 formation, r = 0.81, p<0.0001).
3.6. Inhibition of 1,25(OH)2D3 monoglucuronide formation
The effects of hecogenin (a UGT1A4 inhibitor) on 25-O-glucuronide and M2 formation by pooled HLM were determined (Fig. 6). A hecogenin concentration above 20 μM strongly inhibited 25-O-glucuronide formation and M2 formation catalyzed by pooled HLM. 25-O-glucuronide and M2 formation by UGT1A4 were completely inhibited by 50 μM hecogenin. In the presence of 200 μM of trifluoperazine, a UGT1A4 probe substrate, 25-O-glucuronide formation by HLM was also decreased to 75% of control (data not shown).
Fig. 6.

Inhibition of 25-O-glucuronide (M1) and M2 formation in human liver microsomes by hecogenin. Pooled HLM (0.5 mg/mL) were preincubated with alamethicin at 50 μg of alamethicin/mg of microsomal protein, and different concentrations (0, 5, 20, 50, 100, and 200 μM) of hecogenin for 10 min at room temperature, followed by the addition of 50 mM Tris-HCl (pH 7.4), 10 mM MgCl2, 5 mM saccharic acid 1,4-lactone, and 1 μM 1,25(OH)2D3. The reaction was initiated by the addition of 5 mM UDPGA (a final volume of a mixture, 200 μL). After incubation at 37°C for 30 min, the reaction was terminated by the addition of 125 μL of ice-cold acetonitrile containing 6% (v/v) acetic acid and 12.5 nmol β-estradiol-17-glucuronide (IS). Closed and open circles indicate the catalytic activities of 25-O-glucuronide (M1) formation and M2 formation, respectively.
3.7. Comparison of hepatic and intestinal mRNA expression of UGT isozymes
To compare the 1,25(OH)2D3 mono-glucuronidation potential of liver and intestine, we measured the gene expression level of several UGT isozymes using nine paired human liver and intestinal tissues. We found that, relative to the intestine, there was a higher UGT1A4 and UGT2B7 mRNA content in the liver (~6-fold and 7-fold, respectively) (Fig. 7) using glyceraldehyde-3-phosphate dehydrogenase (GAPDH) as the internal control gene. For comparison, the median value for the ratio of UGT1A1 mRNA in liver versus intestine was ~1. In addition, consistent with the reported preferential expression of UGT1A8 and UGT1A10 in human intestine [30], we found that the median value for the liver to intestine mRNA ratio for these two isozymes were both about 0.3. For data validation, we found a roughly equivalent level of hepatic and intestinal expression of another internal control housekeeping gene, ubiquitin C (not shown).
Fig. 7.

Comparison of mRNA expression levels of UGT isozymes in paired (same donor) human liver and intestine. Paired (same donor) human liver and intestinal (jejunal) samples from nine Caucasian donors were used. Real-time quantitative PCR was performed as described in text. GAPDH was chosen as the internal control gene.
4. Discussion
Previous investigators have shown that, in humans, the most active form of vitamin D3, 1,25(OH)2D3, can be exported into bile as a polar conjugate, including glucuronide(s), and reabsorbed in the proximal small intestine [12, 13]. Based on the extensive enterohepatic recycling of glucuronides of bile acids and related steroids, it is likely that 1,25(OH)2D3 undergoes similar metabolism, biliary transport and intestinal reabsorption processes. In this study, we demonstrated that two different monoglucuronide isomers of 1,25(OH)2D3 were produced by the human liver, with preferential conjugation at the 25-hydroxy position. It is interesting that glucuronidation occurred at the hindered 25-position of 1,25(OH)2D3, that is part of the tert.-hydroxy group. We also observed a third minor monoglucuronide peak after the 8 hr-incubation used to purify M1 for NMR analysis (not shown). Presumably, these minor metabolites correspond to the other potential regioisomers, 1α-O- and/or 3-O-monoglucuronide [7, Litwiller]. However, their low rate of formation precluded definitive identification.
Although 1,25(OH)2D3 was shown previously to be directly glucuronidated in humans (using β-glucuronidase treatment) [12,13], the exact structure of the metabolite has been unclear until the present work. A monoglucuronide metabolite of 1,25(OH)2D3 was isolated from rat bile and was assumed to be conjugated at the 1- or 3-hydroxy group, but its structure was not fully determined [Litwiller et al.]. In addition, it was reported that the 24- and 3-hydroxy groups of 24,25-dihydroxyvitamin D3 were directly conjugated and that the 25-glucuronide was not detected in bile after administration of 24,25-dihydroxyvitamin D3 to rats [16, 17]. In dog bile, the 23-β-glucuronide of 23,25-dihydroxy-24-oxovitamin D3 was identified as the major metabolite, but 24,25-dihydroxyvitamin D3 glucuronides, which would be direct conjugates, were not found after administration of 24,25-dihydroxyvitamin D3 [15]. In contrast to this information from animal studies, our data indicates preferential glucuronidation of the 25-position of 1,25(OH)2D3 in humans. Admittedly though, this apparent species difference could simply reflect the regioselectivity of the UGT1A4 enzyme for what are structurally different vitamin D chemical species.
Glucuronide conjugation is often catalyzed by multiple UGT isozymes due to their broad substrate specificities. These are characteristically high Km (micromolar) reactions for both endogenous and exogenous substrates [31]. For example, the conjugations of bilirubin and estradiol by UGT1A1 exhibit a Km of 24 and 28 μM, respectively [22, 32]. Similarly, several hydroxysteroids are glucuronidated by UGT1A4 [24], with Km values (7–18 μM) similar to that observed for 1,25(OH)2D3 (7–11 μM, Table 2). The apparent intrinsic clearance (Vmax/Km) for the reaction is presumably sufficient to support enterohepatic cycling of 1,25(OH)2D3-glucuronide, as has been observed previously [12, 13]. Indeed, the calculated intrinsic clearance of 1,25(OH)2D3 by UGT1A4, compares reasonably well (21–51%) with that of the sapogenins, androstanediol and pregnanediol, compounds that are considered excellent UGT1A4 substrates [24].
Under normal physiological conditions, the concentration of 1,25(OH)2D3 circulating in human plasma is relatively invariant and closely regulated (about 0.15 nM, Brumbaugh, Science 1997). For example, van Hoof et al (Eur J Endocrinol 144:391–6, 2001) reported total concentrations that varied between only 0.1 and 0.2 nM in 12 healthy women. Similarly, Ebling et al. (J Clin Endocrinol 75:176–82, 1992) observed a 3-fold range of total serum 1,25(OH)2D3 concentrations in 44 healthy women between the ages of 20 and 87 yrs. The liver distribution of 1,25(OH)2D3 has been investigated in rats using quantitative whole-body autoradiography [Kissmeyer]. After dosing (ca; 12 μg), total radioactivity in liver at 8 hr was 1.5-fold higher than that in blood (121 vs 79 ng/g tissue) although the composition of 1,25(OH)2D3 in each tissue was unknown. Assuming that the liver/blood concentration ratio is the same in rats and humans under normal physiological conditions, the 1,25(OH)2D3 concentration in liver may be similar to that in blood(serum). Because the apparent Km for 1,25(OH)2D3 glucuronidation by UGT1A4 is much higher than circulating blood (and hepatic) concentrations of 1,25(OH)2D3, the extent of hepatic 1,25(OH)2D3 glucurnonidation (and biliary excretion) would be expected to vary in proportion to circulating levels of hormone. Inter-individual differences in the intake of vitamin D from the diet or its synthesis in the skin can affect the pool of circulating 25(OH)2D3 from which 1,25(OH)2D3 is derived and, thus, may also have some effect on the extent of hepatic glucuronidation, particularly when altered physiological conditions are encountered.
The formation of quaternary N-glucuronides can exhibit pronounced inter-species differences, with limited activity in some animals used for toxicity testing [34]. In humans, UGT1A4, as well as UGT1A3, appears responsible for the formation of these products (ref 24; Miners, 2004). Glucuronide metabolites of 1,25(OH)2D3 produced by human liver microsomes were detected in dog, rat and monkey liver microsomal incubations, but there was also evidence for an inter-species difference, with these animal species exhibiting lower 1,25(OH)2D3 glucuronidation activity than humans. Although the identity of the UGT enzyme(s) catalyzing 1,25(OH)2D3 conjugation in animals is unknown, the available data are consistent with a reduced level of UGT1A4-related activity in some animals compared to humans.
An inter-species difference in 1,25(OH)2D3 O-monoglucuronide formation has interesting biological implications if the process represents the first step in the preferential delivery of a potent VDR ligand to proximal intestinal enterocytes. One might anticipate far less pronounced differences in proximal vs. distal CYP3A expression in species that do not efficiently glucuronidate 1,25(OH)2D3. It might also predict differences in the regulation of other VDR gene targets such as the intestinal calcium binding protein, calbindin D9K.
The possible involvement of human UGT1A4 in the delivery of 1,25(OH)2D3 to the proximal intestine has interesting implications with respect to calcium homeostasis during pregnancy. The oral clearance of the selective UGT1A4 substrate lamotrigine is enhanced significantly during pregnancy [35]. Moreover, induction of human hepatic UGT1A4 during pregnancy has been recapitulated in a transgenic mouse model [36], wherein the investigators suggest that this occurs as a ‘natural defense mechanism to facilitate the detoxification or elimination of blood products resulting from catabolism during early embryogenesis.’ Our results suggest an additional outcome–an increase in hepatic UGT1A4 activity during pregnancy may enhance the delivery of 1,25(OH)2D3 to the proximal small intestine and promote calcium absorption in response to increased demands during fetal development.
The glucuronidation of 1,25(OH)2D3 could also represent an inactivation/systemic clearance process. However, the terminal urinary (and fecal) excretion products of vitamin D3 observed in humans (including glucuronides) are derived primarily from initial hydroxylation at the C-24, C-23 and C-26 positions [18, 37]. This suggests that direct glucuronidation of 1,25(OH)2D3 is not a significant terminal elimination pathway. Some UGT isoforms, such as UGT1A4, are also expressed in the intestine as well as liver, and the impact of intestinal UGTs on the first-pass effect and enterohepatic circulation of drugs is well recognized. After secretion into the bile as glucuronides, the conjugates can be subsequently hydrolyzed by β-glucuronidases located in the lumen of the gastrointestinal tract. The interplay between the conjugating enzymes of the intestinal mucosa and the de-conjugating enzymes of bacteria is unclear but, presumably, both processes are essential for transcellular delivery of the glucuronide metabolite into blood (i.e., uptake across the apical membrane and re-conjugation of the UGT substrate, followed by active export across the basolateral membrane into blood). The presence of UGT1A4 in the small intestine would serve this role with regard to 1,25(OH)2D3 recycling. However, the higher expression of UGT1A4 in the liver, compared to small intestine, suggests that active hormone would accumulate and exert its genomic effects in the enterocytes and also undergo CYP-catalyzed oxidations (ref 10). Indeed, formation of 1,25(OH)2D3-glucuronide in the liver and enterohepatic recycling may simply serve as a reservoir and critical tissue-selective hormone delivery pathway. In this regard, it is interesting to note that we observed only minor inter-individual differences in the 25-O-glucuronidation activity of a panel of 19 human livers, consistent with a conserved and important metabolic function.
Acknowledgments
This work was supported in part by the National Institutes of Health (GM63666, GM32165 and ES07033), Eli Lilly & Co., and Dainippon Sumitomo Pharma Co., Ltd.
Abbreviation
- 1,25(OH)2D3
1α,25-dihydroxyvitamin D3
- UDPGA
Uridine-5′-diphosphoglucuronic acid
- PTAD
4-phenyl-1,2,4-triazoline-3,5-dione
- HLM
human liver microsomes
- HPLC
high performance liquid chromatography
- LC/MS/MS
liquid chromatography-tandem mass spectrometry
- LC/MS
liquid chromatography-mass spectrometry
References
- 1.Lown KS, Kolars JC, Thummel KE, Barnett JL, Kunze KL, Wrighton SA, et al. Interpatient heterogeneity in expression of CYP3A4 and CYP3A5 in small bowel: lack of prediction by the erythromycin breath test. Drug Metab Dispos. 1994;22:947–55. [PubMed] [Google Scholar]
- 2.von Richter O, Burk O, Fromm MF, Thon KP, Eichelbaum M, Kivisto KT. Cytochrome P450 3A4 and P-glycoprotein expression in human small intestinal enterocytes and hepatocytes: a comparative analysis in paired tissue specimens. Clin Pharmacol Ther. 2004;75:172–83. doi: 10.1016/j.clpt.2003.10.008. [DOI] [PubMed] [Google Scholar]
- 3.Schmiedlin-Ren P, Thummel KE, Fisher JM, Paine MF, Lown KS, Watkins PB. Expression of enzymatically active CYP3A4 by Caco-2 cells grown on extracellular matrix-coated permeable supports in the presence of 1α,25-dihydroxyvitamin D3. Mol Pharmacol. 1997;51:741–54. doi: 10.1124/mol.51.5.741. [DOI] [PubMed] [Google Scholar]
- 4.Thummel KE, Brimer C, Yasuda K, Thottassery J, Senn T, Lin Y, et al. Transcriptional control of intestinal cytochrome P-4503A by 1α,25-dihydroxy vitamin D3. Mol Pharmacol. 2001;60:1399–406. doi: 10.1124/mol.60.6.1399. [DOI] [PubMed] [Google Scholar]
- 5.Makishima M, Lu TT, Xie W, Whitfield GK, Domoto H, Evans RM, et al. Vitamin D receptor as an intestinal bile acid sensor. Science. 2002;296:1313–6. doi: 10.1126/science.1070477. [DOI] [PubMed] [Google Scholar]
- 6.Thompson PD, Jurutka PW, Whitfield GK, Myskowski SM, Eichhorst KR, Dominguez CE, et al. Liganded VDR induces CYP3A4 in small intestinal and colon cancer cells via DR3 and ER6 vitamin D responsive elements. Biochem Biophys Res Commun. 2002;299:730–8. doi: 10.1016/s0006-291x(02)02742-0. [DOI] [PubMed] [Google Scholar]
- 7.Kumar R. Vitamin D metabolism and mechanisms of calcium transport. J Am Soc Nephrol. 1990;1:30–42. doi: 10.1681/ASN.V1130. [DOI] [PubMed] [Google Scholar]
- 8.Walters JR, Howard A, Lowery LJ, Mawer EB, Legon S. Expression of genes involved in calcium absorption in human duodenum. Eur J Clin Invest. 1999;29:214–9. doi: 10.1046/j.1365-2362.1999.00439.x. [DOI] [PubMed] [Google Scholar]
- 9.Fleet JC, Eksir F, Hance KW, Wood RJ. Vitamin D-inducible calcium transport and gene expression in three Caco-2 cell lines. Am J Physiol Gastrointest Liver Physiol. 2002;283:G618–25. doi: 10.1152/ajpgi.00269.2001. [DOI] [PubMed] [Google Scholar]
- 10.Xu Y, Hashizume T, Shuhart MC, Davis CL, Nelson WL, Sakaki T, et al. Intestinal and hepatic CYP3A4 catalyze hydroxylation of 1α,25-dihydroxyvitamin D3: implications for drug-induced osteomalacia. Mol Pharmacol. 2006;69:56–65. doi: 10.1124/mol.105.017392. [DOI] [PubMed] [Google Scholar]
- 11.Gascon-Barre M, Gamache M. Contribution of the biliary pathway to the homeostasis of vitamin D3 and of 1,25-dihydroxyvitamin D3. Endocrinology. 1991;129:2335–44. doi: 10.1210/endo-129-5-2335. [DOI] [PubMed] [Google Scholar]
- 12.Wiesner RH, Kumar R, Seeman E, Go VL. Enterohepatic physiology of 1,25-dihydroxyvitamin D3 metabolites in normal man. J Lab Clin Med. 1980;96:1094–100. [PubMed] [Google Scholar]
- 13.Ledger JE, Watson GJ, Ainley CC, Compston JE. Biliary excretion of radioactivity afterintravenous administration of 3H-1,25-dihydroxyvitamin D3 in man. Gut. 1985;26:1240–5. doi: 10.1136/gut.26.11.1240. [DOI] [PMC free article] [PubMed] [Google Scholar]
- 14.Shimada K, Mitamura K, Nakatani I. Characterization of monoglucuronides of vitamin D2 and 25-hydroxyvitamin D2 in rat bile using high-performance liquid chromatography-atmospheric pressure chemical ionization mass spectrometry. J Chromatogr B Biomed Sci Appl. 1997;690:348–54. doi: 10.1016/s0378-4347(96)00377-5. [DOI] [PubMed] [Google Scholar]
- 15.Shimoyamada A, Tomiyama S, Shimizu M, Yamamoto K, Kunii S, Yamada S. In vivo metabolism of 24R, 25-dihydroxyvitamin D3: structure of its major bile metabolite. Biochim Biophys Acta. 1997;1346:147–57. doi: 10.1016/s0005-2760(97)00026-x. [DOI] [PubMed] [Google Scholar]
- 16.Higashi T, Horike M, Kikuchi R, Shimada K. In vitro and in vivo glucuronidation of 24, 25-dihydroxyvitamin D3. Steroids. 1999;64:715–25. doi: 10.1016/s0039-128x(99)00057-4. [DOI] [PubMed] [Google Scholar]
- 17.Higashi T, Miura K, Kikuchi R, Shimada K, Hiyamizu H, Ooi H, et al. Characterization of new conjugated metabolites in bile of rats administered 24,25-dihydroxyvitamin D3 and 25-hydroxyvitamin D3. Steroids. 2000;65:281–94. doi: 10.1016/s0039-128x(00)00087-8. [DOI] [PubMed] [Google Scholar]
- 18.Higashi T, Homma S, Iwata H, Shimada K. Characterization of urinary metabolites of vitamin D3 in man under physiological conditions using liquid chromatography-tandem mass spectrometry. J Pharm Biomed Anal. 2002;29:947–55. doi: 10.1016/s0731-7085(02)00135-8. [DOI] [PubMed] [Google Scholar]
- 19.Paine MF, Khalighi M, Fisher JM, Shen DD, Kunze KL, Marsh CL, et al. Characterization of interintestinal and intraintestinal variations in human CYP3A-dependent metabolism. J Pharmacol Exp Ther. 1997;283:1552–62. [PubMed] [Google Scholar]
- 20.Lin YS, Dowling AL, Quigley SD, Farin FM, Zhang J, Lamba J, et al. Co-regulation of CYP3A4 and CYP3A5 and contribution to hepatic and intestinal midazolam metabolism. Mol Pharmacol. 2002;62:162–72. doi: 10.1124/mol.62.1.162. [DOI] [PubMed] [Google Scholar]
- 21.Lowry OH, Rosebrough NJ, Farr AL, Randall RJ. Protein measurement with the Folin phenol reagent. J Biol Chem. 1951;193:265–75. [PubMed] [Google Scholar]
- 22.Fisher MB, Campanale K, Ackermann BL, VandenBranden M, Wrighton SA. In vitro glucuronidation using human liver microsomes and the pore-forming peptide alamethicin. Drug Metab Dispos. 2000;28:560–6. [PubMed] [Google Scholar]
- 23.Higashi T, Miura K, Kitahori J, Shimada K. Usefulness of derivatization in high-performance liquid chromatography/tandem mass spectrometry of conjugated vitamin D metabolites. Anal Sci. 1999;15:619–23. [Google Scholar]
- 24.Green MD, Tephly TR. Glucuronidation of amines and hydroxylated xenobiotics and endobiotics catalyzed by expressed human UGT1.4 protein. Drug Metab Dispos. 1996;24:356–63. [PubMed] [Google Scholar]
- 25.Nakajima M, Tanaka E, Kobayashi T, Ohashi N, Kume T, Yokoi T. Imipramine N-glucuronidation in human liver microsomes: biphasic kinetics and characterization of UDP-glucuronosyltransferase isoforms. Drug Metab Dispos. 2002;30:636–42. doi: 10.1124/dmd.30.6.636. [DOI] [PubMed] [Google Scholar]
- 26.Ghosal A, Hapangama N, Yuan Y, Achanfuo-Yeboah J, Iannucci R, Chowdhury S, et al. Identification of human UDP-glucuronosyltransferase enzyme(s) responsible for the glucuronidation of posaconazole (Noxafil) Drug Metab Dispos. 2004;32:267–71. doi: 10.1124/dmd.32.2.267. [DOI] [PubMed] [Google Scholar]
- 27.Uchaipichat V, Mackenzie PI, Elliot DJ, Miners JO. Selectivity of substrate (trifluoperazine) and inhibitor (amitriptyline, androsterone, canrenoic acid, hecogenin, phenylbutazone, quinidine, quinine, and sulfinpyrazone) “probes” for human UDP-glucuronosyltransferases. Drug Metab Dispos. 2006;34:449–56. doi: 10.1124/dmd.105.007369. [DOI] [PubMed] [Google Scholar]
- 28.Dehal SS, Gagne PV, Crespi CL, Patten CJ. Characterization of a probe substrate and an inhibitor of UDP glucuronosyltransferase (UGT) 1A4 activity in human liver microsomes (HLM) and cDNA-expressed UGT-enzymes. Drug Metab Rev. 2001;33(Suppl 1):162. [Google Scholar]
- 29.Vandesompele J, De Preter K, Pattyn F, Poppe B, Van Roy N, De Paepe A, et al. Accurate normalization of real-time quantitative RT-PCR data by geometric averaging of multiple internal control genes. Genome Biol. 2002;3:RESEARCH0034. doi: 10.1186/gb-2002-3-7-research0034. [DOI] [PMC free article] [PubMed] [Google Scholar]
- 30.Mojarrabi B, Mackenzie PI. Characterization of two UDP glucuronosyltransferases that are predominantly expressed in human colon. Biochem Biophys Res Commun. 1998;247:704–9. doi: 10.1006/bbrc.1998.8843. [DOI] [PubMed] [Google Scholar]
- 31.Kiang TK, Ensom MH, Chang TK. UDP-glucuronosyltransferases and clinical drug-drug interactions. Pharmacol Ther. 2005;106:97–132. doi: 10.1016/j.pharmthera.2004.10.013. [DOI] [PubMed] [Google Scholar]
- 32.Miners JO, Smith PA, Sorich MJ, McKinnon RA, Mackenzie PI. Predicting human drug glucuronidation parameters: application of in vitro and in silico modeling approaches. Annu Rev Pharmacol Toxicol. 2004;44:1–25. doi: 10.1146/annurev.pharmtox.44.101802.121546. [DOI] [PubMed] [Google Scholar]
- 33.Green MD, Tephly TR. Glucuronidation of amine substrates by purified and expressed UDP-glucuronosyltransferase proteins. Drug Metab Dispos. 1998;26:860–7. [PubMed] [Google Scholar]
- 34.Chiu SH, Huskey SW. Species differences in N-glucuronidation. Drug Metab Dispos. 1998;26:838–47. [PubMed] [Google Scholar]
- 35.Tran TA, Leppik IE, Blesi K, Sathanandan ST, Remmel R. Lamotrigine clearance during pregnancy. Neurology. 2002;59:251–5. doi: 10.1212/wnl.59.2.251. [DOI] [PubMed] [Google Scholar]
- 36.Chen S, Beaton D, Nguyen N, Senekeo-Effenberger K, Brace-Sinnokrak E, Argikar U, et al. Tissue-specific, inducible, and hormonal control of the human UDP-glucuronosyltransferase-1 (UGT1) locus. J Biol Chem. 2005;280:37547–57. doi: 10.1074/jbc.M506683200. [DOI] [PubMed] [Google Scholar]
- 37.Gray RW, Caldas AE, Wilz DR, Lemann J, Jr, Smith GA, DeLuca HF. Metabolism and excretion of 3H-1,25-(OH)2-vitamin D3 in healthy adults. J Clin Endocrinol Metab. 1978;46:756–65. doi: 10.1210/jcem-46-5-756. [DOI] [PubMed] [Google Scholar]
- 38.Litwiller RD, Mattox VR, Jardine I, Kumar R. Evidence for a monoglucuronide of 1,25-dihydroxyvitamin D3 in rat bile. J Biol Chem. 1982;257:7491–7494. [PubMed] [Google Scholar]
- 39.Brumbaugh PF, Haussler DH, Bressler R, Haussler MR. Radioreceptor assay for 1 α,25-dihydroxyvitamin D3. Science. 1974;183:1089–1091. doi: 10.1126/science.183.4129.1089. [DOI] [PubMed] [Google Scholar]
- 40.Kissmeyer AM, Nielsen JL, Binderup LR. The tissue-specific distribution of 3H-seocalcitol (EB 1089) and 3H-calcitriol in rats. J Steroid Biochem Mol Biol. 2004;89–90:43–47. doi: 10.1016/j.jsbmb.2004.03.049. [DOI] [PubMed] [Google Scholar]