

Abstract
A fundamental question in olfaction is which odorant receptors (ORs) are activated by a given odorant. A major roadblock to investigate odorant-OR relationship in mammals has been an inability to express ORs in heterologous cells suitable for screening active ligands for ORs. The discovery of the receptor-transporting protein (RTP) family has facilitated the effective cell-surface expression of ORs in heterologous cells. The establishment of a robust heterologous expression system for mammalian ORs facilitates the high-throughput “deorphanization” of these receptors by matching them to their cognate ligands. This protocol details the method used for evaluating the cell-surface expression and measuring the functional activation of ORs of transiently-expressed mammalian odorant receptors in HEK293T cells. The stages of odorant receptor cell-surface expression include cell culture preparation, transfer of cells, transfection, and immunocytochemistry/flow cytometry, odorant stimulation, and luciferase assay. This protocol can be completed in a period of 3 days from transfer of cells to cell-surface expression detection and/or measurement of functional activation.
INTRODUCTION
Odorants are detected by olfactory sensory neurons in the olfactory epithelium. In olfactory sensory neurons, OR proteins are synthesized, transported to the cell-surface membrane of the dendrites as well as axons, and concentrated at the cilia at the tip of the dendrite 1,2. ORs are members of the seven-transmembrane G-protein coupled receptor (GPCRs) superfamily. The mammalian OR gene family encodes approximately 400 and 1200 diverse OR proteins in human and mouse, respectively, comprising the largest family of genes 3-9.
The basis of odorant recognition by their cognate receptors has been one of the central problems in the study of odor coding 10. After the initial identification of the OR genes in 1991 11, one focus of the field of olfaction has been the identification of the cognate ligands of ORs. In non-olfactory GPCRs, heterologous expression systems have been used to great effect 12; however, such heterologous systems have not been viable for ORs due to a critical problem: Transfected ORs are rarely functionally expressed on the plasma membrane, possibly due to endoplasmic reticulum retention, which in turn leads to OR degradation in the proteosome 13-15.
Achieving functional cell-surface expression of ORs
It has been hypothesized that OR proteins may require accessory proteins that promote proper targeting of OR proteins to the cell surface 15. A single transmembrane protein, ODR-4, is required for cilia localization of the OR proteins in C. elegans 16. To identify such proteins for mammalian ORs, we screened for genes inducing cell-surface expression of ORs in HEK293T cells. We identified receptor-transporting protein 1 (RTP1) and RTP2 that promote cell-surface expression of ORs 17. They are expressed specifically by olfactory sensory neurons, interact with OR proteins, and enhance responses to odorants when co-expressed with ORs in HEK293T cells. Similar, though much weaker, effects were seen with a third protein, receptor expression-enhancing protein 1 (REEP1).
After our initial identification of RTP1, we found that a shorter form of RTP1, which we named RTP1S, supports an enhanced level of functional expression of representative ORs compared with the originally described RTP1, renamed as RTP1L 18. When RTP1S is coexpressed with other accessory proteins, including Ric8b, a putative olfactory guanine nucleotide exchange factor, and the Golf α subunit (Gαolf) 19,20, we successfully expressed a diverse set of N-terminal tagged and untagged ORs heterologously 18. The presence or absence of different N-terminal epitope tags (Rho, FLAG or HA) seems to have little effect on the ligand specificity of ORs, though the use of a Rho tag further enhances the cell-surface expression of the ORs 18. The accuracy of this OR heterologous expression system involving tagged ORs and accessory proteins established a platform for high-throughput “deorphanization”, or finding the cognate ligands, of mammalian ORs.
Evaluating OR cell-surface expression
Successful trafficking of membrane receptors to the plasma membrane is necessary for the receptor proteins to bind extracellular ligands. Since OR proteins are not easily expressed on the plasma membrane, it is particularly important to evaluate the amount of cell-surface expression. Conventional immunostaining protocols containing permeabilization steps is not appropriate for measuring cell-surface proteins as antibodies can label proteins located at plasma membrane as well as intracellular membrane structures, such as endoplasmic reticulum. Live-cell staining is used to selectively visualize the cell-surface molecules as the antibody molecules cannot penetrate the plasma membrane in this case. Flow cytometry will be used to quantify the amount of labeled antibodies.
Here we provide protocols for measuring cell-surface expression of ORs expressed in heterologous cells using live-cell staining and flow cytometry analysis; we have used these methods to quantify the cell-surface expression of a human OR, OR7D4, which affects our perception of two steroidal odorants, androstenone and androstadienone 21. Although only ORs are tested extensively in our lab, the method is also applicable for the evaluation of cell-surface expression of other membrane proteins.
Measuring activation of ORs
Measuring the activation of ORs upon odorant stimulation is critical to study the odor-coding by the ORs. OR proteins on the plasma membrane are activated when they bind to their cognate odor ligands. Binding will change the conformation of the ORs and activate the G-proteins to initiate a cascade of signal transduction. ORs are typically functionally coupled with the stimulatory G proteins. In olfactory sensory neurons, activated Gαolf stimulate adenylyl cyclase type III (ACIII), which results in the production of cAMP, which opens cAMP-gated nucleotide channels (CNG). Here we describe a protocol for measuring OR activation using a cyclic AMP-response element (CRE) that drives a firefly luciferase reporter gene 17,18,21,22. A presumptive route from the activation of ORs to the induction of luciferase in heterologous cells is as follows: Activation of ORs results in the production of cAMP, which causes activation of protein kinase A, which in turn phosphorylates and activates the transcription factor, cAMP response element binding protein (CREB) 23. Finally, activated CREB induces luciferase gene expression that is readily quantifiable by luminometrical methods (Figures 1 and 2). Renilla luciferase driven by a constitutively active SV40 promoter is used to control the variation of cell number and transfection efficiency in each well. Essentially, the ratio of firefly luciferase and Renilla luciferase will be calculated to evaluate the receptor activation. As this method relies on a reporter gene expression, it takes several hours to see the response of ORs after stimulation. This method was used to screen for human ORs that are activated by a steroidal chemical, androstenone, and led to the identification of a human androstenone receptor. It was also used to evaluate the ligand specificities of different variants of this receptor 21.
Figure 1. Overview of the functional activation of odorant receptors in a heterologous expression system.

A mammalian odorant receptor, RTP1S, and Ric8b, each contained in a mammalian expression vector such as pCI, are transfected into HEK293T or the HEK293T-derived Hana3A cells along with a luciferase reporter gene construct driven by a cyclic AMP responsive element (CRE) promoter and Renilla luciferase construct drive by an SV40 promoter. Typically one day after transfection, cells are stimulated with potential odorants. Activation of the odorant receptor leads to accumulation of cyclic AMP (cAMP) which turns on the expression of the luciferase reporter gene.
Figure 2. The endogenous and heterologous odorant receptor signal transduction pathways.

A) The endogenous odorant receptor signal transduction pathway in an olfactory sensory neuron. B) The heterologous odorant receptor signal transduction pathway in Hana3A cells. OR, odorant receptor. RTP, receptor-transporting protein. PKA, protein kinase A. CREB, cAMP response element binding protein. CRE, cAMP response element.
Several alternative methods to measure OR activation have also been reported. One method is to use adenovirus as a vector to infect olfactory neurons. Activation of foreign ORs was measured either by electroolfactogram or calcium imaging of single cells 24,25. Only few ORs have been expressed and analyzed using this method to date, due to low throughput. Another method is to use calcium imaging to measure activation of ORs by coexpressing with Gα15 and/or Gα16 in heterologous cells 26,27. Though Gα15/16, which belong to the Gαq subfamily of Gα subunits, are expressed in hematopoietic cell lineage, they were shown to couple with many, but not all GPCRs that would not normally couple with Gαq 28. Activation of Gα15/16 would cause inositol phosphate production followed by increase in calcium concentration inside the cell. This method has an advantage that one can observe OR activation close to real-time. However, not all ORs seem to couple with Gα15/16. Our group has used Gα15-olf chimera in which the C-terminal end of Gα15 was replaced with that of Gαolf for calcium imaging 18. In addition, the Krautwurst group has developed a cell line in which olfactory cAMP-gated channels are expressed for the measurement of OR activation through calcium influx 29.
Experimental design
Selection of cell line
HEK293T cells were adopted for OR heterologous expression because they represent a mammalian cell line that is relatively easy to culture and supports functional expression of various GPCRs. We have established a HEK293T-derived cell line, named Hana3A, for OR heterologous expression 17. Hana3A cells stably express RTP1L, RTP2, REEP1, and Gαolf and support the robust expression of various transiently expressed ORs. The addition of the accessory proteins RTP1S further enhances the expression of most ORs tested in both HEK293T and Hana3A cells 18. In fact, transient coexpression of RTP1S is sufficient for the functional expression of various ORs in HEK293T cells 17,18. Our data show that the use of Hana3A cells and/or transient coexpression of the RTP proteins generally induces more receptor molecules on the cell surface than HEK293T cells that do not express the RTP proteins; however, the efficiency differs with different ORs 17,18.
Selection of epitope tags
The inclusion of the first 20 amino acids or the first 39 amino acids of rhodopsin (Rho-tag) at the N-terminal end has been shown to promote the cell-surface expression of some ORs 18,26,29,30. Although we routinely use the first 20 amino acid of human rhodopsin for enhanced cell-surface expression and function, we have shown that untagged ORs can also be functionally expressed at lower efficiencies 18. Various other modifications, including N-terminal HA and FLAG tags, were also used as a means of promoting OR expression and/or as an epitope for detection. For mammalian OR expression, none of these N-terminal tags seem to affect OR ligand specificity 18. The protocol described here should be appropriate for membrane proteins with any of these epitope tags in the extracellular regions, with the Rho-tag being the most recommended for robust OR cell-surface expression.
Plasmid DNA quality
Plasmid DNA of ORs and OR accessory factors used for transient expression is prepared using a conventional silica membrane column-based miniprep method such as Qiagen Miniprep kit from cultured bacterial cells 31. In addition to the standard procedures, we include a phenol-chloroform extraction step after neutralization before transferring to the column. After miniprep, OD260 is measured and different plasmid DNA preparations are generally diluted to the same concentration, for example, 100 ng/μl, for transfection to simplify the calculation in the transfection. 1μl of DNA is customarily run on a gel to check the integrity of the DNA.
Immunocytochemistry versus flow cytometry approach to probing cell-surface protein expression
Both immunocytochemistry and flow cytometry can be used to evaluate OR cell-surface expression. In the protocol described below, the time required for each procedure is similar (See Timing). The choice of which method to use depends on the purpose of the experiment and sometimes the availability of equipment, i.e. fluorescent microscope or cell sorter. Flow cytometry is more quantitative in the assessment of cell-surface expression and is therefore ideal for detecting differences among samples. Live-cell immunocytochemistry allows the visualization of OR on the cell-surface, as antibody molecules cannot penetrate to antigen molecules that are not presented on the cell surface. Permeablized immunocytochemistry (not described), on the other hand, will detect molecules both on the cell-surface and inside the cells 32. It can provide clues on the subcellular localization of OR proteins when used with markers for organelles such as endoplasmic reticulum or Golgi apparatus.
Use of luciferase assay for OR ligand screening
The heterologous functional activation of ORs can be used for screening a given OR against a library of odorants as well as a given odorant against a library of ORs. It is also applicable for generating dose response curves for known OR-ligand pairs. Given the 96-well format of this high-throughput system, a typical experiment can accommodate tens of conditions in one experiment with several plates. For example, one can express a single type of ORs against hundreds of different odorants or multiple odorants at different concentrations. Alternatively, one can express a large panel of ORs against a single type of odorant.
MATERIALS
REAGENTS
HEK293T cells (e.g., ATCC CRL-11268 ) or Hana3A cells (available from authors upon request). Obtain cells as 1 ml frozen stocks. Store at -80 °C or in liquid nitrogen until use.
Minimal essential medium (MEM), with Earle's salts and L-glutamine (e.g., Cellgro 10-010-CV) (see REAGENT SETUP)
Fetal bovine serum (FBS) (e.g., Cellgro 35-010-CV)
Phosphate buffered saline (PBS), without calcium or magnesium (e.g., Cellgro 21-040-CV)
0.05% (wt/vol) Trypsin-EDTA (Gibco 25300-054)
Penicillin-streptomycin, 10 mg/ml (Sigma P4333)
Amphotericin B, 250 μg/ml (Sigma A2942)
Puromycin (Sigma P8833) (OPTIONAL, see REAGENT SETUP)
Lipofectamine2000 (Invitrogen 11668-027)
Miniprep kit (e.g., Qiagen Miniprep Kit)
70% (vol/vol) Ethanol
Distilled water (e.g., Gibco 15230)
Mammalian odorant receptors (ORs) expression construct with an epitope tag (e.g. Rho-tag, HA-tag, FLAG-tag, etc., see Experimental design) cloned into a mammalian expression vector such as pCI
Mammalian RTP1S expression construct cloned into a mammalian expression vector such as pCI (GENBANK accession number of RTP1S: human AY562235, mouse EU070411)
Hank's Buffered Salt Solution (HBSS), with calcium chloride and magnesium chloride (Gibco 14025-092)
HEPES, 1M (Gibco 15630-080)
NaN3 (EM Science SX0299-1) (see REAGENT SETUP)
paraformaldehyde (PFA) (J.T. Baker S898-07) (see REAGENT SETUP)
Poly-D-Lysine (Sigma P7280) (OPTIONAL, see EQUIPMENT SETUP)
Cellstripper (Cellgro 25-056-CI) (OPTIONAL, see step 10B (iv) of the Procedure)
Blue fluorescent protein (BFP) expression construct (OPTIONAL, see step 9A (iii) of the Procedure and Table 1)
Green fluorescent protein (GFP) expression construct 33 (OPTIONAL, see step 9A (iii) of the Procedure and Table 1)
Mouse monoclonal anti-Rhodopsin antibody, 4D2 34
Anti-FLAG antibody, M2 (Sigma F1804) (OPTIONAL, see Experimental design)
Anti-HA antibody, 12CA5 (Roche 11 583 816 001) (OPTIONAL, see Experimental design)
Cy3-conjugated anti-mouse IgG antibody (Jackson Immunologicals) (OPTIONAL, see step 9A (ix) of the Procedure)
Phycoerythrin (PE)-conjugated anti-mouse IgG antibody (Jackson Immunologicals) (OPTIONAL, see step 9B (xi) of the Procedure)
Mowiol 4-88 (Calbiochem 475904) (OPTIONAL, see REAGENT SETUP)
1,4-diazobicyclo-2,2,2-octane (DABCO, Sigma D2522) (OPTIONAL, see REAGENT SETUP)
0.2 M Tris-HCl, pH 8.5 (OPTIONAL, see REAGENT SETUP)
Glycerol (e.g. EMD GX0185-6) (OPTIONAL, see REAGENT SETUP)
7-Amino-actinomycin D (7-AAD, Calbiochem 129935) (OPTIONAL, see step 9A (iii) of the Procedure and Table 2)
CD293™ suspension culture medium (Gibco 11913-019) (see REAGENT SETUP)
L-Glutamine, 200 mM (Gibco 25030-081)
pCRE-Luc expression construct (Stratagene 219076)
pSV40-Renilla expression construct (Promega E2231)
Mammalian Ric8b construct cloned into a mammalian expression vector such as pCI (GENBANK accession number: mouse AY940666)
Mammalian Gαolf construct cloned into a mammalian expression vector such as pCI (GENBANK accession number: human AF493893, mouse AY179169)
Dual-Glo™ Luciferase Assay System (Promega E2940)
Various odorants prediluted in appropriate solvents to 1 M or lower concentrations. Store at -20 °C until use.
Dimethyl sulfoxide (DMSO) (e.g., Mallinckrodt 4948) (OPTIONAL, see step 10C (iv) of the Procedure)
95% Ethanol, molecular biology grade (e.g., IBI IB15720) (OPTIONAL, see step 10C (iv) of the Procedure)
Table 1.
DNA transfection mixture for immunocytochemistry or flow cytometry.
| plasmid DNA | amount for immunocytochemistry (μg) | amount for flow cytometry (μg) |
|---|---|---|
| OR | 0.8 | 0.8 |
| RTP1S | 0.3 | 0.3 |
| BFP | 0.3 | omit |
| GFP | omit | 0.01 |
Table 2.
Control samples for flow cytometry.
| control #1 none | control #2 no antiboy | control #3 PE only | control #4 no OR | ||
|---|---|---|---|---|---|
| transfection | OR | yes | yes | yes | no |
| RTP1S | yes | yes | yes | yes | |
| GFP | no | yes | no | yes | |
| staining | antibodies | no | no | yes | yes |
| 7-AAD | no | yes | no | yes | |
EQUIPMENT
37 °C cell culture incubator with 5% carbon dioxide
Certified class II biological safety cabinet with laminar flow
Centrifuge machine with swinging bucket rotor for 15 ml conical tubes
Centrifuge machine with rotor for 5 ml round-bottom tubes
Phase contrast microscope with 4x, 10x, 20x objectives
1.5 ml Eppendorf tubes
100×20 mm cell culture dishes (e.g., BD Falcon 353003)
5 ml 12×75 mm round-bottom tubes (e.g., BD Falcon 352052)
15 ml 17×120 mm conical tubes (e.g., BD Falcon 352099)
Sterile serological pipette, assorted (e.g., BD Falcon)
Fluorescent microscope with 40x objective
Fluorescence-activated cell sorter (FACS)
Microscope slides
22×22 mm microscope cover slips, No.1 thickness (e.g., Esco 72200-11)
35×10 mm cell culture dishes (e.g., BD Falcon 353801)
Multiwell 6-well cell culture dishes (e.g., BD Falcon 353046)
Parafilm
Tweezers
Bench-top orbital rotator
Plate reader (We use Wallac Victor 2 multilabel counter Model 1420, PerkinElmer) (see EQUIPMENT SETUP)
8-well and 12-well multichannel pipetmans
96-well poly-D-lysine coated flat bottom cell culture plates (e.g., BD 356651)
Sterile reagent reservoirs for multichannel distribution (e.g., VWR 82026-350)
Sterile paper towels
REAGENT SETUP
Puromycin solution
Prepare 1 mg/ml solution in distilled water. Puromycin is added to the final concentration of 1 μg/ml in M10 with penicillin-streptomycin and amphotericin medium when culturing Hana3A cells.
Culturing medium
Both HEK293T and Hana3A cells are grown in MEM supplemented with 10% (vol/vol) FBS (M10) before and during transfection. Stock cells are maintained in M10 added with 100 μg/ml penicillin-streptomycin and 1.25 μg/ml amphotericin. For example, add 500 μl 10 mg/ml penicillin-streptomycin and 250 μl 250 μg/ml amphotericin to 50 ml M10.
NaN3 solution
Prepare 1.5 M solution in distilled water.
Staining solution for immunocytochemistry
In live-cell immunocytochemistry, cells are stained with primary and secondary antibodies diluted in a staining solution that is M10 with 10 mM HEPES and 15 mM NaN3. For example, add 500 μl 1M HEPES and 500 μl 1.5M NaN3 to 50 ml M10. Store at 4 °C.
Washing solution for immunocytochemistry
In live-cell immunocytochemistry, cells are washed after each staining with a washing solution that is HBSS with 10 mM HEPES and 15 mM NaN3. For example, take a bottle of 500 ml HBSS and add 5 ml 1M HEPES and 5 ml 1.5 M NaN3. Store at 4 °C.
Staining and washing solution for flow cytometry
Cells are stained and washed with PBS containing 2% FBS and 15 mM NaN3. For example, take a bottle of 500 ml PBS and add 10 ml FBS and 5 ml 1.5 M NaN3. Store at 4 °C.
PFA solution
Prepare a 1% (wt/vol) solution in PBS. When making PFA solution, add NaOH to dissolve PFA and adjust pH to 7.4 with HCl.
Poly-D-Lysine solution
Prepare 1 mg/ml solution in distilled water.
Mowiol mounting solution
Prepare according to standard procedure 35. To make mowiol, add 24 g of Mowiol 4-88 to 60 g of glycerol and stir to mix. Add 60 ml of distilled water and leave for several hours at room temperature (22-24 °C). Add 120 ml of 0.2 M Tris-HCl (pH 8.5) with mixing and heat to 50 °C until the materials are dissolved. Add 6 g of 1,4-diazobicyclo-2,2,2-octane and centrifuge for 15 min at 5000g at room temperature. Finally, aliquot to air-tight containers and store at -20 °C.
Stimulation medium for luciferase assay
Cells are first transfected with OR and accessory factor constructs and then stimulated with odorants dissolved in a stimulation medium that is a CD293-based medium supplemented with L-glutamine. For example, add 500 μl of 2 mM L-glutamine to 50 ml of CD293. Though other serum-free medium such as MEM can be used for stimulation, we found CD293 supported more robust response in our assay system.
Dual-Glo Luciferase Assay Kit
Prepare Dual-Glo™ Luciferase solution (firefly luciferase) by transferring the contents of one bottle of Dual-Glo™ Luciferase Buffer to one bottle of Dual-Glo™ Luciferase Substrate to create the Dual-Glo™ Luciferase Reagent. Mix by trituration until the substrate is thoroughly dissolved. Aliquot into working volume and store at -80°C until use. Store Dual-Glo™ Stop-n-Glo® solution (Renilla luciferase) at room temperature. Prepare Dual-Glo™ Stop-n-Glo® Reagent on the day it is to be used by diluting the Dual-Glo™ Stop-n-Glo® Substrate 1:100 into an appropriate volume of Dual-Glo™ Stop-n-Glo® Buffer in a new container.
EQUIPMENT SETUP
Preparation of poly-D-lysine-coated microscope cover glass in 35 mm cell culture dish (For cell-surface immunocytochemistry approach only)
On the day of transferring cells for transfection (See step 4), prepare one cover glass for each 35 mm cell culture dish (consider using a multiwell cell culture plate if doing many samples at a time). Pipette 15 μl 1 mg/ml poly-D-lysine onto a piece of 22x22 mm cover glass. Sandwich the poly-D-lysine droplet with another piece of cover glass so that the liquid is spread across the surface of both pieces of cover glasses. Separate the two pieces of cover glasses and place one piece, coated side up, into a 35 mm cell culture dish. Airdry for 20 min or until poly-D-lysine droplets disappear. Please note that if you are implementing the flow cytometry approach the procedure in the present step should not be carried out. !CRITICAL: Use sterile techniques when handling the cover glasses and work under the cell culture safety cabinet.
Multilabel counter (For luciferase assay)
Any multilabel plate reader with luminescence technology can be used for this purpose. Measure count per second (CPS) in each well once.
PROCEDURE
Preparation of a stock of HEK293T (or Hana3A) cell line (Time: ~3 d)
1| Thaw one 1 ml tube of frozen cells in a waterbath kept at 37 °C. Immediately after thawing, transfer the entire stock to 5 ml of M10 in a 15 ml conical tube. Centrifuge for 5 min at 200g at room temperature (~25 °C).
2| Aspirate all the M10, retaining the cell pellet at the bottom of the conical tube. Resuspend the cells with 10 ml of M10 with penicillin-streptomycin and amphotericin and transfer the suspension to a 100 mm cell culture dish. Culture the cells in a 37 °C incubator with 5% CO2 overnight.
3| Next day, check cells under a phase contrast microscope to make sure cells are healthy. Healthy cells are spread over the surface of the culture dish without any sign of contamination. Replace the medium with fresh M10 with penicillin-streptomycin and amphotericin medium. When using Hana3A cells, add 1 μg /ml puromycin.
Transfer cells for transfection (Time: 1 d)
4| Culture the cells until confluent, or to the desired confluence. Check cell density periodically. Meanwhile, if intending to carry out immunocytochemistry, prepare poly-D-lysine-coated microscope cover glasses in 35 mm cell culture dishes as described in EQUIPMENT SETUP.
5| Observe the cells under a microscope to estimate confluence. Replacing medium with fresh M10 a few hours prior to passage may help enhance the cell viability, especially when cells are close to 100% confluent (approximately 1.1 × 10⁷ cells).
6| When ready to passage cells, aspirate all medium in the cell culture dish. Gently extrude 10 ml PBS onto the cells to wash. Dish needs to be tilted to accumulate medium at the edge before aspirating. Aspirate all PBS from the edge of the dish.
7| Transfer 3 ml 0.05% trypsin-EDTA onto the cells. Gently agitate the dish to facilitate cells rounding up and detaching from the bottom of the dish. The time it takes for 100% confluent cells to detach is around 1-2 min. Follow the progress of cell detachment under the microscope as necessary. Add 5 ml M10 to the dish immediately after all cells have detached.
8| Dissociate the cells by trituration. Further prepare cells depending on the intended application. Follow option A if intending to transfect the cells for evaluation cell-surface expression by live-cell immunocytochemistry or flow cytometry. Follow option B if intending to transfect the cells for analysis of OR activation by the luciferase assay. Follow Box 1 if intending to create a frozen stock. Follow Box 2 if intending to passage the cells.
Box 1: Preparing frozen stocks
Transfer the desired amount of medium and cells to a 15 ml conical tube for preparation and storage of a stock sample. The amount to be transferred depends on the future experimental plan. For example, for 30% confluence in 100 mm dish, transfer 3.3 × 10⁶ cells, or 30% of the cells from the original 100% confluent 100 mm cell culture dish.
Centrifuge for 5 min at 200g at room temperature. Cells generally undergo more than ten passages before another frozen aliquot of cells needs to be thawed.
END OF BOX 1
BOX 2: Passaging cells
Transfer the desired amount of medium and cells to a 15 ml conical tube and centrifuge for 5 min at 200g at room temperature. Estimate the amount of the desired amount of the cells to be plated according to your experimental plan, as cells divide roughly once a day.
Aspirate all the M10 and trypsin-EDTA while preserving the cell pellet at the bottom of the conical tube. Resuspend the cells with 10 ml M10 with penicillin-streptomycin and amphotericin and transfer to a 100 mm cell culture dish. Add 10 μl 1 mg/ml puromycin for every other passage when using Hana3A cells.
Culture in a 37 °C incubator with 5% CO2 until next passage. Approximately, cells need to be passaged 2 to 3 times per week.
END OF BOX 2
OPTION A: Preparing cells for transfection in 35 mm cell culture dishes: for live-cell immunocytochemistry or flow cytometry
-
Transfer the desired amount of medium and cells to a 15 ml conical tube for transfection. For each 35 mm cell culture dish (each of which represents an independent sample) transfer 3.3 × 10⁵ cells, or 3% of the cells from a 100% confluent 100 mm cell culture dish. Centrifuge for 5 min at 200g at room temperature.
!CRITICAL STEP: It is important to aliquot the correct and equal amount of cells into each dish to avoid overgrowing or undergrowing cells. For example, ten samples will require ten 35 mm cell culture dishes and a total of 3.3 × 10⁶ cells, or 30% of a 100% confluent 100 mm cell culture dish. In this case, one would transfer 30% × (3 ml trypsin-EDTA + 5 ml M10) = 2.4 ml cells and medium to a 15 ml conical tube.
Meanwhile, prepare 35 mm dishes for transfection. Pipette 1 ml M10 onto each 35 mm dish, with (for immunocytochemistry, see Equipment setup) or without (for flow cytometry) poly-D-lysine coated cover glass.
Aspirate all the M10 and trypsin-EDTA from the samples in step 8A (i), retaining the cell pellet at the bottom of the conical tube. Resuspend the cells with 0.5 ml M10 for each 35 mm dish and transfer 0.5 ml of medium and cells to each 35 mm dish. Note that no antibiotics should be added for transfection.
Culture in a 37 °C incubator with 5% CO2 overnight before proceeding with step 9.
Option B: Preparing cells for transfection in 96-well plates: for luciferase assay
-
Transfer the desired amount of medium and cells to a 15 ml conical tube for transfection. For each 96-well plate, transfer 8.8 × 10⁵ cells, or 8% of the cells from a 100% confluent 100 mm cell culture dish. Centrifuge for 5 min at 200g at room temperature.
!CRITICAL STEP: It is important to aliquot the correct amount of cells into 96-well plates to avoid overgrowing or undergrowing cells. For example, for two 96-well plates, a total of 1.76 × 10⁶ cells, or 16% of a 100% confluent 100 mm cell culture dish are needed. For example, starting from a 100% confluent 100 mm cell culture dish, one would transfer 16% × (3 ml trypsin-EDTA + 5 ml M10) = 1.3 ml cells and medium to a 15 ml conical tube for centrifugation.
Aspirate all the M10 and trypsin-EDTA, retaining the cell pellet at the bottom of the conical tube. Resuspend the cells with 6 ml M10 for each 96-well plate and pipette the cells and medium into a reagent reservoir. Note that no antibiotics should be added for transfection.
Using a multichannel pipetman, distribute 50 μl of cells and medium from the reservoir to a 96-well plate.
-
Culture in a 37 °C incubator with 5% CO2 overnight before proceeding with step 9.
!CRITICAL STEP: Do not overpipette to avoid formation of air bubbles in the wells.
Transfection (Time: 1 d)
9| Transfect cells as described below, depending on the intended application. For measuring cell-surface expression by live-cell immunocytochemistry or flow cytometry, follow option A. Follow option B if intending to measure OR activation by the luciferase assay.
Option A: Transfection for measuring cell-surface expression by live-cell immunocytochemistry or flow cytometry
Prepare OR and accessory factor expression plasmid constructs. Adjust plasmid DNA concentration so that they are uniform (e.g., 100 ng/μl). Although this type of adjustment is not mandatory, it could simplify the transfection process.
Observe the cells for transfection under a microscope. Each 35 mm dish should be 30-50% confluent (approximately 3.3 - 5.5 × 10⁵ cells) at the time of transfection.
-
For each 35 mm cell culture dish, prepare a DNA transfection mixture in 100 μl MEM according to Table 1, depending on whether immunocytochemistry or flow cytometry analysis is to be carried out. If using flow cytometry, also prepare the 4 control samples described in Table 2. Control samples are needed for calibration in each flow cytometry run and are run at the beginning of the cell sorting to establish baseline parameters for the real samples (See step 10B (xvii)).
!CRITICAL STEP: BFP or GFP is co-transfected as a control for transfection efficiency. In addition to the controls listed above, we recommend to include in each experiment the pCI vector-only as negative control and Rho-tagged ORs with cell-surface expression(e.g., Rho-Olfr6218) as positive control. Note that 7-AAD, a fluorescent, cell-impermeant DNA-binding agent that selectively stains dead cells, is added before flow cytometry to eliminate dead cells from analysis36.
For each 35 mm dish, prepare a Lipofectamine2000 transfection mixture in an Eppendorf tube with 4 μl of Lipofectamine2000 in 100 μl MEM.
Mix the appropriate DNA mixture with Lipofectamine2000 mixture by trituration. Incubate at room temperature for 15 min.
Add 1 ml M10 to the DNA-Lipofectamine2000 mixture.
Aspirate the entire amount of medium in the 35 mm cell culture dishes (from step 9A (ii)). Gently transfer the appropriate 1200 μl transfection mixture to each dish.
Culture in a 37 °C incubator with 5% CO2 for 24 h before proceeding with either step 10A or step 10B.
Option B: Transfection for measuring OR activation by the luciferase assay
Prepare OR constructs, accessory factor constructs (RTP1S, Ric8b, and Gαolf, pCRE-Luc (encoding for the cAMP-responsive element CRE and firefly luciferase), and pSV40-RL (encoding for a SV40 promoter and Renilla luciferase) by miniprep. Adjusting plasmid DNA concentration (e.g., 100 ng/μl) would simplify the procedure.
Observe the cells to be transfected under a microscope. Observe each well if necessary. Each well should be 30-50% confluent (approximately 8.8 × 10⁴ - 1.5 × 10⁵ cells) at the time of transfection.
-
Prepare a DNA transfection mixture in 500 μl MEM for each sample in an Eppendorf tube. The components of the DNA mixture for each 96-well plate are listed in Table 3.
!CRITICAL STEP: Rho-tagged ORs co-transfected with Ric8b and Gαolf are recommended for a higher degree of OR activation. Plan the experimental setup before transfection bearing in mind that it is acceptable to transfer multiple ORs or use multiple odorants at different concentrations in the same plate.
For each 96-well plate, prepare a Lipofectamine2000 transfection mixture in an Eppendorf tube with 18 μl of Lipofectamine2000 in 500 μl MEM.
Mix the DNA mixture with Lipofectamine2000 mixture by trituration. Incubate at room temperature for 15 min.
For each 96-well plate, add 5 ml M10 to the DNA-Lipofectamine2000 mixture.
-
Spread out a thick layer of sterile paper towels in the safety cabinet. Remove the lid of a 96-well plate containing the cells prepared in step 9B (ii). Gently and repeatedly tap the plate upside-down on the paper towels so that that M10 medium is completely absorbed by the paper towels.
!CRITICAL STEP: Use gentle but forceful motions so to expel as much old medium as possible so that maximum amount of the transfection mixture can be added later. Cells should be firmly attached to the bottom of the plate and should not peel off.
Using a multichannel pipetman, transfer 50 μl of the transfection mixture to each well.
Culture in a 37 °C incubator with 5% CO2 for ~24 h before proceeding with step 10C.
Table 3.
DNA transfection mixture for luciferase assay.
| plasmid DNA | amount (μg) |
|---|---|
| OR | 5 |
| pCRE-Luc | 1 |
| pSV40-RL | 1 |
| RTP1S | 1 |
| Ric8b (optional) | 0.5 |
| Gαolf (optional) | 0.5 |
10| Assess live-cell cell-surface expression by immunocytochemistry (option A) or by flow cytometry (option B). Alternatively, assess OR activation by the luciferase assay (option C).
Option A. Live-cell cell-surface immunocytochemistry (Time: ~5 h)
Observe the transfected cells under a microscope. The cells in each 35 mm dish should be 50-80% confluent (approximately 5.5 - 8.8 × 10⁵ cells) at the time of staining.
Place cell culture dishes on ice. Place staining solution and washing solution for immunocytochemistry on ice (See REAGENT SETUP).
Fill a large insulated container with ice. Spread the ice uniformly to create an even horizontal surface. Place a plastic tray with a flat surface (e.g., the lid or bottom of a 150 mm Petri dish) on the ice. Make sure the bottom of the tray is horizontal. Use of a level may help to ensure the tray is horizontal. Cut out a piece of parafilm that is smaller than the tray surface. Spray the inside of the tray with 70% ethanol and affix the parafilm to the tray to create a smooth surface.
Prepare a 100 μl primary antibody solution (e.g. 1/100 mouse anti-Rhodopsin 4D2) for each sample. For example, dilute 1 μl mouse anti-Rho antibody 4D2 in 99 μl staining solution for immunocytochemistry. Store on ice.
-
Use a pair of tweezers and carefully transfer the cover glass from the 35 mm dish to the parafilm on the tray, cell-side up. Leave the 35 mm dish with the M10 medium on ice for later use.
!CRITICAL STEP: Handle cover glasses with care as they are easily broken.
-
Carefully extrude 100 μl primary antibody solution onto the cover glass. Repeat steps 10A (iv)-(v) for each sample (Figure 3).
!CRITICAL STEP: Make sure the cover glass is totally covered with the antibody solution. The surface tension of the solution should prevent overflow if carefully applied.
Cover the tray. Incubate on ice for 30-60 min.
At the end of the incubation, carefully transfer the cover glass back to its original 35 mm dish with M10. Aspirate the medium from the edge of the dish without touching the cover glass. Gently add 2 ml of washing solution for immunocytochemistry from the edge of the dish. Aspirate. Repeat this washing step 2 additional times. Do not aspirate after the last wash.
Prepare 100 μl of the secondary antibody solution (e.g. 1/200 Cy3-conjugated anti-mouse IgG) for each sample. Store on ice.
Use a pair of tweezers to carefully transfer the cover glass from the 35 mm dish to the parafilm, cell-side up. Leave the 35 mm dish with washing solution on ice for later use.
Carefully extrude 100 μl secondary antibody solution onto the cover glass so that it covers the glass surface entirely without overflowing. Repeat steps 10A (x)-(xi) for every sample.
Cover the tray. Incubate on ice for 30 min.
At the end of the incubation, carefully transfer the cover glass back to its original 35 mm dish with washing solution. Aspirate the solution from the edge of the dish without touching the cover glass. Gently add 2 ml of washing solution for immunocytochemistry from the edge of the dish. Aspirate. Repeat this washing step 2 additional times.
Replace the wash solution from the last wash with 1% PFA. Cover the tray and incubate for a minimum period of 15 min on ice.
Transfer the cover glass from the 35 mm dish and mount it cell-side down onto a microscope slide with a drop of Mowiol mounting solution. Allow Mowiol to air-dry. Gently wash the surface of the cover glass and the slide with distilled water.
Observe for OR cell-surface expression under a fluorescent microscope. (TROUBLESHOOTING)
Figure 3.
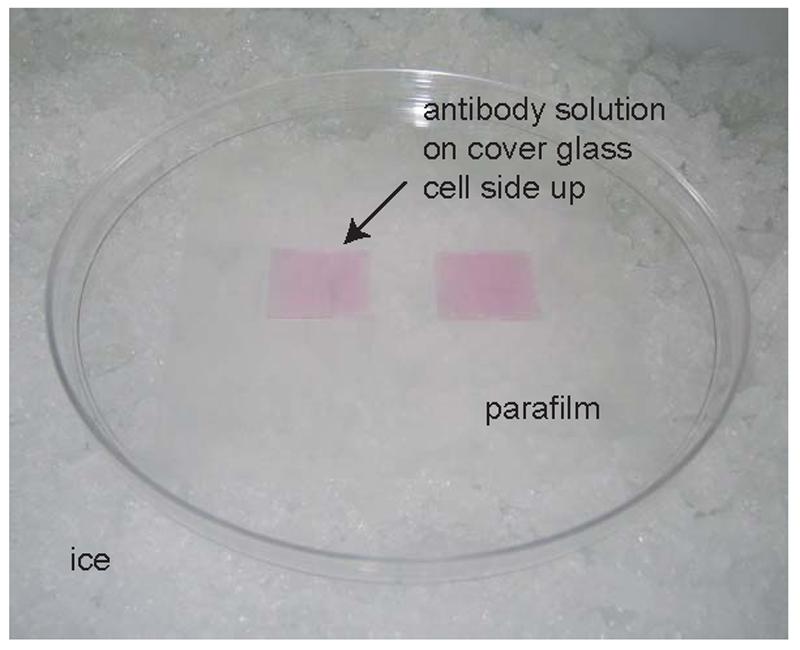
An example of live-cell immunocytochemistry staining setup with antibody solution on two samples
Option B. Live-cell cell-surface flow cytometry (Time: ~5 h)
Observe the transfected cells under a microscope. The cells in each 35 mm dish should be 50-80% confluent (approximately 5.5 - 8.8 × 10⁵ cells) at the time of flow cytometry.
Place cell culture dishes on ice. Place Cellstripper and staining and washing solution for flow cytometry on ice (See REAGENT SETUP).
Fill a large insulated container with ice. Label one 5 ml round-bottom tube for each sample and place on ice until use.
Gently wash cells with 1 ml PBS. Aspirate PBS and add 1 ml Cellstripper. While still on ice, gently agitate the dish and gently triturate to detach the cells. Transfer as many of the cells in Cellstripper as possible to the round-bottom tube on ice.
Add 1 ml staining and washing solution for flow cytometry to the dish to wash and transfer the remaining cells, if any, in the staining and washing solution to the same round-bottom tube. Centrifuge at 4 °C for 3 min at 200g.
Prepare 100 μl of the primary antibody solution (e.g. 1/100 mouse anti-Rhodopsin 4D2) for each sample. Store on ice.
Aspirate all the solution and Cellstripper, retaining the cell pellet at the bottom of the round-bottom tube. Carefully resuspend the cells with 100 μl primary antibody solution. Repeat for each sample except for controls #1 and #2.
Cover the container and incubate for 30-60 min on ice.
At the end of the incubation, add 2 ml washing and staining solution to the tube. Centrifuge at 4 °C for 3 min at 200g.
Aspirate all solution, retaining the cell pellet at the bottom of the tube. Resuspend the cells with another 2 ml washing and staining solution. Centrifuge at 4 °C for 3 min at 200g.
Prepare 100 μl of the secondary antibody solution (e.g. 1/100 PE-conjugated anti-mouse IgG) for each sample. Store on ice.
Aspirate all solution, retaining the cell pellet at the bottom of the tube. Carefully resuspend the cells with 100 μl secondary antibody solution. Repeat for each sample except for controls #1 and #2.
Cover the container with aluminum foil and incubate for 30 min on ice.
At the end of the incubation, add 2 ml washing and staining solution to the tube. Centrifuge at 4 °C for 3 min at 200g.
Aspirate all solution, retaining the cell pellet at the bottom of the tube. Resuspend the cells with another 2 ml washing and staining solution. Centrifuge at 4 °C for 3 min at 200g.
Aspirate all solution and resuspend the cells with 500 μl washing and staining solution. Add 0.5 μl of 7-AAD to each tube to label dead cells. Do not add 7-AAD to controls #1 and #3.
Cover the container with aluminum foil until flow cytometry. In flow cytometry analysis, use the control samples (#1-#4) to determine the desired ranges and parameters to collect the data. Sample #1 is used to determine the cells with appropriate cell size, cell complexity, or cell granularity with forward and side scatter. Sample #2 is used to determine the fluorescent range of the GFP-positive cells and the 7-AAD-negative live cells. Sample 3# is used to determine the PE fluorescent range. Sample #4 is used to determine the nonspecific PE fluorescence. Samples #2-4 are used to determine the parameters for compensation, the process by which one corrects for “spill-over”. Adjusting the amount of GFP plasmid might be necessary if you find too strong/weak GFP signals that cannot be compensated. Measure the PE fluorescence of each cell among 10,000 GFP-positive and 7-AAD-negative cells with appropriate cell size, cell complexity, or cell granularity.. (TROUBLESHOOTING)
Option C: Measuring activation of ORs by the luciferase assay (Time: ~6h)
Stimulation with odorants. Observe the transfected cells under a microscope. The cells in each well should be 50-80% confluent (approximately 1.5 × 10⁵ - 2.4 × 10⁵ cells) at the time of stimulation.
Spread out a thick layer of paper towels in the safety cabinet. Remove the lid of a 96-well plate containing cells prepared in step 9B (viii). Gently and repeatedly tap the plate upside-down on the paper towels so that that transfection medium is completely absorbed by the paper towels.
Pre-warm the stimulation medium (See REAGENT SETUP) to room temperature. Using a multichannel pipetman, transfer 50 μl stimulation medium to each well. Culture in a 37 °C incubator with 5% CO2 for 30 min.
Prepare odorant mixtures diluted in the stimulation medium. Odorants can be prediluted in DMSO, 95% ethanol, or other appropriate solvents to 1 M or lower concentrations and stored at -20 °C until use. Perform serial dilutions of the odorants for stimulation if necessary. For example, the odorant androstenone as described in Keller et al 21 is stored as a 10 mM dilution in 95% ethanol and then serially diluted in the CD293 stimulation medium to 30 μM, 10 μM, 3 μM, 1 μM, 0.3 μM and so on at the time of stimulation. Stimulation medium containing no odorant is usually used as a negative control for each OR tested, as different ORs show different background levels of luciferase activity.
-
Using a multichannel pipetman, transfer 25 μl odorant mixture to each well. Culture in a 37 °C incubator with 5% CO2 for 4 h.
!CRITICAL STEP: Pipette carefully to avoid contaminating neighboring wells when using different odorants and/or different concentrations of the same odorants in the same plate.
Luciferase assay. Depending on the number of plates, thaw an appropriate amount of the premade Dual-Glo™ Luciferase Reagent. Using a multichannel pipetman, add 20 μl of Dual-Glo™ Luciferase Reagent to each well. For example, approximately 2 ml of the solution is needed for each 96-well plate.
Gently rotate the plate at room temperature for 10 min.
Measure firefly luciferase luminescence with a luminescence plate reader. (TROUBLESHOOTING)
Prepare an appropriate amount of fresh Dual-Glo™ Stop-n-Glo® Reagent. Using a multichannel pipetman, add 20 μl Stop-n-Glo® Luciferase Reagent to each well.
Gently rotate the plate at room temperature for 10 min.
Measure Renilla luciferase luminescence with a luminescence plate reader. (TROUBLESHOOTING)
TIMING
Steps 1-3, preparation of HEK293T stock cells: ~3 d
Steps 4-8, transfer cells for transfection: 1 d
Step 9, transfection: 1 d
Step 10A, immunocytochemistry: ~5 h
Step 10B, flow cytometry: ~5 h
Step 10C, luciferase assay: ~6 h
TROUBLESHOOTING
Troubleshooting advice is provided in Table 4.
Table 4.
Troubleshooting
| Problem | Possible causes | Solution |
|---|---|---|
| Few or no cells under microscope (Step 10A (xvi)) or during flow cytometry (Step 10B (xvii)). | Cells lost during the experiment | Plate cells evenly and sparsely when transferring cells for transfection. Use gentle techniques during staining and washing. Dense spots of cells tend to peel off during immunocytochemistry. |
| No cell-surface expression (Step 10A (xvi) or 10B (xvii) of the Procedure) | Staining did not work due to factors such as bad antibody solutions | Verify cell-surface expression of positive controls. |
| Transfection did not work | Verify BFP expression in live-cell staining or GFP expression in flow cytometry. | |
| The OR of interest does not have cell-surface expression | Verify OR protein expression by permeabilized staining or Western Blot. | |
| Unusually low firefly and Renilla luciferase measurements (Steps 10C (vii) and 10C (xi) of the Procedure) | Cells were lost during the experiment | Plate cells evenly and sparsely when transferring cells for transfection and use gentle techniques during transfection, washing, and stimulation. Dense spots of cells tend to peel off during medium change. |
| Cells died due to odorant toxicity | Luciferase measurements may be normal for lower concentrations of the same odorant. Use lower concentrations. | |
| Cells died due to defective 96-well plates | Observe the cells carefully before transfection. |
ANTICIPATED RESULTS
Cell-surface expression assays
Live-cell staining enables the visualization of ORs expressed on the cell surface of HEK293T cells. Under a fluorescent microscope, ORs on the cell surface appear as punctate signals (Figure 4, upper left). Blue fluorescent protein (BFP) expression should be verified where no cell-surface expression is observed to check transfection efficiency (Figure 4, lower right).
Figure 4. An example of cell-surface odorant receptor expression.

Rho-Olfr62 is cotransfected with (upper panels) and without (lower panels) RTP1S. Robust Olfr62 expression is seen as punctate signals when RTP1S is cotransfected and cells are stained with anti-Rhodopsin antibody (top left hand side panel). Lack of cell-surface expression is seen when no RTP1S is cotransfected (bottom left hand side panel). Blue fluorescent protein (BFP) is cotransfected as a control for transfection efficiency (right hand side panels). Scale bar = 50 μm.
Though cell-surface expression is necessary for the OR proteins to respond to their cognate ligands, it is important to note that apparent lack of cell-surface expression does not necessarily exclude OR functional activation in heterologous cells; it is feasible to proceed to OR functional assays with little or no cell-surface expression observed, as low levels of cell-surface expression below the detection threshold may still be able to support the activation of the G proteins and subsequent signal transduction cascade.
Cell-surface flow cytometry
Live-cell flow cytometry enables to quantify the levels of OR cell surface expression. The intensity of the phycoerythrin (PE) signal among the GFP-positive population is measured and plotted. Use sample #4 (no OR) as a negative control. Overlay the plots when comparing multiple conditions (Figure 5). Right-shifted plot indicates more cell-surface expression. Geometric mean values of each plot are also used to compare the levels of expression.
Figure 5. An example of cell-surface flow cytometry.
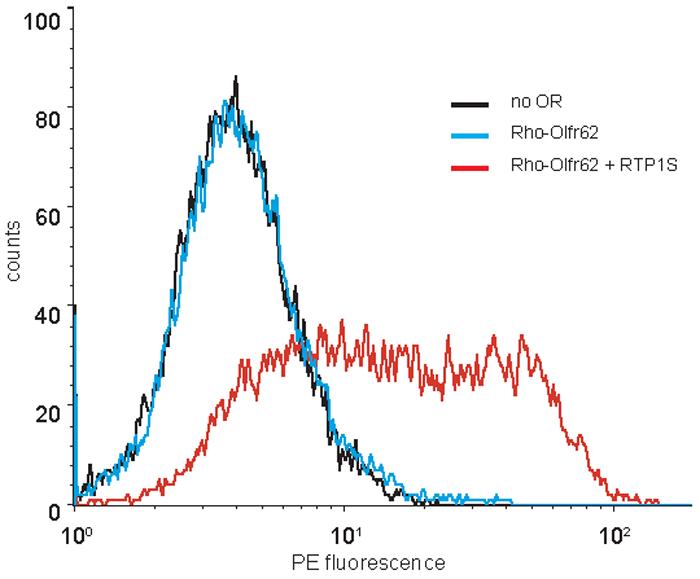
The intensity of the phycoerythrin (PE) signal among the 10,000 GFP-positive cells is measured and plotted. Rho-Olfr62 is cotransfected with and without RTP1S. Robust Olfr62 expression is seen as right-shifted plots when RTP1S is cotransfected and cells are stained with anti-Rhodopsin antibody (red line). Lack of cell-surface expression is seen when no RTP1S is cotransfected (compare blue line and negative control black line).
Activation assay
Firefly and Renilla luciferase measurements for each well are translated into numerical values of luminescence. For a typical experiment, Renilla measurements are usually in the same general range when used with the same OR. However, Renilla measurements could be significantly different when using different ORs, presumably due to compromised overall cell viability with certain ORs. Furthermore, it is recommended to determine the background luminescence level of the system by measuring an empty plate; subsequently subtract the average luminescence value for an empty well from all raw data values.
The firefly-Renilla luciferase ratio can be normalized against either control wells or the lowest/highest luciferase ratios obtained for that experiment. Normalized luciferase activity can be calculated by the formula
where Luc/Renilla(N) = luminescence of firefly luciferase divided by luminescence of Renilla luciferase of a certain well; Luc/Renilla(lowest) = lowest luminescence of firefly luciferase divided by luminescence of Renilla luciferase of a plate or a set of plates; and Luc/Renilla(highest) = highest luminescence of firefly luciferase divided by luminescence of Renilla luciferase of a plate or a set of plates (Figure 6). It is conventional to have replica wells and calculate mean Luc/Renilla(N) and the standard error of mean. The mean Luc/Renilla(N) can then be graphed with its standard error of mean using graphing software such as Microsoft Excel or GraphPad Prism.
Figure 6. A hypothetical case of luciferase assay data interpretation.
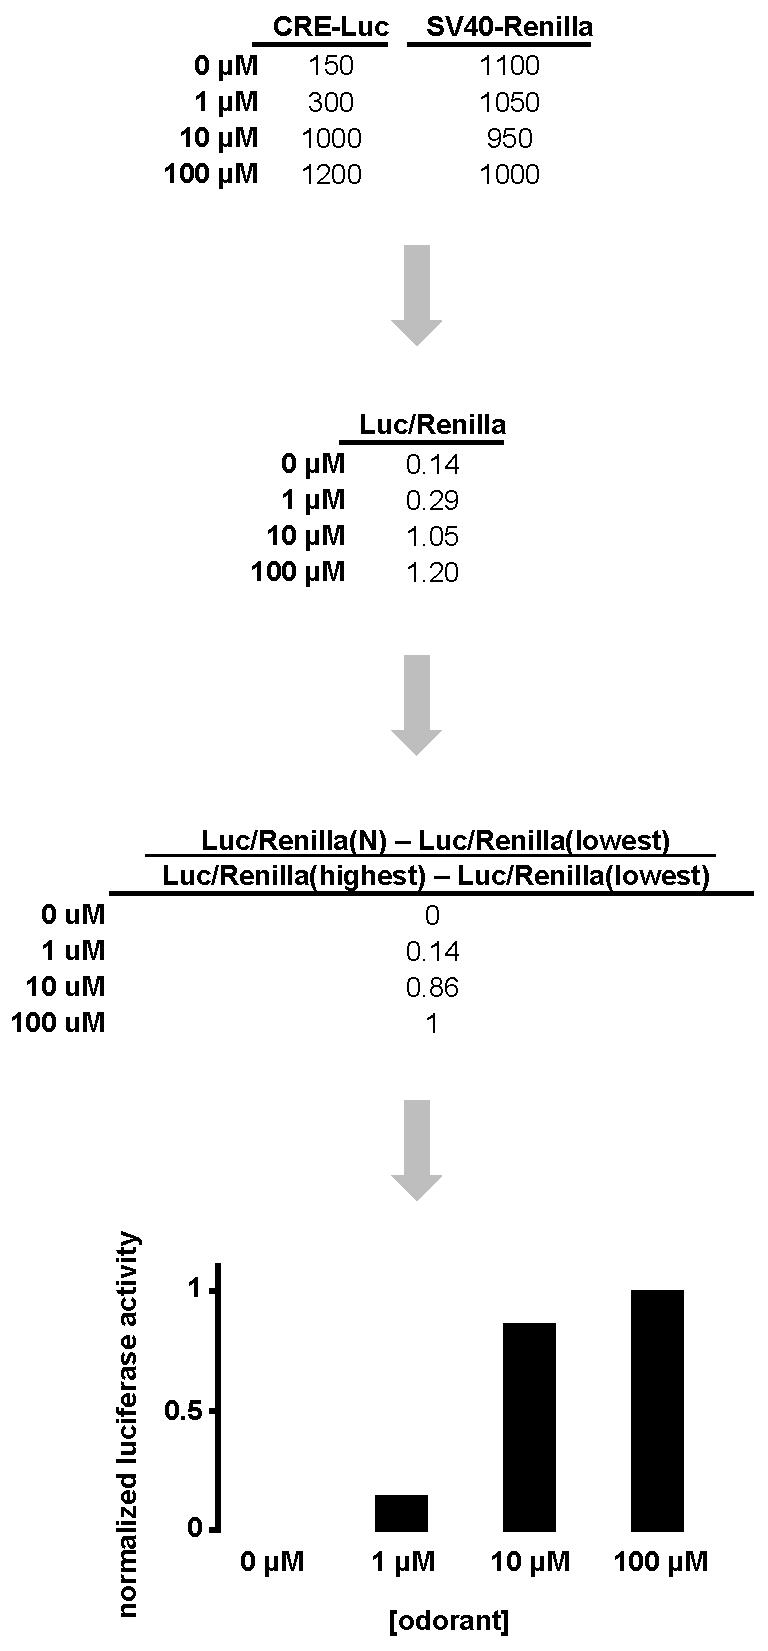
CRE-mediated firefly luciferase (CRE-Luc) measurements and SV40-mediated Renilla luciferase (SV40-Renilla) measurements are obtained for a hypothetical odorant receptor tested against 100 μM, 10 μM, 1 μM, and 0 μM (negative control) of a hypothetical odorant. The ratio of firefly luciferase and Renilla luciferase (Luc/Renilla) adjusts for difference in cell number and transfection efficiency among experiments. Normalization of the data is calculated by the formula [Luc/Renilla(N) - Luc/Renilla(lowest)] / [Luc/Renilla(highest) - Luc/Renilla(lowest)]. A column graph is drawn based on the normalized luciferase activity at each concentration.
It should be noted that some odorants might induce luciferase reporter gene expression in an OR-independent manner. Therefore, control wells expressing different ORs or no OR should be included when using uncharacterized odorants, in addition to the no odorant negative control. Furthermore, 1-100 μM Forskolin, an adenylyl cyclase activator, can be used as a positive control to observe cAMP-dependent luciferase reporter gene induction. The absence of odorant-mediated luciferase induction, however, does not necessarily exclude the functional activation of the OR by the odorant tested. It could result from the lack of cell-surface expression of the receptor or failure of receptor to couple with stimulatory G proteins in this system.
ACKNOWLEDGMENTS
We thank A. Toyama for FACS data. This research was supported by grants to HM from the NIH and Human Frontier Science Program and to HZ from an NIH NRSA Predoctoral fellowship
Footnotes
COMPETING INTERESTS STATEMENT The authors declare no competing financial interests.
REFERENCES
- 1.Barnea G, et al. Odorant receptors on axon termini in the brain. Science. 2004;304:1468. doi: 10.1126/science.1096146. [DOI] [PubMed] [Google Scholar]
- 2.Strotmann J, Levai O, Fleischer J, Schwarzenbacher K, Breer H. Olfactory receptor proteins in axonal processes of chemosensory neurons. J Neurosci. 2004;24:7754–61. doi: 10.1523/JNEUROSCI.2588-04.2004. [DOI] [PMC free article] [PubMed] [Google Scholar]
- 3.Niimura Y, Nei M. Extensive gains and losses of olfactory receptor genes in Mammalian evolution. PLoS ONE. 2007;2:e708. doi: 10.1371/journal.pone.0000708. [DOI] [PMC free article] [PubMed] [Google Scholar]
- 4.Niimura Y, Nei M. Evolutionary changes of the number of olfactory receptor genes in the human and mouse lineages. Gene. 2005;346:23–8. doi: 10.1016/j.gene.2004.09.027. [DOI] [PubMed] [Google Scholar]
- 5.Godfrey PA, Malnic B, Buck LB. The mouse olfactory receptor gene family. Proc Natl Acad Sci U S A. 2004;101:2156–61. doi: 10.1073/pnas.0308051100. [DOI] [PMC free article] [PubMed] [Google Scholar]
- 6.Malnic B, Godfrey PA, Buck LB. The human olfactory receptor gene family. Proc Natl Acad Sci U S A. 2004;101:2584–9. doi: 10.1073/pnas.0307882100. [DOI] [PMC free article] [PubMed] [Google Scholar]
- 7.Zhang X, Firestein S. The olfactory receptor gene superfamily of the mouse. Nat Neurosci. 2002;5:124–33. doi: 10.1038/nn800. [DOI] [PubMed] [Google Scholar]
- 8.Glusman G, Yanai I, Rubin I, Lancet D. The complete human olfactory subgenome. Genome Res. 2001;11:685–702. doi: 10.1101/gr.171001. [DOI] [PubMed] [Google Scholar]
- 9.Young JM, et al. Different evolutionary processes shaped the mouse and human olfactory receptor gene families. Hum Mol Genet. 2002;11:535–46. doi: 10.1093/hmg/11.5.535. [DOI] [PubMed] [Google Scholar]
- 10.Amoore JE, Johnston JW, Jr., Rubin M. The Sterochemical Theory of Odor. Sci Am. 1964;210:42–9. doi: 10.1038/scientificamerican0264-42. [DOI] [PubMed] [Google Scholar]
- 11.Buck L, Axel R. A novel multigene family may encode odorant receptors: a molecular basis for odor recognition. Cell. 1991;65:175–87. doi: 10.1016/0092-8674(91)90418-x. [DOI] [PubMed] [Google Scholar]
- 12.Tate CG, Grisshammer R. Heterologous expression of G-protein-coupled receptors. Trends Biotechnol. 1996;14:426–30. doi: 10.1016/0167-7799(96)10059-7. [DOI] [PubMed] [Google Scholar]
- 13.Lu M, Echeverri F, Moyer BD. Endoplasmic reticulum retention, degradation, and aggregation of olfactory G-protein coupled receptors. Traffic. 2003;4:416–33. doi: 10.1034/j.1600-0854.2003.00097.x. [DOI] [PubMed] [Google Scholar]
- 14.McClintock TS, et al. Functional expression of olfactory-adrenergic receptor chimeras and intracellular retention of heterologously expressed olfactory receptors. Brain Res Mol Brain Res. 1997;48:270–8. doi: 10.1016/s0169-328x(97)00099-5. [DOI] [PubMed] [Google Scholar]
- 15.Gimelbrant AA, Haley SL, McClintock TS. Olfactory receptor trafficking involves conserved regulatory steps. J Biol Chem. 2001;276:7285–90. doi: 10.1074/jbc.M005433200. [DOI] [PubMed] [Google Scholar]
- 16.Dwyer ND, Troemel ER, Sengupta P, Bargmann CI. Odorant receptor localization to olfactory cilia is mediated by ODR-4, a novel membrane-associated protein. Cell. 1998;93:455–66. doi: 10.1016/s0092-8674(00)81173-3. [DOI] [PubMed] [Google Scholar]
- 17.Saito H, Kubota M, Roberts RW, Chi Q, Matsunami H. RTP family members induce functional expression of mammalian odorant receptors. Cell. 2004;119:679–91. doi: 10.1016/j.cell.2004.11.021. [DOI] [PubMed] [Google Scholar]
- 18.Zhuang H, Matsunami H. Synergism of accessory factors in functional expression of Mammalian odorant receptors. J Biol Chem. 2007;282:15284–93. doi: 10.1074/jbc.M700386200. [DOI] [PubMed] [Google Scholar]
- 19.Von Dannecker LE, Mercadante AF, Malnic B. Ric-8B, an olfactory putative GTP exchange factor, amplifies signal transduction through the olfactory-specific G-protein Galphaolf. J Neurosci. 2005;25:3793–800. doi: 10.1523/JNEUROSCI.4595-04.2005. [DOI] [PMC free article] [PubMed] [Google Scholar]
- 20.Von Dannecker LE, Mercadante AF, Malnic B. Ric-8B promotes functional expression of odorant receptors. Proc Natl Acad Sci U S A. 2006;103:9310–4. doi: 10.1073/pnas.0600697103. [DOI] [PMC free article] [PubMed] [Google Scholar]
- 21.Keller A, Zhuang H, Chi Q, Vosshall LB, Matsunami H. Genetic variation in a human odorant receptor alters odour perception. Nature. 2007;449:468–72. doi: 10.1038/nature06162. [DOI] [PubMed] [Google Scholar]
- 22.Katada S, Nakagawa T, Kataoka H, Touhara K. Odorant response assays for a heterologously expressed olfactory receptor. Biochem Biophys Res Commun. 2003;305:964–9. doi: 10.1016/s0006-291x(03)00863-5. [DOI] [PubMed] [Google Scholar]
- 23.Sands WA, Palmer TM. Regulating gene transcription in response to cyclic AMP elevation. Cell Signal. 2008;20:460–6. doi: 10.1016/j.cellsig.2007.10.005. [DOI] [PubMed] [Google Scholar]
- 24.Zhao H, et al. Functional expression of a mammalian odorant receptor. Science. 1998;279:237–42. doi: 10.1126/science.279.5348.237. [DOI] [PubMed] [Google Scholar]
- 25.Touhara K, et al. Functional identification and reconstitution of an odorant receptor in single olfactory neurons. Proc Natl Acad Sci U S A. 1999;96:4040–5. doi: 10.1073/pnas.96.7.4040. [DOI] [PMC free article] [PubMed] [Google Scholar]
- 26.Krautwurst D, Yau KW, Reed RR. Identification of ligands for olfactory receptors by functional expression of a receptor library. Cell. 1998;95:917–26. doi: 10.1016/s0092-8674(00)81716-x. [DOI] [PubMed] [Google Scholar]
- 27.Kajiya K, et al. Molecular bases of odor discrimination: Reconstitution of olfactory receptors that recognize overlapping sets of odorants. J Neurosci. 2001;21:6018–25. doi: 10.1523/JNEUROSCI.21-16-06018.2001. [DOI] [PMC free article] [PubMed] [Google Scholar]
- 28.Offermanns S, Simon MI. G alpha 15 and G alpha 16 couple a wide variety of receptors to phospholipase C. J. Biol. Chem. 1995;270:15175–15180. doi: 10.1074/jbc.270.25.15175. [DOI] [PubMed] [Google Scholar]
- 29.Shirokova E, et al. Identification of specific ligands for orphan olfactory receptors. G protein-dependent agonism and antagonism of odorants. J Biol Chem. 2005;280:11807–15. doi: 10.1074/jbc.M411508200. [DOI] [PubMed] [Google Scholar]
- 30.Chandrashekar J, et al. T2Rs function as bitter taste receptors. Cell. 2000;100:703–11. doi: 10.1016/s0092-8674(00)80706-0. [DOI] [PubMed] [Google Scholar]
- 31.Sambrook J, Russell DW. Molecular cloning : a laboratory manual. Cold Spring Harbor Laboratory Press; Cold Spring Harbor, N.Y.: 2001. [Google Scholar]
- 32.Harlow E, Lane D, Cold Spring Harbor Laboratory . Antibodies, a laboratory manual. xiii. Cold Spring Harbor Laboratory; Cold Spring Harbor, N.Y.: 1988. p. 726. [Google Scholar]
- 33.Araki I, Nakamura H. Engrailed defines the position of dorsal di-mesencephalic boundary by repressing diencephalic fate. Development. 1999;126:5127–35. doi: 10.1242/dev.126.22.5127. [DOI] [PubMed] [Google Scholar]
- 34.Laird DW, Molday RS. Evidence against the role of rhodopsin in rod outer segment binding to RPE cells. Invest Ophthalmol Vis Sci. 1988;29:419–28. [PubMed] [Google Scholar]
- 35.Osborn M, Weber K. Immunofluorescence and immunocytochemical procedures with affinity purified antibodies: tubulin-containing structures. Methods Cell Biol. 1982;24:97–132. doi: 10.1016/s0091-679x(08)60650-0. [DOI] [PubMed] [Google Scholar]
- 36.Philpott NJ, et al. The use of 7-amino actinomycin D in identifying apoptosis: simplicity of use and broad spectrum of application compared with other techniques. Blood. 1996;87:2244–51. [PubMed] [Google Scholar]