

Abstract
The trajectory, mass fluxes, and deposition of aerosolized particles in a complex tubular system have been predicted. A procedure based on Lagrangian stochastic modeling is proposed to enable the anticipation of such phenomena, taking advantage of experimental results to characterize the air flow. The predictions have been obtained for pharmaceutical aerosols delivered by dry powder inhalers. A critical assessment of the dispersion model has been carried out using data available in the literature. The procedure assumes a low volume fraction of particles in the simulation of turbulent dispersion, but deposition is physically based on the interaction between the particles and both solid and liquid surfaces. The results were confirmed by experimental tests of powder deposition, run according to the European Pharmacopoeia. A parametric study was also carried out with the aim of providing a more complete evaluation of the model’s performance. The comparison between predictions and experimental results has shown that the model properly describes the deposition of aerosolized particles.
Key words: aerosol, computational model, dry powder inhaler, lung drug delivery, particle deposition
INTRODUCTION
Delivery of drugs to the lungs as an aerosol is regarded as a desirable practice for local or systemic delivery due to the high efficacy and acceptability by both patients and physicians (1). Aerosols have been used traditionally on the treatment of illnesses of the lungs and the respiratory tract such as asthma, chronic obstructive pulmonary disease, and on vaccination (2). Attempts to deliver proteins have been made with some success (3). Although aerosols have been in use for centuries, it was in the 1940s that with the use of sodium cromoglycate this dosage form became established. Since then, the development of new medicines has become less empirical and often reliant on modeling of both devices and particles of drug.
The design of new formulations and inhaler devices must be assisted by a series of in vitro tests prior to the clinical evaluation. In order to assess the quality of the aerosols, samples containing the drug are produced and evaluated in testing devices such as cascade impactors (e.g., Andersen multi-stage impactor) or multi-stage liquid impingers [e.g., twin impinger (4)]. These devices are designed to simulate the movement and location of deposition of particles in the respiratory tract and their use is compulsory for the evaluation of the performance of aerosols. However, these tests are costly, time consuming, and the fundamental concept is rather empirical. Thus, models based on physical fundamentals are deemed more appropriate to describe the deposition of particles than others simply relying on empirical observations. It follows that robust computational methods together with mathematical modeling are needed to anticipate problems related to the in vivo use of aerosols. It can be expected that these models will accelerate the development of new and better medicines. Modeling of particle deposition in the lungs has been attempted in different ways. Rudolf et al. (5) determined experimentally the regional deposition of particles and the data used to model the transport of particles in the airways. In a different approach, different authors (6–9) employed computational techniques to study the deposition of particles in the human airways, using realistic models of the human oropharynx. In principle, such models present the advantage of considering the deposition of the particles in the location where they are assumed to be settled. However, these are in fact simplified models, which do not account for variations between individuals or variations in the airway geometry due to changes in the flow rate of inhalation (10).
Coates et al. (11, 12) applied computational methods to study different geometries of devices for inhalation. Swanson et al. (13) have also pursued this methodology to study the deposition of particles in a cascade impactor, simulating the continuous (air) and the discrete (particles) phases using a commercial package for flow simulation. In their work, the authors took into consideration statistical aspects, without any physical reasoning, to account for the deposition of the particles. Further, when particle rebound occurred, the resulting loss of energy was assumed to be constant and independent of the angle of impact of the particles on the wall. Hari et al. (14) also studied the deposition of particles in a single stage of a cascade impactor, with the goal of testing a commercial software package available to simulate both continuous and discrete phases. The results followed closely the observations, but their task was facilitated as the impaction plate was coated with a material to catch all the particles that contacted with it, thus preventing re-suspension and bounce.
Although simplifications to the underlying physical mechanisms have been made by the foregoing authors, the numerical simulation of the deposition of particles in testing devices enables a straightforward validation of the results against experimental data. In addition, contrary to the models of the human airways, the exact geometry of the impactor under consideration can effectively be taken into account. However, the complexity of the flow pattern in such devices also requires the application of elaborate mathematical models. To minimize the uncertainty associated to the prediction of a complex, recirculating turbulent flow, the direct measurement of the flow inside the device seems to be a preferred approach, rather than the use of computational models, to predict the behavior of both discrete and continuous phases. These measurements can be carried out employing a variety of techniques, namely laser Doppler anemometry (LDA), particle image velocimetry (PIV), or hot-wire anemometry (15). The use of an optical technique (e.g., LDA) is desirable because it does not disturb the flow inside the device. Naturally, this kind of data would be very difficult to produce within the human airways, but the fundamentals would remain valid.
The aim of the present work is the development and evaluation of a computational model to predict the trajectory, mass fluxes, and deposition of particles from a dry powder inhaler in a set of compartments with complex geometry, using data collected from LDA experiments to characterize the continuous phase of the flow. The proposed model assumes a low volume fraction of particles in the simulation of turbulent dispersion, but it is physically based on the interaction between the particles and both solid and liquid surfaces.
EXPERIMENTAL CHARACTERIZATION OF THE AIR FLOW INSIDE THE TWIN IMPINGER
An optical measuring technique was employed with the objective of providing a detailed and accurate characterization of both mean and turbulent velocity fields of the continuous phase inside the glass twin impinger (TI) (Fig. 1). Specifically, a two-component, fiber-optic laser Doppler anemometer (LDA) operating in backward-scatter mode (DANTEC, Denmark) was used to meet that purpose. Due to the fact that the various parts of the TI are made of DURAN® glass (refractive index n = 1.47) and display highly curved surfaces, a procedure to minimize the measurement errors resulting from the refraction of the laser beams in the glass walls was devised. Ideally, the TI should have been submerged into a liquid showing the same refractive index of the DURAN® glass (refractive index matching), thus allowing to obtain optical continuity. However, usable fluids characterized by the demanded value of n exhibit high viscosity, leading to significant heat generation as a result of viscous dissipation and, hence, their physical properties could not be easily kept constant during the experiments. A good compromise was found by using water as working fluid (n = 1.34), which allowed the fluid temperature variations to be kept within ±0.2°C using a thermostatic bath. In order to achieve dynamic similarity with the air flow case, the same value of the Reynolds number has been prescribed.
Fig. 1.

Schematic representation of the twin impinger
Nylon particles (DANTEC, Denmark) were used as seeding in the LDA measurements. These particles show appropriate values of diameter (5 ± 1.5 μm) and density (1.02 g/cm3) in order to ensure that the water flow was accurately traced (16). LDA measurements were carried out at 1,011 locations in the first chamber of the TI, at 1,352 locations in the second chamber, and at 40 locations in the axisymmetric duct connecting the chambers. Mean and turbulent velocities at each location were obtained using ensemble averages from about 5,000 measurements, thus leading to global uncertainties below 2% in mean values and 5% in the corresponding variances (16).
THEORETICAL AND NUMERICAL MODELING
Particle Transport and Dispersion
A stochastic-based numerical model was developed to simulate the two-phase, turbulent flow inside the first stage of the TI, thus allowing the determination of the trajectories of the aerosol particles and their locations of deposition. In this model, an Eulerian description of the continuous phase flow was adopted, which required the discretization of the device chambers into small control volumes. The number of nodes along computational directions i, j, and k, corresponding to the numerical meshes representing the first chamber (Fig. 2a, b), the connecting duct, and the second chamber (Fig. 2c, d), are shown in Table I. The values of the mean flow velocity and turbulent kinetic energy in each one of the nodes were obtained by interpolation of the results from the LDA measurements using a “kriging” method and ensuring the no-slip condition at the walls. In addition, as only planar measurements were carried out, the third component of the mean velocity has been obtained by making use of the concept of continuity and the corresponding velocity variance was estimated from available counterparts (17).
Fig. 2.

Planar representation of the computational meshes used in the discretization of the first and second chambers of the TI: a, b first chamber; c, d second chamber; a, c evolution along computational directions i and j; b, d evolution along direction k
Table I.
Number of Nodes of the Structured Meshes Representing each one of the Sections in which the First and Second Chambers of the TI have been Divided, According to Computational Directions i, j, and k
| i | j | k | |
|---|---|---|---|
| First chamber | 32 | 32 | 70 |
| Connecting duct | 32 | 32 | 45 |
| Second chamber | 32 | 32 | 55 |
In contrast to the approach chosen for the continuous phase, Lagrangian stochastic modeling based on an Eddy-Interaction Model (EIM) was employed to simulate the transport and dispersion of aerosol particles (18). The mechanisms considered here included particle inertia and convection, Brownian and turbulent diffusion, and gravitational settling.
Taking into account the forces of inertia, aerodynamic drag, gravity, buoyancy, and virtual mass, the particle’s trajectory may be described by the following set of first-order ordinary differential equations:
 |
1 |
 |
2 |
where  is the particle position vector,
  and
and  stand for the velocity vectors of the particle and the fluid, respectively, t is time, FD is an aerodynamic drag force coefficient, ρ and ρf are the particle and fluid densities, respectively, and
  is a generic force per unit mass to bring the remaining body forces into the analysis. For particles characterized by a diameter d ≥ 500 nm, Brownian diffusion may be neglected, thus leading to:
 |
3 |
 |
4 |
In Eqs. (3 and 4),  stands for the gravitational acceleration and CD is a drag coefficient calculated from:
 |
5 |
where Re denotes a relative Reynolds number calculated using the dynamic viscosity of the fluid μ, as follows:
 |
6 |
Other forces such as Magnus, Saffman, or Basset forces were not considered because their relative importance is expected to be much smaller than that for the previous ones. However, for particles characterized by a diameter d < 500 nm, Brownian diffusion must be taken into account. In this case, the generic force  and the aerodynamic drag force coefficient are alternatively expressed by:
 |
7 |
 |
8 |
where T is the temperature, σ stands for the Boltzmann constant, and  denotes a pseudorandom vector (19). The amplitudes of the components of Brownian forces are thus computed at all time steps Δt, during the calculation of the particle trajectory. In Eq. (8), Cc stands for the well-known Cunningham factor given by:
 |
9 |
where λ is the mean free path of fluid (gas) molecules.
The numerical solution of Eqs. (1 and 2) was obtained iteratively via a modified version of the “regula falsi” method for the solution of the non-linear algebraic equation resulting from their discretization in time using a backward Euler method. A constant value of the fluctuating (turbulent) velocity component of the fluid was assumed in the EIM model within each (variable) time step Δt, which was determined by the characteristic life time of eddies in the turbulent flow. These velocities were obtained by randomly sampling a Gaussian distribution with a standard deviation of  . In this model, each individual particle interacts successively with different turbulent eddies along its trajectory. Hence, the interaction time was calculated here using an approach that relates eddie time and velocity scales via k–ε modeling (20). In the present case, the dissipation rate ɛ of the turbulent kinetic energy k is estimated using the low-Reynolds-number model developed for wall boundary layers (21) as follows:
 |
10 |
where lε is a length scale characterizing the turbulent dissipation expressed by:
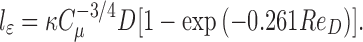 |
11 |
In Eq. (11), ReD is a local Reynolds number based on the wall distance D and the turbulent eddie velocity scale  , κ denotes the von Kármán constant, and Cμ
= 0.09. The characteristic length Le and time Te of the turbulent eddies is finally given by:
, κ denotes the von Kármán constant, and Cμ
= 0.09. The characteristic length Le and time Te of the turbulent eddies is finally given by:
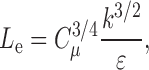 |
12 |
 |
13 |
The foregoing procedure was applied on tracking of a statistically high number of particles so that the effects of turbulence could be stochastically accounted for. The determination of the Eulerian control volume where the particle was after each Lagrangian time step was carried out via a circular search around the previous position of the particle (22). In addition, an accurate quantification of the wall distance was performed taking into account the various curvatures of the closest surfaces. Further details about the computational procedure were given by Mendes et al. (23).
Particle–Surface Interaction and Deposition
In the numerical model, the aerosol particles were assumed to be dispersed enough so that the interactions between them may be neglected, which is consistent with typical mass streams from dry powder inhalers. However, the interaction of the particles with solid surfaces is considered a key mechanism in the present study, namely the inelastic impact. This has been simulated employing a simple model based on the use of normal and tangential coefficients of restitution, which display a cubic dependence on the impact angle (24). Further, it is predicted that the particles will stay adhered to the wall when their kinetic energy after impact is not sufficient to compensate van der Waals forces (25). This may be translated in terms of a minimum particle velocity for escape, via energy balance, as follows:
 |
14 |
where Vmin is the minimum velocity of impacting particles required to avoid adhesion, A is the Hamaker constant (assumed here as 1.15 × 10⁻²⁰ J), and Z0 is the separation distance between particle and wall (taken as 0.4 × 10⁻⁹ m). The effect of electrostatic forces may also be easily included in Eq. (14), but these were not currently considered due to the uncertainty associated to the electric properties and charges of the materials used in this study.
A similar procedure was followed for the interaction between the aerosol particles and the liquid surface on the second chamber of the TI. The model accounts for a balance between the kinetic energy of the particle before impact, the energy associated with the surface tension of the liquid, and the gravity potential energy (26). When a particle impacts the liquid surface, a cavity in the surface is formed. When the kinetic energy of the particle is small, the formed cavity is also small, thus not sufficient to overcome the surface tension of the surface, and the particle is returned. On the other hand, when the kinetic energy of the particle is high, it becomes sufficient to overcome the surface tension of the liquid and the particle is retained in the liquid. Similarly to the interaction with the solid surfaces, a minimum particle velocity for escape was defined, as follows:
 |
15 |
where γ stands for the surface tension of the water and Rm is the radius of the concavity in the liquid surface (taken as Rm = 1.7d). The latter value is somewhat smaller than that proposed by Li et al. (26), but they also referred that their value was larger than those provided by experiments.
When a particle is moving far from the walls, it is assumed that the velocity gradients in the continuous phase are small. Consequently, the fluid velocity may be taken as constant inside each mesh volume used in the discretization of the computational domain, thus not requiring an exact determination of the particle position within the volume. However, when a particle is moving in the vicinity of walls, say inside a mesh volume containing an external boundary, large velocity gradients are observed in the continuous phase and therefore it is no longer acceptable to assume a piecewise-constant evolution for the fluid velocity. In such areas, a near-wall law (27) involving an inverse-distance weighted interpolation in the local velocity field was used instead.
RESULTS AND DISCUSSION
Air Flow inside the Twin Impinger
Figure 3 illustrates normalized fields of mean velocity,  , and turbulent kinetic energy, k, inside the two chambers of the TI considered in this study, after the previously described three-dimensional reconstruction from the LDA measurements. These results correspond to an air flow rate of 60 l/min, which is the standard operation condition of the impinger, and the resulting bulk velocity at the inlet, U, was used as velocity scale.
Fig. 3.

Air flow at meridional planes inside the two chambers of the first stage of the TI for a flow rate of 60 l/min: a first chamber, side view; b first chamber, top view; c second chamber, side view; d second chamber, front view. Arrow vectors: mean flow velocity; colored contours: turbulent kinetic energy
It can be observed in Fig. 3a that part of the air establishes a recirculation on the top region of the first chamber and another part impinges on the wall surface facing the entrance section. The remaining air seems to be drawn directly through the exit of this chamber. However, the mean flow pattern in Fig. 3b also demonstrates the presence of two Dean vortices, which are associated to the establishment of a strong secondary flow across the connecting duct. Subsequently, the air is discharged towards the bottom of the second chamber, producing an approximately toroidal recirculation around the vertical duct, as shown in Fig. 3c and d. The contours of turbulent kinetic energy show that the local maxima of turbulent fluctuations are well correlated with the location of strong vortical motion. These features are expected to significantly influence the behavior of the aerosol particles as these are transported and dispersed by the air flow (28).
Validation of the Dispersion Model
The present model for transport and dispersion of particles was first validated by comparison with the experimental results obtained by Snyder and Lumley (29), using particles of hollow glass (d = 46.5 μm; ρ = 0.26 g/cm3), corn pollen (d = 87.0 μm; ρ = 1.00 g/cm3), and glass beads (d = 87.0 μm; ρ = 2.50 g/cm3). A second validation against the results reported by Wells and Stock (30) was carried out aiming to assess whether the model also produced the correct response to the effect of crossing trajectories. In this case, the particles were spheres characterized by d = 57.0 μm and ρ = 2.42 g/cm3, subjected to an equivalent gravity of 0, 28.4, and 72.4 m/s2.
For validation purposes, computational results obtained with data sets of 5,000 particles were used in order to ensure statistical independence. Figure 4 compares the dispersion of different types of particles as a function of time obtained in the experiments of Snyder and Lumley (29) with the predictions of the present computational model. A similar comparison is made against the experimental results of Wells and Stock (30) in Fig. 5 for particles subjected to different values of equivalent gravity as a function of a normalized distance along the flow. It can be observed that good agreement between predictions and experiments occurred in both cases. Improved results for the latter comparison were obtained with a modification to the base model, closely following the suggestions of Mehrotra et al. (31). Altogether, these observations reveal that the present computational model has the ability to properly simulate the turbulent dispersion of particles in an air stream.
Fig. 4.

Dispersion of different types of particles as a function of time: comparison between the experimental results (symbols) obtained by Snyder and Lumley (29) and the predictions of the present computational model (lines)
Fig. 5.

Dispersion of particles subjected to different values of equivalent gravity as a function of a normalized distance along the flow: comparison between the experimental results (symbols) obtained by Wells and Stock (30) and the predictions of the present computational model (lines)
Particle Deposition inside the Twin Impinger
Aiming to validate the modeling procedure for particle deposition, computational tests were carried out at simulated air flow rates of 30 and 60 l/min. Computer-generated particles approximating the properties (namely density and particle size distribution) of those found in Ventilan RotacapsTM (GlaxoSmithKline) were used. These were characterized by a geometric mean diameter (GMD) of 2.7 μm and a geometric standard deviation (GSD) of 2.1 (32). The predictions of the present model were compared with experimental results, run accordingly with the European Pharmacopeia (4), using the same medicine.
Figure 6 shows a few examples of calculated particle trajectories inside the first chamber of the TI. Although only 288 particle trajectories have been represented in this figure for the sake of clearness, it can be seen that a large number of particles already impact on the walls of this chamber. These regions of impact are expected to be associated with significant particle deposition, partially explaining the well-known high loss on the dose reaching the second stage of the device. In the remaining results, the complete set of 15 × 103 individual particles has been considered in the analysis to ensure statistical significance.
Fig. 6.

Examples of calculated particle trajectories inside the first chamber of the TI: a side view; b top view
The particles entering the first chamber of the first stage of the TI can be divided into two groups: the first one related to the particles adhering to the walls of the first chamber and the second one made of particles moving on to the next chamber. Figure 7 illustrates the deposition pattern in the walls of the first chamber of the device produced by computer-generated particles. The largest concentrations of adhered particles can be observed in bottom areas located at the end of the inlet (a), on the wall opposite to the chamber entrance (b), and along the connecting duct (c). The footprint of the secondary flow previously described for the continuous phase (see ‘Air Flow inside the Twin Impinger’) can be found at the exit of the spherical compartment, where strong deposition occurs, as shown in Figure 6a and c. Similar results were obtained irrespective of the prescribed value of the air flow rate (30 or 60 l/min). On the other hand, the air flow field in the inlet region of the first chamber may be modified by the inhaler used, which will also have an impact on the deposition pattern. Therefore, it is advisable to determine the air flow field with the inhaler in place.
Fig. 7.

Deposition pattern in the walls of the first chamber of the TI produced by computer-generated particles: a side view; b front view; c top view. Particles are not to scale
Figure 8 shows the mass and particle density distributions predicted by the computational model in a cross-section located in zone C (see Fig. 7), for an air flow rate of 60 l/min. It can be seen that the higher particle density (in red) occurred near the center of the duct, whereas the maximum of mass concentration was found in the vicinity of the wall. This is a consequence of the fact that, in general, large particles do not stay adhered immediately after impact. These particles are dragged along the wall by the air flow and, eventually, find their deposition site further downstream. By contrast, a much larger number of small particles closely follow the air flow streamlines, finding their way around the axis of the connecting duct. It must be noted that, for example, the mass of a particle with a diameter of 10 μm is 103 times larger than the mass of a particle with a diameter of 1 μm.
Fig. 8.

Particle distributions predicted by the computational model in a cross-section located at the exit of the first chamber of the TI: a by mass; b by number
The results of particle deposition produced by the computational model are compared in Fig. 9 with experimental data, obtained using a TI operated at air flow rates of 30 and 60 l/min. As the model is not able to quantify the deposition of particles inside the inhalation device or in the capsule shells, only the mass of particles effectively entering the TI was considered in the analysis. In addition, for comparison purposes (Fig. 9), the first chamber was defined as zone 1, and zone 2 embraced both the connecting duct and the second chamber. Finally, it was assumed that the fine particle fraction (FPF) corresponded to the particles which were not trapped in the first stage of the TI. Four repetitions of the experiments were made for both flow rates, thus allowing to compute the standard deviations shown in Fig. 9 as error bars (±standard deviation). The agreement between simulations and experiments is fairly good irrespectively of the air flow rate, showing higher values of FPF at the larger flow rate as might be expected. However, the observed differences between the deposition patterns changed with the variation of the air flow rate. This may be due to the fact that the computational model cannot take directly into consideration the effects of the inhalation device, which, by affecting the de-agglomeration process, influences the deposition pattern (33).
Fig. 9.

Comparison between the results of particle deposition in the TI experimentally and by simulation, with air flow rates of 30 and 60 l/min (error bars in experimental data represent ±standard deviation)
Additional tests to the computational model were also carried out at a simulated air flow rate of 60 l/min, employing computer-generated particles with a GMD of 3, 5, 7, and 50 μm and a GSD of 1.5. Figure 10 presents the corresponding particle size distributions. The predicted deposition patterns for these four sets of particles are shown in Fig. 11. Again, the behavior of the model was in accordance with our expectations, leading to a continuous decrease in FPF as the value of GMD increased. It can also be noted that for the three lower values of GMD an increment in this parameter leads to increasing deposition in the first chamber of the impactor, whereas a drastic reduction in particle deposition is obtained for a GMD of 50 μm. The latter particles have a large inertia, forcing them to impact on the walls of the first chamber. However, their kinetic energy is also larger, thus allowing these particles to avoid adhesion in this zone. The majority of these large particles find their deposition site in the second chamber, which proves to be very effective in this size range.
Fig. 10.

Particle size distributions used to assess the performance of the computational model (GSD = 1.5)
Fig. 11.

Deposition of particles with diameters of 3, 5, 7, and 50 μm in the virtual TI, using a flow rate of 60 l/min
Care must be taken when comparing the results presented before in Fig. 9 (GMD of 2.7 μm) and those shown in Fig. 11 for a GMD of 3 μm. Although these two sets exhibit nearly the same value of GMD, significant differences can be found when comparing the corresponding particle distributions (32). In fact, the latter particles are characterized by a much narrower distribution, resulting from the lower value of GSD (1.5 instead of 2.1). This demonstrates the sensitivity of the computational model to higher-order statistics of the particle distributions, which is a critical feature to properly simulate the deposition of particles inside an impactor.
CONCLUSIONS
A computational procedure based on Lagrangian stochastic modeling was developed to predict the movement and deposition of drug particles in a set of compartments with complex geometry, such as the ones found in a twin impinger. Experimental data from laser Doppler anemometry was used to describe the air flow field for improved accuracy. The computational model enabled the identification of the surfaces of impact and adhesion of aerosol particles to the walls of the twin impinger as well as to quantify their deposition. The present model was validated and its predictions were compared with experimental results, run according to the European Pharmacopoeia. It has been shown to produce the correct responses to variations in the particle distributions and air flow rate, thus demonstrating the capabilities of the proposed procedure for the simulation of the deposition of pharmaceutical powders. However, the computational model cannot take directly into consideration the influence of the inhaler. Consequently, this model must be regarded essentially as a tool for particle design, thus allowing a straightforward comparison between the performances of particles with different characteristics. In addition, it must be noted that this procedure can be easily extended to other impactors.
References
- 1.Thompson D. C. Pharmacology of therapeutic aerosols. In: Hickey A.J., editor. Pharmaceutical inhalation aerosol technology. New York: Informa Health Care; 2003. pp. 31–64. [Google Scholar]
- 2.O’Callagham C., Nerbimk O., Vidgren M.T. The history of inhaled drug therapy. In: Bisgaard H., O’Callagham O., Smaldone G.C., editors. Drug delivery for the lung. New York: Marcel Dekker; 2002. pp. 1–20. [Google Scholar]
- 3.Hawkins M. J., Soon-Shiong P., Desai N. Protein nanoparticles as drug carriers in clinical medicine. Adv. Drug Del. Rev. 2008;60:876–885. doi: 10.1016/j.addr.2007.08.044. [DOI] [PubMed] [Google Scholar]
- 4.European Pharmacopoeia. Preparation for inhalation—aerodynamic assessment of fine particles (2.9.18), (6th Ed.). Strasbourg, 2008.
- 5.Rudolf G., Gebhart J., Heyder J., Scheruch G., Stiahlhofen A. Mass deposition from inspired polydisperse aerosol. Ann. Occup. Hyg. 1986;32(S1):919–938. [Google Scholar]
- 6.Heenan A. F., Matida E., Pollard A., Finlay W. H. Experimental measurements and computational modeling of the flow field in an idealized oropharynx. Exp. Fluids. 2003;95:1382–1392. [Google Scholar]
- 7.Matida E. A., Finlay W. H., Lange C. F., Grgic B. Improved numerical simulation of aerosol deposition in an idealized mouth-throat. J. Aerosol Sci. 2004;35:1–19. doi: 10.1016/S0021-8502(03)00381-1. [DOI] [Google Scholar]
- 8.Asgharian B., Brice O. T., Hofmann W. Prediction of particle deposition in the human lung using realistic models of lung ventilation. J. Aerosol Sci. 2006;37:1209–1221. doi: 10.1016/j.jaerosci.2006.01.002. [DOI] [Google Scholar]
- 9.Xi J. X., Longest P. W. Transport and deposition of micro-aerosols in realistic and simplified models of the oral airway. Ann. Biomed. Eng. 2007;35:560–581. doi: 10.1007/s10439-006-9245-y. [DOI] [PubMed] [Google Scholar]
- 10.Grgic B., Finlay W. H., Heenan A. F. Regional aerosol deposition and flow measurements in an idealized mouth and throat. J. Aerosol Sci. 2004;35:21–32. doi: 10.1016/S0021-8502(03)00387-2. [DOI] [Google Scholar]
- 11.Coates M. S., Fletcher D. F., Chan H.-K., Raper J. A. Effect of design on the performance of a dry powder inhaler using computational fluid dynamics Part 1: grid structure and mouthpiece length. J. Pharm. Sci. 2004;93:2863–2876. doi: 10.1002/jps.20201. [DOI] [PubMed] [Google Scholar]
- 12.Coates M. S., Fletcher D. F., Chan H.-K., Raper J. A. Effect of design on the performance of a dry powder inhaler using computational fluid dynamics Part 2: air inlet size. J. Pharm. Sci. 2006;95:1382–1392. doi: 10.1002/jps.20603. [DOI] [PubMed] [Google Scholar]
- 13.Swanson P. D., Muzzio F. J., Annapragada A., Adjei A. Numerical analysis of motion and deposition of particles in cascade impactors. Int. J. Pharm. 1996;142:33–51. doi: 10.1016/0378-5173(96)04643-1. [DOI] [Google Scholar]
- 14.Hari S., Hassan Y. A., McFarland A. R. Computational fluid dynamics simulation of a rectangular slit real impactor’s performance. Nucl. Eng. Des. 2005;235:1015–1028. doi: 10.1016/j.nucengdes.2004.12.004. [DOI] [Google Scholar]
- 15.Doebelin E. O. Measurement systems application and design. New York: McGraw-Hill; 1990. [Google Scholar]
- 16.Albrecht H. E., Borys M., Damaschke N., Tropea C. Laser Doppler and phase Doppler measurement techniques. Berlin: Springer; 2003. [Google Scholar]
- 17.Sousa J. M. M. Turbulent flow around a surface-mounted obstacle using 2D-3C DPIV. Exp. Fluids. 2002;33:854–862. [Google Scholar]
- 18.Yuu S., Yasukouchi N., Hirosawa Y., Jotaki T. Particle turbulent diffusion in a dust laden round jet. AIChE J. 1978;24:509–519. doi: 10.1002/aic.690240316. [DOI] [Google Scholar]
- 19.Moskal A., Gradoń L. Temporary and spatial deposition of aerosol particles in the upper human airways during breathing cycle. J. Aerosol Sci. 2002;33:1525–1539. doi: 10.1016/S0021-8502(02)00108-8. [DOI] [Google Scholar]
- 20.Gosman A. D., Ioannides E. Aspects of computer simulation of liquid-fueled combustors. J. Energy. 1983;7:482–490. doi: 10.2514/3.62687. [DOI] [Google Scholar]
- 21.Wolfshtein M. Velocity and temperature distribution in one-dimensional flow with turbulence augmentation and pressure gradient. Int. J. Heat Mass Transfer. 1969;12:301–318. doi: 10.1016/0017-9310(69)90012-X. [DOI] [Google Scholar]
- 22.Zhou Q., Leschziner M. A. An improved particle-locating algorithm for Eulerian–Lagrangian computations of two-phase flows in general coordinates. Int. J. Multiphase Flow. 1999;25:813–825. doi: 10.1016/S0301-9322(98)00045-7. [DOI] [Google Scholar]
- 23.Mendes P. J., Pinto J. F., Sousa J. M. M. Stochastic tracking and deposition of particles inside a complex geometry, European Conference on Computational Fluid Dynamics (ECCOMAS) Holland: Egmond ann Zee; 2006. [Google Scholar]
- 24.Jun Y.-D., Tabakoff W. Numerical simulation of a dilute particulate flow (laminar) over tube banks. J. Fluids Eng. 1994;116:770–777. doi: 10.1115/1.2911848. [DOI] [Google Scholar]
- 25.Rimai D. S., DeMejo L. P. Physical interactions affecting the adhesion of dry particles. Annu. Rev. Fluid Mech. 1996;26:21–41. [Google Scholar]
- 26.Li X., Wang T.-J., Jin Y. Granulation process for producing spherical particles of a rubber antioxidant in a water cooling tower. Chem. Eng. Tech. 2006;29:1273–1280. doi: 10.1002/ceat.200600023. [DOI] [Google Scholar]
- 27.Launder B. E., Spalding D. B. The numerical computation of turbulent flows. Comput. Method. Appl. Mech. 1974;3:269–289. doi: 10.1016/0045-7825(74)90029-2. [DOI] [Google Scholar]
- 28.Hofmann W., Balásházy I., Heistracher T. The relationship between secondary flows and particle deposition patterns in airway bifurcation. Aerosol Sci. Technol. 2001;35:958–968. doi: 10.1080/027868201753306723. [DOI] [Google Scholar]
- 29.Snyder W. H., Lumley J. L. Some measurements of particle velocity auto-correlation functions in a turbulent flow. J. Fluid Mech. 1971;48:41–71. doi: 10.1017/S0022112071001460. [DOI] [Google Scholar]
- 30.Wells M. R., Stock D. E. The effect of crossing trajectories on the dispersion of particles in a turbulent flow. J. Fluid Mech. 1983;136:31–62. doi: 10.1017/S0022112083002049. [DOI] [Google Scholar]
- 31.V. Mehrotra, G. D. Silcox, and P. J. Smith. Numerical simulation of turbulent particle dispersion using a Monte Carlo approach, ASME Fluids Engineering Division Summer Meeting, Washington, DC, 1998.
- 32.Mendes P. J., Raposo A., Sousa J. M. M., Pinto J. F. Sizing of powders in inhalers with aerosizer according to a mixed experimental factorial design. J. Aerosol Sci. 2004;35:509–527. doi: 10.1016/j.jaerosci.2003.10.005. [DOI] [Google Scholar]
- 33.Mendes P. J., Pinto J. F., Sousa J. M. M. A non-dimensional functional relationship for the fine particle fraction produced by dry powder inhalers. J. Aerosol Sci. 2007;38:612–624. doi: 10.1016/j.jaerosci.2007.04.001. [DOI] [Google Scholar]