

Abstract
Multiple myeloma (MM) is an incurable B-cell malignancy that arises in the bone marrow (BM). The malignant cells within the BM have extensive interaction with the structural components of their microenvironment. It has been previously shown that the interactions between MM cells and the BM extracellular matrix (ECM) proteins contribute to drug resistance. To understand the underlying causes of adhesion-mediated drug resistance in MM, the components of human BM ECM available for interactions with MM cells must be characterized. We analyzed the expression and localization of fibronectin, laminin, and collagens I and IV in the core biopsies of normal donors and patients with monoclonal gammopathy of undetermined significance (MGUS) or MM. In addition, we compared the patterns of ECM expression in MM patients with low-, mid-, and high-level plasmacytosis of the BM. Although expression of laminin was the same for all groups tested, levels of fibronectin and collagen I were reduced in MM patients with high-level plasmacytosis. Expression of collagen IV in the BM of MGUS and MM patients was higher than in the BM from normal donors. Compared with the plasma cells isolated from the patients with low- and mid-level plasmacytosis, sorted CD138+ plasma cells from MM patients with high-level plasmacytosis overexpressed collagen IV. Our findings show that, compared with normal controls, the ECM composition of the bone, endosteum, and BM is aberrant in patients with MM, further establishing ECM as a key player in the MM disease process. (J Histochem Cytochem 57:239–247, 2009)
Keywords: multiple myeloma, monoclonal gammopathy of undetermined significance, bone marrow microenvironment, extracellular matrix, fibronectin, laminin, collagen I, collagen IV, immunohistochemistry
Multiple myeloma (MM), an incurable B-lineage malignancy characterized by monoclonal plasma cells (PCs) in the bone marrow (BM), represents 1% of hematopoietic cancers and 19% of deaths from these malignancies. Despite the development of potent new therapies, the median survival remains 3–5 years (Greipp et al. 2005). Most MMs are characterized by the overproduction of monoclonal immunoglobulin (Eleutherakis-Papaiakovou et al. 2007), suppressed hematopoiesis (Oken et al. 1996; Ludwig et al. 2004), and lytic bone lesions (Bataille et al. 1997). Most MMs are thought to originate from a premalignant condition termed monoclonal gammopathy of undetermined significance (MGUS), with 10% of patients with MGUS progressing to MM (Lust and Donovan 1998; Tucci et al. 2003; Zojer et al. 2003; Landgren et al. 2006; Kyle and Rajkumar 2007).
As a site of hematopoiesis, BM has a complex organization with multiple cell types occupying distinct niches. A discrete extracellular matrix (ECM) microenvironment within the bone marrow helps to separate endosteum, an interface between bone and BM, from the central marrow. BM ECM, a proteinaceous matrix of mainly fibronectin, laminin, and collagens, is responsible for maintaining the BM architecture by providing a scaffold for the cellular compartments occupying the BM (Kibler et al. 1998; Gu et al. 2003). The ECM composition of the BM is crucial for normal tissue homeostasis, because the chemical treatment or irradiation of the stroma has been shown to lead to tumor formation in otherwise non-malignant epithelium (Barcellos-Hoff and Ravani 2000; Maffini et al. 2004).
The BM microenvironment can influence the therapeutic efficacy by conferring drug resistance (Vincent and Mechti 2005). Human myeloma and leukemia cell lines exhibited a drug-resistant phenotype when grown on fibronectin (Dalton et al. 2004; Hazlehurst et al. 2006) or in direct contact with BM stromal cells (Damiano et al. 1999; Nefedova et al. 2003; Schmidmaier et al. 2004). Interestingly, increased resistance to tumor necrosis-related apoptosis-inducing ligand–induced apoptosis was seen in MM cell lines directly attached to BM stomal cells but not when grown on fibronectin, suggesting that various components of the BM microenvironment confer resistance to different drugs, establishing a multidrug resistance phenotype (Damiano et al. 1999; Yanamandra et al. 2006). Expression of adhesion molecules was higher in patients receiving chemotherapy than in chemo-naïve patients, and their expression increased with additional chemotherapy rounds. In the same study, multidrug-resistant patients expressed higher levels of adhesion molecules than patients who responded to treatment (Schmidmaier et al. 2006). Cells grown in autologous ECM were shown to have an improved capacity to repair radiation-induced DNA lesions and to restore clonogenic capacity compared with cells grown on biologically unrelated ECM (Fuks et al. 1992), suggesting that the ECM composition may be crucial in maintaining the balance between drug-sensitivity and drug resistance that allows cells to repair drug-induced damage.
Hematopoietic progenitors cultured without stromal support proliferated significantly more than progenitors adherent to stroma, and proliferation of colony-forming cells was reduced after specific adhesion to stroma (Hurley et al. 1995), implying that stromal elements may maintain the their quiescence. Because essentially all MM patients ultimately relapse, drug-resistant cancer stem cells must escape current therapies (Pilarski et al. 2000,2002,2008; Reiman et al. 2001; Donnenberg and Donnenberg 2005). Similarly to BM-mediated quiescence of hematopoietic progenitors, it seems likely that microenvironment plays a central role in maintaining MM cancer stem cells in a quiescent state, perhaps delaying relapse or alternatively preserving the malignant clone throughout therapy. However, because adherent MM cells are drug resistant, new therapies are needed to combat adhesion-mediated drug-resistance. The combination of chemotherapy with peptides blocking cell adhesion to fibronectin holds promise for eradicating drug-resistant malignant cells in the BM of MM patients (Matsunaga et al. 2008).
Previous studies have detected tenascin, laminin, fibronectin, and collagen types I, III, V, and VI in the BM of MM patients (Kibler et al. 1998); however, no attempt has been made to evaluate the differences in the ECM expression between the normal, premalignant, and malignant conditions. To determine whether or not the BM ECM composition is aberrant in MM, we examined the expression of fibronectin, laminin, and collagens I and IV in BM from normal human donors and patients with MGUS or MM. Because of the skewed cellular composition of the BM in patients with MM (Kuehl and Bergsagel 2002), we hypothesized that the composition of the ECM would reflect these cellular aberrations. We show that fibronectin and collagens I and IV proteins had differential expression between normal, MGUS, and MM BM. In addition, the ECM expression in the BM samples from patients with MM was dependent on the degree of BM plasmacytosis, with a loss of expression of fibronectin and collagen I and an increase in expression of collagen IV corresponding to the increase in plasmacytosis. These data suggest that, in MM, malignant PCs overexpress collagen IV; this hypothesis was confirmed by real-time quantitative RT-PCR (RT-rqPCR) analysis.
Materials and Methods
Patients and Sample Processing
After approval from the Health Research Board (University of Alberta) and the Alberta Cancer Board, with informed consent in accordance with the Declaration of Helsinki, BM core biopsies and BM needle aspirate samples were obtained from patients undergoing BM biopsies at the Cross Cancer Institute. Sample populations were normal subjects, MGUS patients, and MM patients with low-, mid-, or high-grade plasmacytosis. BM core biopsies were EDTA decalcified and embedded in paraffin per standard protocol and were used for subsequent IHC studies. Mononuclear cells were isolated from BM aspirates by Ficoll-Paque gradient centrifugation per the manufacturer's instructions. CD138+ and CD138− BM cells were sorted on an EPICS ALTRA (Beckman Coulter; Mississauga, ON, Canada) based on the fluorescent staining with anti-CD138-PC5 (Beckman Coulter). Cell pellets were frozen in Trizol (Invitrogen; Burlington, ON, Canada), followed by RNA purification and RT-rqPCR analysis.
IHC
Paraffin blocks from five to six individual core biopsies per sample population group were sectioned using standard processing. Sections (5 μm) were stained for fibronectin, laminin, collagen I, and collagen IV expression using a standard avidin-biotin-peroxidase technique. Negative controls omitting primary antibodies were included to verify specificity of the staining. Mouse anti-fibronectin, laminin, collagen IV, and rabbit anti-collagen I antibodies were purchased from Millipore (Temecula, CA), and sample processing and staining were performed by the Department of Laboratory Medicine at the Cross Cancer Institute. The blinded slides were independently scored by two observers for the intensity of expression of fibronectin, laminin, collagen I, and collagen IV. There were no significant differences between the scores obtained by the individual observers. Imaging was done at ×400 magnification on a Zeiss Axiovision microscope (North York, ON, Canada) equipped with a color camera.
RT-rqPCR
RNA Isolation
Total RNA was isolated with TRIzol reagent per the manufacturer's instructions from CD138+ and CD138− sorted BM cells from three to six patients from each MM sample population.
cDNA Synthesis
RNA (1 μg) was mixed with 1 μl of 10 μM dT15 primer to a final volume of 12 μl in diethylpyrocarbonate–H2O. Samples were incubated at 70C to anneal the primers. After the above pre-RT step, 4 μl of 5× buffer, 2 μl of dithiothreitol, 1 μl of 10 mM dNTPs, and 1 μl of Superscript (Invitrogen) were added to each sample tube. RT cycle conditions were as follows: 42C for 60 min, 99C for 3 min, and 4C hold. cDNA was diluted at 1:10 in H2O for immediate PCR analysis or stored at −80C. All incubations and cycling were performed in the GeneAmp 9700 thermocycler (Applied Biosystems; Streetsville, ON, Canada).
rqPCR
The rqPCR step was performed using the SYBR green method using the DyNAmo HS SYBR Green qPCR kit (New England Biolabs; Pickering, ON, Canada) (Li et al. 2002) with product specificity confirmed by melting curve analysis (Thulien et al. 2006) per the manufacturer's instructions. In short, 1 μl of the 1:10 dilution of cDNA was mixed with 10 μl of SYBR green I master mix, 0.5 μl of 10 μM forward and reverse primers (Table 1), and 8.5 μl of H2O for a final volume of 20 μl. Fluorescence was acquired at each cycle on a DNA Agent Opticon 2 system (Bio-Rad; Hercules, CA) using the following cycling conditions: 94C for 2-min denaturation, 45 amplification cycles (94C for 30 sec, 60C for 30 sec, 72C for 30 sec), 72C for 10-min final annealing, and 4C hold. The c(t) values, analyzed using Opticon Monitor 3 software (Bio-Rad), corresponding to the number of cycles where the rqPCR curve crosses a threshold line set at the midpoint of the log fluorescence expansion, were normalized to GAPDH expression levels. The relative amounts of fibronectin and collagen IV mRNA expressed by each of the samples were reported as a percentage of GAPDH mRNA expression.
Table 1.
Sequences of primers used for real-time quantitative RT-PCR and PCR
| Primer sequence | |
|---|---|
| Fibronectina | |
| Forward | CCACCCCCATAAGGCATAGG |
| Reverse | GTAGGGGTCAAAGCACGAGTCATC |
| Collagen Ia | |
| Forward | ATGTCTAGGGTCTAGACATGTTCA |
| Reverse | CCTTGCCGTTGTCGCAGACG |
| Collagen IVa | |
| Forward | ATGGGGCCCCGGCTCAGC |
| Reverse | ATCCTCTTTCACCTTTCAATAGC |
| GAPDH | |
| Forward | CATGACAACTTTGGTATCGTGG |
| Reverse | CCTGCTTCACCACCTTCTTG |
| β2m | |
| Forward | TTGTTGGGAAGGTGGAAGCTCAT |
| Reverse | ACCCAGACACATAGCAATTCAGG |
Primer sequence from Bouterfa et al. (1999).
PCR
Total genomic DNA was isolated with TRIzol reagent per the manufacturer's instructions.
Each PCR reaction contained 250 ng of DNA, 19 μl of H2O, 2.5 μl of 10× buffer, 1.0 μl of MgCl2, 0.5 μl of dNTPs, 1.0 μl of 10 μM collagen I, and β2m forward and reverse primers (Table 1) and 0.1 μl of Taq polymerase. PCR conditions were as follows: 94C for 2-min denaturation, 35 amplification cycles (94C for 30 sec, 60C for 30 sec, 72C for 30 sec), 72C for 10-min final annealing, and 4C hold. Amplification products were resolved on a 1% agarose gel stained with ethidium bromide and evaluated by densitometry using an AlphaImager HP (AlphaInnotech; San Leandro, CA) system.
Statistical Analysis
Data are presented as mean ± SEM. Statistical significance was measured by Student's t-test, and Spearman correlation was calculated using Prism 4 software from GraphPad Software. Differences in the mean values are reported as p values, with p<0.05 considered significant.
Results
Expression and Localization of ECM Proteins in BM of Normal Donors, MGUS, and MM Patients
Expression of ECM proteins was analyzed by IHC using the sections of archived BM core biopsies from each sample group of normal, MGUS, and MM with low (<20%), mid (40–50%), and high (>80%) levels of plasmacytosis based on clinical assessment and confirmed by the CD138 IHC staining of the cores. CD138+ cells and aggregates of CD138+ cells were uniformly distributed thorough the entire length of the core. All of the core biopsies analyzed were collected before the initiation of treatment to avoid any changes in ECM proteins that may result from therapeutic interventions. Expression of the ECM proteins was uniform throughout the entire length of the BM core. Table 2 lists the clinical features of the samples used within each group.
Table 2.
Clinical parameters of the BM donors
| Diagnosis | PC infiltration (%) | Age (yr) | Sex | Light chain | Isotype | M-protein (g/liter) (diagnosis/at 1 year) | Responsea (at 1 year) |
|---|---|---|---|---|---|---|---|
| Normal | <5 | 52 | F | Polyclonal | Polyclonal | ND/ND | — |
| Normal | <5 | 64 | F | Polyclonal | Polyclonal | ND/ND | — |
| Normal | <5 | 74 | F | Polyclonal | Polyclonal | ND/ND | — |
| Normal | NA | 53 | F | Polyclonal | Polyclonal | ND/ND | — |
| Normal | 5–10 | 68 | M | Polyclonal | Polyclonal | ND/ND | — |
| MGUS | 5–10 | 78 | F | κ | IgG | 5/7.2 | MMb,c |
| MGUS | <5 | 73 | M | λ | IgG | ND/ND | — |
| MGUS | 5–10 | 62 | M | N/A | IgG | ND/ND | — |
| MGUS | <10 | 86 | M | κ | IgG | ND/ND | — |
| MGUS | 5–10 | 70 | F | κ | IgG | ND/ND | — |
| MGUS | 5 | 91 | M | κ | IgA | ND/ND | — |
| MM | 5–10 | 47 | F | κ | IgG | 39/4 | VGPRa,c |
| MM | NA | 77 | F | κ | Non-secretory | ND/ND | CRa |
| MM | 10–15 | 65 | F | λ | IgG | 18/16 | Smoldering |
| MM | 10–20 | 65 | M | NA | N/A | ND/ND | CRa |
| MM | 10–20 | 65 | F | λ | N/A | ND/ND | Smoldering |
| MM | 40 | 60 | M | λ | IgM | 3/27 | SDa,c |
| MM | 40 | 50 | M | κ | IgG | 54/88 | SDa,c |
| MM | 40 | 59 | M | κ | IgG | 42/14 | PRa,c,d |
| MM | 40–50 | 62 | M | κ | IgG | 63/41 | MRa,c |
| MM | 50 | 71 | M | λ | IgA | 44/23 | MRa,c |
| MM | 80 | 72 | M | κ | IgG | 53/25 | PRa,e |
| MM | 80 | 74 | M | λ | IgG | 42/8 | PRa,e |
| MM | 80–100 | 38 | F | λ | IgG | 55/15 | PRa,e |
| MM | 100 | 59 | M | λ | IgG | 29/ND | CRa,e |
| MM | 100 | 66 | M | λ | N/A | 6/1.6 | PRa,e |
Response categories based on the International Myeloma Working Group uniform response criteria (2006): CR, complete response (remission), no detectable M-protein, <5% PC in BM; VGPR, very good partial response, ≥90% reduction in M-protein; PR, partial response, ≥50% reduction in blood M-protein; MR, minimal response, ≥25% but <50% reduction in blood M-protein; SD, stable disease, increase in M-protein.
Patient was not on treatment before progression.
Patient on continued treatment at 1 year.
Patient deceased.
Patient not on treatment at 1 year.
BM, bone marrow; PC, plasma cells; MGUS, monoclonal gammopathy of undetermined significance; MM, multiple myeloma; NA, not available; ND, not detected.
IHC allowed the analysis of ECM in the bone/endosteum and in the central marrow of the BM biopsies (Figure 1). The entire length of the core was examined, and ECM expression was homogeneous throughout the core. Unlike mouse bone, which was previously shown to express high levels of both fibronectin and collagen I (Nilsson et al. 1998), human bone was positive only for collagen I (Figure 1). Levels of fibronectin in the central marrow were the same in the normal, MGUS, and MM with low-level plasmacytosis and were decreased in MM samples with mid- or high-level plasmacytosis (Figure 1A). There were no obvious differences in laminin expression between sample populations for the BM or for the bone/endosteum (Figure 1B). Similar to fibronectin expression, collagen I showed a decreasing staining intensity with increased levels of plasmacytosis. The normal, MGUS, and MM with low-level plasmacytosis showed very strong expression of collagen I, MM with mid-level plasmacytosis had strong, and MM with high-level plasmacytosis had moderate intensity of collagen I expression (Figure 1C). Finally, collagen IV had weak expression in the normal BM, with increased intensity of staining in MGUS and MM samples (Figure 1D). For all proteins analyzed, the expression levels of ECM proteins at the endosteum followed the same trend as for the BM but were slightly less intense (Figure 1). Table 3 summarizes the expression levels and spatial localization of the ECM proteins for the human BM, bone, and endosteum.
Figure 1.


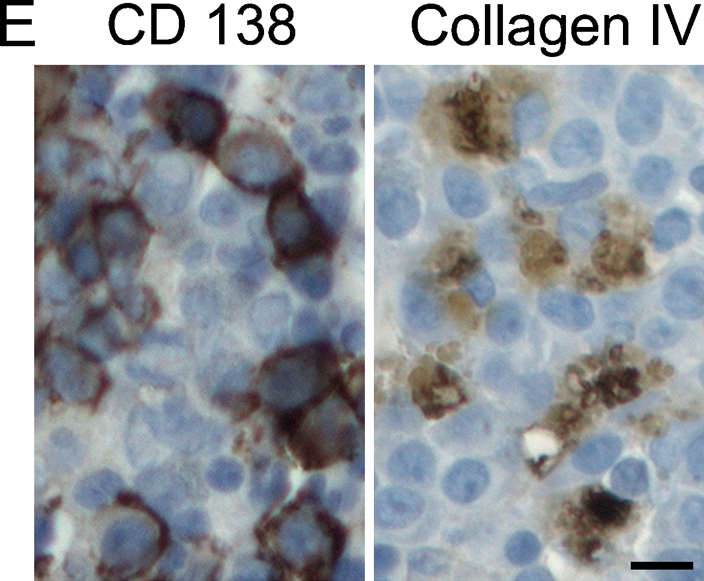
Expression of extracellular matrix (ECM) proteins in the human bone. IHC analysis of the core biopsy sections from normal donors (n=5) and patients with monoclonal gammopathy of undetermined significance (MGUS; n=6) and multiple myeloma (MM; n=5 for each of the low/mid/high plasmacytosis groups), showing the staining (brown) of bone marrow (BM), bone, and endosteum for (A) fibronectin, (B) laminin, (C) collagen I, and (D) collagen IV. The entire length of the core biopsy was examined, and images are shown from the representative field of view. (E) High-magnification staining of BM core biopsy serial sections. Bars: A–D = 200 μm; E = 10 μm.
Table 3.
Expression and spatial localization of the ECM proteins in human bonea
| Fibronectin
|
Laminin
|
Collagen I
|
Collagen IV
|
|||||||||
|---|---|---|---|---|---|---|---|---|---|---|---|---|
| BM | B | E | BM | B | E | BM | B | E | BM | B | E | |
| Normal | ++++ | − | +++ | + | − | + | ++++ | ++++ | +++ | + | − | + |
| MGUS | ++++ | − | +++ | + | − | + | ++++ | ++++ | +++ | +++ | − | ++ |
| MM (lowb) | ++++ | − | +++ | + | − | + | ++++ | ++++ | +++ | +++ | − | ++ |
| MM (midc) | ++ | − | +++ | + | − | + | +++ | ++++ | +++ | +++ | − | ++ |
| MM (highd) | ++ | − | ++ | + | − | + | ++ | ++++ | ++ | ++++ | − | +++ |
Scores were based on the expression of ECM proteins through the entire length of the core biopsy.
Low plasmacytosis (<20%).
Medium plasmacytosis (40–50%).
High plasmacytosis (>80%).
++++, very strong expression; +++, strong expression; ++, moderate expression; +, weak expression; −, negative.
ECM, extracellular matrix; BM, bone marrow; B, bone; E, endosteum; MGUS, monoclonal gammopathy of undetermined significance; MM, multiple myeloma.
Cellular Origin of ECM Proteins in the BM
To determine whether the malignant PCs contribute to changes in the expression of ECM proteins in the BM of patients with MM, we analyzed the expression of the fibronectin, collagen I, and collagen IV mRNA in sorted CD138+ and CD138− BM cells by RT-rqPCR. CD138, an antigen expressed on the surface of PCs, was used as a marker to separate the PC population from other compartments of the BM. Laminin was not included in the RT-rqPCR analysis because it was not differentially expressed in the BM of normal donors or MM patients. Because we wanted to determine whether the level of plasmacytosis affects the BM microenvironment, we restricted the evaluation of the mRNA levels of ECM proteins to MM patients. Normalized to GAPDH, there was no difference in the expression of fibronectin in CD138+ and CD138− cells among the MM sample groups (p>0.05; Figure 2A). This suggests that the differential expression of fibronectin seen in IHC between low- and mid-/high-level MM plasmacytosis may occur predominantly in the stroma. In contrast, collagen IV was overexpressed by the CD138+ cells in BM with mid- and high-level MM plasmacytosis (p<0.001) compared with the MM BM with low-level plasmacytosis (Figure 2B), implying that, as malignant PCs increase in number, they also acquire an increased capability to express collagen IV. There was no difference in the expression of collagen IV in the CD138− cells from any of the groups tested (p>0.05), providing an internal control for each patient. Figure 1E shows that a large fraction of CD138+ cells also expresses collagen IV, confirming the RT-qPCR analysis. Expression of collagen I mRNA was undetectable in either CD138+ or CD138− cells for all samples tested. Genomic collagen I was successfully amplified using the same set of primers (Figure 2C), providing a positive control for the assay. Thus, collagen I does not seem to be expressed in the hematopoietic compartment of the BM, suggesting it may be derived from stromal cells.
Figure 2.

Contribution of CD138+ cells to the expression of fibronectin and collagens I and IV in patients with MM. (A,B) Mononuclear cells from BM needle aspirates from patients with low- (n=6), mid- (n=5), and high- (n=3) grade plasmacytosis were sorted into CD138+ and CD138− lymphocyte populations and subjected to real-time quantitative RT-PCR analysis for (A) fibronectin (p>0.05) and (B) collagen IV (p<0.001 for mid/high grade MM compared with low grade). Results presented as percent of GAPDH mRNA expression. (C) Genomic collagen I was amplified from the mononuclear cells from BM needle aspirates (n=3, only Patients 1 and 2 are shown).
Discussion
MM remains incurable, and patients develop resistance to currently available drugs and drug combinations. To better understand the elements that contribute to adhesion-mediated drug resistance, we evaluated the composition of the microenvironment from normal donors, patients with MGUS, and fully developed MM. The patients with MM were further subdivided into three categories: low, mid, and high degrees of plasmacytosis. We found that normal human BM expresses high levels of fibronectin and collagen I and low levels of laminin and collagen IV. Our work showed that human BM differs from mouse BM, which expresses fibronectin, laminin, and collagen IV, but not collagen I (Nilsson et al. 1998). The only ECM protein expressed in the human bone was collagen I, whereas mouse bone was positive for both collagen I and fibronectin. The endosteal surface of human bone was composed of fibronectin and collagen I and to a lesser degree collagen IV and laminin. This pattern was very similar in the mouse. The similarities between the ECM composition of the endosteal surface between human and mouse bones suggest that this region may govern biological processes that are conserved between the species.
BM includes distinct niches, with hematopoietic progenitor cells (HPCs) found at the endosteal surface of the bone, more differentiated hematopoietic cells such as B cells and PCs in the central marrow, and the most differentiated cells localized furthest away from the endosteum (Lord et al. 1975; Calvi et al. 2003; Zhang et al. 2003; Kollet et al. 2006; Haylock et al. 2007). The contact between HPCs and osteoblastic cells expressing osteocalcin and N-cadherin is essential for the maintenance of the HPC niche (Calvi et al. 2003; Kollet et al. 2006); this interaction has been shown to maintain dormancy of normal HPCs (Kiel et al. 2005; Adams and Scadden 2006; Sugiyama et al. 2006; Wilson and Trumpp 2006). Therefore, disrupting the endosteal surface will disrupt the niche and may have dramatic affects on stem cell biology. However, disrupting the stem cell niche may be beneficial when trying to eliminate MM. In the ex vivo BM reconstructions, we localized putative MM cancer stem cells to an endosteal niche (Kirshner et al. 2008). Disrupting this niche may allow chemotherapeutic drugs to circumvent adhesion-mediated drug resistance of cancer stem cells. Thus, not only is the ECM crucial for maintaining the stem cell niche, it plays a central role in adhesion-mediated drug resistance and should be considered during the development of new therapeutics.
A variety of reports document that malignant cells attached to ECM are more drug resistant than cells grown without ECM support (Hazlehurst and Dalton 2001; Westhoff et al. 2008). Therefore, it is important to understand the ECM composition of the diseased tissue to evaluate potential mediators of drug resistance. It seems likely that most MM patients progressed through an early stage of monoclonal gammopathy (MGUS) that is clinically defined as non-malignant, although malignant changes have been identified in MGUS (Billadeau et al. 1996; Gutierrez et al. 2003; Martin-Jimenez et al. 2007). We found a dramatic increase in the expression of collagen IV in the BM of patients with MGUS compared with normal donors. Interestingly, we did not observe any differences between MGUS and MM characterized by low plasmacytosis, suggesting that an increase in the BM plasma cell infiltration >20% is needed to induce macroscopic affects on the BM ECM. However, we noted that the ECM composition of the BM changed in MM BM biopsies having a high level of plasmacytosis. The levels of fibronectin were decreased in mid compared with low plasmacytosis biopsies but remained at the moderate level of expression even in MM biopsies with high-level plasmacytosis. A similar pattern was seen for collagen I but with a further decrease in MM with high plasmacytosis. The extent to which these patterns are dependent on the location at which the biopsy is taken or alternatively reflect more systemic distributions remains to be determined, as does the extent to which ECM distribution patterns correlate with response to treatment.
Stomal compartments of the BM are normally responsible for secreting the ECM (Zuckerman and Wicha 1983); however, other cellular compartments may be directly or indirectly involved in this process. Non-stromal compartments may secrete ECM protein or may modulate the composition of the ECM though signaling, resulting in an increase or a decrease in the production of ECM components by the stroma. Here we assessed the contribution of the malignant PCs to the aberrant expression of fibronectin and collagens I and IV in the BM of MM patients. After normalization to GAPDH, collagen IV was overexpressed in CD138+ cells in the MM patients with mid/high plasmacytosis compared with the CD138+ cells from the patients with a low number of PCs in the BM. It is possible that the interaction between PCs in the mid-/high-grade BMs creates a feedback loop with more collagen IV produced by the PCs, which are in contact with other PCs. Like collagen IV, fibronectin was expressed by both CD138+ and CD138− cells, but its levels did not change with the degree of plasmacytosis. Interestingly, in long-term BM cultures, stromal cells, but not hematopoietic cells, secreted fibronectin (Reincke et al. 1982). This emphasizes the need to evaluate the tissue microenvironment in vivo, and not in culture, because cellular phenotypes change once a cell is taken out of its physiological context. Taken together, our results show that the ECM composition of the BM in patients with MM differs from that of patients with MGUS and normal donors.
Acknowledgments
This work was funded by grants from the Canadian Institutes of Health Research and the Alberta Cancer Board Research Initiatives Program. J.K. was funded by a fellowship award from the Alberta Heritage Foundation for Medical Research. L.M.P. is the Canada Research Chair in Biomedical Nanotechnology, and this work was funded in part by the Chairs program.
We thank the members of the Department of Laboratory Medicine at the Cross Cancer Institute for their technical expertise and assistance in IHC.
The authors declare that they have no competing financial interests.
References
- Adams GB, Scadden DT (2006) The hematopoietic stem cell in its place. Nat Immunol 7:333–337 [DOI] [PubMed] [Google Scholar]
- Barcellos-Hoff MH, Ravani SA (2000) Irradiated mammary gland stroma promotes the expression of tumorigenic potential by unirradiated epithelial cells. Cancer Res 60:1254–1260 [PubMed] [Google Scholar]
- Bataille R, Manolagas SC, Berenson JR (1997) Pathogenesis and management of bone lesions in multiple myeloma. Hematol Oncol Clin North Am 11:349–361 [DOI] [PubMed] [Google Scholar]
- Billadeau D, Van Ness B, Kimlinger T, Kyle RA, Therneau TM, Greipp PR, Witzig TE (1996) Clonal circulating cells are common in plasma cell proliferative disorders: a comparison of monoclonal gammopathy of undetermined significance, smoldering multiple myeloma, and active myeloma. Blood 88:289–296 [PubMed] [Google Scholar]
- Bouterfa H, Darlapp AR, Klein E, Pietsch T, Roosen K, Tonn JC (1999) Expression of different extracellular matrix components in human brain tumor and melanoma cells in respect to variant culture conditions. J Neurooncol 44:23–33 [DOI] [PubMed] [Google Scholar]
- Calvi LM, Adams GB, Weibrecht KW, Weber JM, Olson DP, Knight MC, Martin RP, et al. (2003) Osteoblastic cells regulate the haematopoietic stem cell niche. Nature 425:841–846 [DOI] [PubMed] [Google Scholar]
- Dalton WS, Hazlehurst L, Shain K, Landowski T, Alsina M (2004) Targeting the bone marrow microenvironment in hematologic malignancies. Semin Hematol 41:1–5 [DOI] [PubMed] [Google Scholar]
- Damiano JS, Cress AE, Hazlehurst LA, Shtil AA, Dalton WS (1999) Cell adhesion mediated drug resistance (CAM-DR): role of integrins and resistance to apoptosis in human myeloma cell lines. Blood 93:1658–1667 [PMC free article] [PubMed] [Google Scholar]
- Donnenberg VS, Donnenberg AD (2005) Multiple drug resistance in cancer revisited: the cancer stem cell hypothesis. J Clin Pharmacol 45:872–877 [DOI] [PubMed] [Google Scholar]
- Eleutherakis-Papaiakovou V, Bamias A, Gika D, Simeonidis A, Pouli A, Anagnostopoulos A, Michali E, et al. (2007) Renal failure in multiple myeloma: incidence, correlations, and prognostic significance. Leuk Lymphoma 48:337–341 [DOI] [PubMed] [Google Scholar]
- Fuks Z, Vlodavsky I, Andreeff M, Mcloughlin M, Haimovitz-Friedman A (1992) Effects of extracellular matrix on the response of endothelial cells to radiation in vitro. Eur J Cancer 28A:725–731 [DOI] [PubMed] [Google Scholar]
- Greipp PR, San Miguel J, Durie BG, Crowley JJ, Barlogie B, Blade J, Boccadoro M, et al. (2005) International staging system for multiple myeloma. J Clin Oncol 23:3412–3420 [DOI] [PubMed] [Google Scholar]
- Gu YC, Kortesmaa J, Tryggvason K, Persson J, Ekblom P, Jacobsen SE, Ekblom M (2003) Laminin isoform-specific promotion of adhesion and migration of human bone marrow progenitor cells. Blood 101:877–885 [DOI] [PubMed] [Google Scholar]
- Gutierrez NC, Camps J, Hernandez JM, Garcia JL, Prat E, Gonzalez MB, Miro R, et al. (2003) Multicolor fluorescence in situ hybridization studies in multiple myeloma and monoclonal gammopathy of undetermined significance. Hematol J 4:67–70 [DOI] [PubMed] [Google Scholar]
- Haylock DN, Williams B, Johnston HM, Liu MC, Rutherford KE, Whitty GA, Simmons PJ, et al. (2007) Hemopoietic stem cells with higher hemopoietic potential reside at the bone marrow endosteum. Stem Cells 25:1062–1069 [DOI] [PubMed] [Google Scholar]
- Hazlehurst LA, Argilagos RF, Emmons M, Boulware D, Beam CA, Sullivan DM, Dalton WS (2006) Cell adhesion to fibronectin (CAM-DR) influences acquired mitoxantrone resistance in U937 cells. Cancer Res 66:2338–2345 [DOI] [PubMed] [Google Scholar]
- Hazlehurst LA, Dalton WS (2001) Mechanisms associated with cell adhesion mediated drug resistance (CAM-DR) in hematopoietic malignancies. Cancer Metastasis Rev 20:43–50 [DOI] [PubMed] [Google Scholar]
- Hurley RW, Mccarthy JB, Verfaillie CM (1995) Direct adhesion to bone marrow stroma via fibronectin receptors inhibits hematopoietic progenitor proliferation. J Clin Invest 96:511–519 [DOI] [PMC free article] [PubMed] [Google Scholar]
- Kibler C, Schermutzki F, Waller HD, Timpl R, Muller CA, Klein G (1998) Adhesive interactions of human multiple myeloma cell lines with different extracellular matrix molecules. Cell Adhes Commun 5:307–323 [DOI] [PubMed] [Google Scholar]
- Kiel MJ, Yilmaz OH, Iwashita T, Yilmaz OH, Terhorst C, Morrison SJ (2005) SLAM family receptors distinguish hematopoietic stem and progenitor cells and reveal endothelial niches for stem cells. Cell 121:1109–1121 [DOI] [PubMed] [Google Scholar]
- Kirshner J, Thulien KJ, Martin LD, Debes Marun C, Reiman T, Belch AR, Pilarski LM (2008) A unique three-dimensional model for evaluating the impact of therapy on multiple myeloma. Blood 112:2935–2945 [DOI] [PubMed] [Google Scholar]
- Kollet O, Dar A, Shivtiel S, Kalinkovich A, Lapid K, Sztainberg Y, Tesio M, et al. (2006) Osteoclasts degrade endosteal components and promote mobilization of hematopoietic progenitor cells. Nat Med 12:657–664 [DOI] [PubMed] [Google Scholar]
- Kuehl WM, Bergsagel PL (2002) Multiple myeloma: evolving genetic events and host interactions. Nat Rev Cancer 2:175–187 [DOI] [PubMed] [Google Scholar]
- Kyle RA, Rajkumar SV (2007) Monoclonal gammopathy of undetermined significance and smouldering multiple myeloma: emphasis on risk factors for progression. Br J Haematol 139:730–743 [DOI] [PubMed] [Google Scholar]
- Landgren O, Gridley G, Turesson I, Caporaso NE, Goldin LR, Baris D, Fears TR, et al. (2006) Risk of monoclonal gammopathy of undetermined significance (MGUS) and subsequent multiple myeloma among African American and white veterans in the United States. Blood 107:904–906 [DOI] [PMC free article] [PubMed] [Google Scholar]
- Li AH, Forestier E, Rosenquist R, Roos G (2002) Minimal residual disease quantification in childhood acute lymphoblastic leukemia by real-time polymerase chain reaction using the SYBR green dye. Exp Hematol 30:1170–1177 [DOI] [PubMed] [Google Scholar]
- Lord BI, Testa NG, Hendry JH (1975) The relative spatial distributions of CFUs and CFUc in the normal mouse femur. Blood 46:65–72 [PubMed] [Google Scholar]
- Ludwig H, Pohl G, Osterborg A (2004) Anemia in multiple myeloma. Clin Adv Hematol Oncol 2:233–241 [PubMed] [Google Scholar]
- Lust JA, Donovan KA (1998) Biology of the transition of monoclonal gammopathy of undetermined significance (MGUS) to multiple myeloma. Cancer Control 5:209–217 [DOI] [PubMed] [Google Scholar]
- Maffini MV, Soto AM, Calabro JM, Ucci AA, Sonnenschein C (2004) The stroma as a crucial target in rat mammary gland carcinogenesis. J Cell Sci 117:1495–1502 [DOI] [PubMed] [Google Scholar]
- Martin-Jimenez P, Garcia-Sanz R, Balanzategui A, Alcoceba M, Ocio E, Sanchez ML, Gonzalez M, et al. (2007) Molecular characterization of heavy chain immunoglobulin gene rearrangements in Waldenstrom's macroglobulinemia and IgM monoclonal gammopathy of undetermined significance. Haematologica 92:635–642 [DOI] [PubMed] [Google Scholar]
- Matsunaga T, Fukai F, Miura S, Nakane Y, Owaki T, Kodama H, Tanaka M, et al. (2008) Combination therapy of an anticancer drug with the FNIII14 peptide of fibronectin effectively overcomes cell adhesion-mediated drug resistance of acute myelogenous leukemia. Leukemia 22:353–360 [DOI] [PubMed] [Google Scholar]
- Nefedova Y, Landowski TH, Dalton WS (2003) Bone marrow stromal-derived soluble factors and direct cell contact contribute to de novo drug resistance of myeloma cells by distinct mechanisms. Leukemia 17:1175–1182 [DOI] [PubMed] [Google Scholar]
- Nilsson SK, Debatis ME, Dooner MS, Madri JA, Quesenberry PJ, Becker PS (1998) Immunofluorescence characterization of key extracellular matrix proteins in murine bone marrow in situ. J Histochem Cytochem 46:371–377 [DOI] [PubMed] [Google Scholar]
- Oken MM, Pomeroy C, Weisdorf D, Bennett JM (1996) Prophylactic antibiotics for the prevention of early infection in multiple myeloma. Am J Med 100:624–628 [DOI] [PubMed] [Google Scholar]
- Pilarski LM, Baigorri E, Mant MJ, Pilarski PM, Adamson P, Zola H, Belch AR (2008) Multiple myeloma includes phenotypically defined subsets of clonotypic CD20+ B cells that persist during treatment with rituximab. Oncology 2:275–287 [DOI] [PMC free article] [PubMed] [Google Scholar]
- Pilarski LM, Hipperson G, Seeberger K, Pruski E, Coupland RW, Belch AR (2000) Myeloma progenitors in the blood of patients with aggressive or minimal disease: engraftment and self-renewal of primary human myeloma in the bone marrow of NOD SCID mice. Blood 95:1056–1065 [PubMed] [Google Scholar]
- Pilarski LM, Seeberger K, Coupland RW, Eshpeter A, Keats JJ, Taylor BJ, Belch AR (2002) Leukemic B cells clonally identical to myeloma plasma cells are myelomagenic in NOD/SCID mice. Exp Hematol 30:221–228 [DOI] [PubMed] [Google Scholar]
- Reiman T, Seeberger K, Taylor BJ, Szczepek AJ, Hanson J, Mant MJ, Coupland RW, et al. (2001) Persistent preswitch clonotypic myeloma cells correlate with decreased survival: evidence for isotype switching within the myeloma clone. Blood 98:2791–2799 [DOI] [PubMed] [Google Scholar]
- Reincke U, Hsieh P, Mauch P, Hellman S, Chen LB (1982) Cell types associated with fibronectin in long-term mouse bone marrow cultures. J Histochem Cytochem 30:235–244 [DOI] [PubMed] [Google Scholar]
- Schmidmaier R, Baumann P, Simsek M, Dayyani F, Emmerich B, Meinhardt G (2004) The HMG-CoA reductase inhibitor simvastatin overcomes cell adhesion-mediated drug resistance in multiple myeloma by geranylgeranylation of Rho protein and activation of Rho kinase. Blood 104:1825–1832 [DOI] [PubMed] [Google Scholar]
- Schmidmaier R, Morsdorf K, Baumann P, Emmerich B, Meinhardt G (2006) Evidence for cell adhesion-mediated drug resistance of multiple myeloma cells in vivo. Int J Biol Markers 21:218–222 [DOI] [PubMed] [Google Scholar]
- Sugiyama T, Kohara H, Noda M, Nagasawa T (2006) Maintenance of the hematopoietic stem cell pool by CXCL12-CXCR4 chemokine signaling in bone marrow stromal cell niches. Immunity 25:977–988 [DOI] [PubMed] [Google Scholar]
- Thulien KJ, Reiman T, Belch AR, Booth J, Pilarski LM (2006) Quantitative detection using SYBR green of residual disease in myeloma patients treated with Revlimid or Velcade. Blood 108:5102 [Google Scholar]
- Tucci A, Bonadonna S, Cattaneo C, Ungari M, Giustina A, Guiseppe R (2003) Transformation of a MGUS to overt multiple myeloma: the possible role of a pituitary macroadenoma secreting high levels of insulin-like growth factor 1 (IGF-1). Leuk Lymphoma 44:543–545 [DOI] [PubMed] [Google Scholar]
- Vincent T, Mechti N (2005) Extracellular matrix in bone marrow can mediate drug resistance in myeloma. Leuk Lymphoma 46:803–811 [DOI] [PubMed] [Google Scholar]
- Westhoff MA, Zhou S, Bachem MG, Debatin KM, Fulda S (2008) Identification of a novel switch in the dominant forms of cell adhesion-mediated drug resistance in glioblastoma cells. Oncogene 27:5169–5181 [DOI] [PubMed] [Google Scholar]
- Wilson A, Trumpp A (2006) Bone-marrow haematopoietic-stem-cell niches. Nat Rev Immunol 6:93–106 [DOI] [PubMed] [Google Scholar]
- Yanamandra N, Colaco NM, Parquet NA, Buzzeo RW, Boulware D, Wright G, Perez LE, et al. (2006) Tipifarnib and bortezomib are synergistic and overcome cell adhesion-mediated drug resistance in multiple myeloma and acute myeloid leukemia. Clin Cancer Res 12:591–599 [DOI] [PubMed] [Google Scholar]
- Zhang J, Niu C, Ye L, Huang H, He X, Tong WG, Ross J, et al. (2003) Identification of the haematopoietic stem cell niche and control of the niche size. Nature 425:836–841 [DOI] [PubMed] [Google Scholar]
- Zojer N, Ludwig H, Fiegl M, Stevenson FK, Sahota SS (2003) Patterns of somatic mutations in VH genes reveal pathways of clonal transformation from MGUS to multiple myeloma. Blood 101:4137–4139 [DOI] [PubMed] [Google Scholar]
- Zuckerman KS, Wicha MS (1983) Extracellular matrix production by the adherent cells of long-term murine bone marrow cultures. Blood 61:540–547 [PubMed] [Google Scholar]