

Abstract
Human bronchial epithelial (HBE) cells exhibit constitutive anion secretion that is absent in cells from cystic fibrosis (CF) patients. The identity of this conductance is unknown, but SLC26A9, a member of the SLC26 family of CF transmembrane conductance regulator (CFTR)-interacting transporters, is found in the human airway and exhibits chloride channel behavior. We sought differences in the properties of SLC26A9 and CFTR expressed in HEK 293 (HEK) cells as a fingerprint to identify HBE apical anion conductances. HEK cells expressing SLC26A9 displayed a constitutive chloride current that was inhibited by the CFTR blocker GlyH-101 (71 ± 4%, 50 µM) and exhibited a near-linear current–voltage (I-V) relation during block, while GlyH-101–inhibited wild-type (wt)CFTR exhibited a strong inward-rectified (IR) I-V relation. We tested polarized HBE cells endogenously expressing either wt or ΔF508-CFTR for similar activity. After electrical isolation of the apical membrane using basolateral α-toxin permeabilization, wtCFTR monolayers displayed constitutive chloride currents that were inhibited by GlyH-101 (68 ± 6%) while maintaining a near-linear I-V relation. In the absence of blocker, the addition of forskolin stimulated a current increase having a linear I-V; GlyH-101 blocked 69 ± 7% of the current and shifted the I-V relation IR, consistent with CFTR activation. HEK cells coexpressing SLC26A9 and wtCFTR displayed similar properties, as well as forskolin-stimulated currents that exceeded the sum of those in cells separately expressing SLC26A9 or wtCFTR, and an I-V relation during GlyH-101 inhibition that was moderately IR, indicating that SLC26A9 contributed to the stimulated current. HBE cells from CF patients expressed SLC26A9 mRNA, but no constitutive chloride currents. HEK cells coexpressing SLC26A9 with ΔF508-CFTR also failed to exhibit SLC26A9 current. We conclude that SLC26A9 functions as an anion conductance in the apical membranes of HBE cells, it contributes to transepithelial chloride currents under basal and cAMP/protein kinase A–stimulated conditions, and its activity in HBE cells requires functional CFTR.
INTRODUCTION
Airway surface liquid (ASL) composition and volume are tightly regulated to maintain mucociliary clearance and healthy lung function. Contributions to the ASL composition and thickness come from both surface epithelia and submucosal glands, with the glands thought to be the predominant source of secreted fluid and peptides for innate defense (Wang et al., 2001; Wine, 2006). Electrolyte transport across the surface epithelium, together with accompanying osmotic water flow, determines the height of the ASL (Tarran et al., 2001), and this in turn determines the efficiency of mucociliary clearance. Several recent studies have implicated basal or constitutive CFTR activity in calcium-mediated gland secretion (Song et al., 2006; Ishibashi et al., 2008), modulation of ASL pH (Song et al., 2006), and surface epithelial electrolyte transport (Wang et al., 2005).
Evidence for constitutive activity of CFTR in airway epithelia has a long history: Smith and Welsh (1992) noted a substantial baseline (non-cAMP–stimulated) apical anion efflux in their studies to evaluate the bicarbonate permeability of CFTR. Since then, constitutive currents have been noted in human bronchial (Coakley et al., 2003) and nasal (Paradiso et al., 2003) epithelial cultures, as well as the serous cell model of Calu-3 cells (Krouse et al., 2004). These studies attributed the basal chloride currents to constitutive CFTR activity, due primarily to their absence in cystic fibrosis (CF) epithelia.
After the discovery of the higher specificity CFTR channel blockers CFI172 and GlyH-101 (Ma et al., 2002; Muanprasat et al., 2004), several studies have confirmed that basal chloride currents were sensitive to these agents, reinforcing the hypothesis of constitutive CFTR activity. In addition, a role for basal anion secretion in maintaining the ASL pH was proposed by Song et al. (2006) because the unstimulated tracheal surface epithelium was able to alkalinize acidic droplets, and the specific CFTR channel blockers CFI-172 and GlyH-101 inhibited this alkalization. Interestingly, the alkalization was not improved with forskolin stimulation. In the same study, porcine and human submucosal gland secretions stimulated with pilocarpine were significantly acidified when treated with CFTR inhibitors. Porcine small airways also displayed constitutive chloride conductances that were GlyH-101 inhibited (Wang et al., 2005); therefore, the sensitivity of constitutive chloride secretion to specific CFTR inhibitors and its absence in CF airways has led to the hypothesis of constitutive CFTR activity. However, the absence of a consistent model for this regulatory mode of CFTR and the role of CFTR as a regulator of other transport pathways (Schwiebert et al., 1999) suggest that another anion channel may contribute to constitutive secretion across airway epithelia.
Ko et al. (2004) identified two electrogenic members of the SLC26 family, SLC26A3 and SLC26A6, which interact with CFTR when expressed in oocytes and HEK 293 cells. This has led to a model of reciprocal regulation mediated by a physical interaction between the R domain of CFTR and the STAS domain of the SLC26A family of anion transporters (Dorwart et al., 2008). The PDZ domains of these proteins are also believed to tether the transporters in close proximity. Coexpression of the STAS domain alone with CFTR increased its open probability, and, in a reciprocal manner, coexpression of CFTR with SLC26A3 increased its HCO3-Cl exchange activity. Although electrogenic, these exchangers did not generate measurable Cl− current when they were expressed in HEK 293 cells, not an uncommon finding for the low turnover rates found in exchange transporters (Hille, 2001).
The identification of the lung-specific SLC26A9 (Lohi et al., 2002) suggests a potential mechanism for airway anion transport that may be coordinated with the activity of CFTR, based on the model above. The behavior of SLC26A9 alone has been reported by two groups. Xu et al. (2005) stably expressed SLC26A9 in HEK 293 cells and observed Cl−/HCO3− exchange activity, with some Cl−-independent HCO3− efflux. In contrast, Dorwart et al. (2007) transiently expressed SLC26A9 in oocytes and HEK 293 cells and reported large Cl− currents consistent with channel behavior, but minimal HCO3− permeability. These results seem divergent, but Romero et al. (2006) has suggested a model of SLC26A9 having both Cl− channel and electrogenic exchange activities, based on preliminary observations in oocytes. The possibility that SLC26A9 is a CFTR-regulated chloride channel raises several significant questions: Does SLC26A9 contribute to basal and/or cAMP/PKA-stimulated anion currents in airway epithelia? Is it sensitive to CFTR inhibitors? Does its activity depend on functional CFTR? In the studies reported here, we used the HEK 293 expression system and human bronchial epithelial (HBE) cells from both non-CF and CF donors to address these questions.
MATERIALS AND METHODS
Cell culture
HEK 293 cells were propagated in Falcon culture flasks (75 cm2) in a humidified atmosphere of 95% air, 5% CO2 at 37°C. The cells were fed twice per week with Dulbecco's modified Eagle's medium supplemented with 10% heat-inactivated fetal bovine serum and 2 mM l-glutamine. Cells were removed from flasks after treatment with TrypLE Express and aliquoted into 6-well plates at high density to achieve 98% confluence within 24 h, per the standard Lipofectamine 2000 transfection protocol (Invitrogen; see below). Transfection media were replaced with normal media after 14 h, and transfected cells were removed from the 6-well plates after 24 h and plated to glass coverslips to be used for patch clamping within 18–36 h. Both the 6-well plates and the glass coverslips were coated with poly-l-lysine to promote cell adhesion. All cell culture medium was obtained from Invitrogen.
HBE cells were cultured from excess pathological tissue after lung transplantation and organ donation under a protocol approved by the University of Pittsburgh Investigational Review Board, as described previously (Devor and Pilewski, 1999). In brief, cells were propagated in flasks to 80–90% confluency, and then transferred to 0.33-cm2 Costar Transwell filters. Apical media were removed 24 h after seeding, and the filters were grown at an air–liquid interface thereafter. Basolateral media were changed twice weekly. Three different wild-type (wt)CFTR patient samples were used for short circuit current measurements, and the CF HBE cells used were obtained from patients with severe disease and were at least heterozygous for the ΔF508 CF mutation. Filters that had been grown at an air–liquid interface for at least 2 wk before testing demonstrated active cilia.
Constructs and transfections
HEK 293 cells were transiently transfected 24 h after plating with either SLC26A9 or CFTR, or both. SLC26A9 expressed in a pcDNA 3.1 vector was provided by S. Muallem (University of Texas Southwestern Medical Center, Dallas, TX), and the entire construct was sequenced to verify that it corresponded to the published 4,815-bp isoform (Lohi et al., 2002) of human SLC26A9 (NM_052934). SLC26A9 with a myc epitope at the N terminus was prepared by excising the cDNA encoding SLC26A9 from pcDNA 3.1 and cloning it into a pcDNA 3 Myc vector (Invitrogen). Both wt and ΔF508 CFTR expressed in pcDNA3.1 vectors were as described previously (Sun et al., 2008). pMAX green fluorescent protein (GFP; Amaxa) was used in all transfections to balance total cDNA and identify transfected cells. Transfections were performed using the standard Lipofectamine 2000 protocol (Invitrogen), with 2 µg of total cDNA and 6 µl Lipofectamine 2000 in 2 ml Optimem per well of a 6-well plate. Quantities of cDNA typically used were 0.5 µg for SLC26A9, 1.0 µg for CFTR, and sufficient pMax GFP to bring the total cDNA per transfection to 2.0 µg.
Several preliminary concentrations of SLC26A9 cDNA alone and in combination with 1 µg CFTR cDNA were tested in HEK 293 cells to obtain readily measurable currents for either channel at the lowest cDNA dose. Increasing the quantity of SLC26A9 cDNA from 0.1 to 2.0 µg increased the magnitude of the constitutive (basal) currents (not depicted); doses higher than the 0.5 µg used, when coexpressed with CFTR, produced reductions in membrane resistance (Rm) during forskolin stimulation to levels (<10 times the pipette access resistance) that may compromise voltage clamping (see below).
Reverse transcriptase (RT)-PCR and immunoprecipitation (IP)
Total RNA was isolated from either HEK 293 cells grown in T25 flasks within 36–48 h after transfection, or from HBE cells grown on filter supports at air–liquid interface for at least 2 wk, using the RNAqueous-4PCR kit (Applied Biosystems). HEK cells were dissociated from the flask after a 5-min exposure to TrypLE Express, pelleted, and then processed according to the manufacturer's instructions. For HBE filters, monolayers were rinsed with 37°C PBS (calcium and magnesium-free) and incubated with fresh PBS on both the apical and basolateral sides for 5 min to disrupt the tight junctions. After aspiration of the apical PBS, 0.25% trypsin EDTA (Invitrogen) was added, and monolayers were incubated for 15 min at 37°C. Cells were extracted from the filter with vigorous pipetting, pelleted, and then processed according to the kit protocol. Three filters were dissociated per sample. Isolated RNA was DNase treated and then stored at −80°C.
Two-step RT-PCR was performed using a RETROscript kit (Applied Biosystems). For generation of cDNA, ∼2 µg of the previously harvested total RNA was reverse transcribed using Oligo(dT) primers at an incubation temperature of 42°C, per the manufacturer's instructions. The resulting cDNA was stored at −20°C until PCR was performed. Both total RNA and cDNA were used within 1 mo of harvesting and reverse transcription, respectively.
The PCR steps were performed with the following primers: 5′-GAGCAGAGCCCTTTCACACACCTCAGG-3′ and 5′-GCCTATCATGTCCTTCCACTGTGAGACCAC-3′ for SLC26A9; 5′-AGGAGGCAGTCTGTCCTGAA-3′ and 5′-CACTGCTGGTATGCTCTCCA-3′ for CFTR; and a commercial RT-PCR primer kit to detect human β-actin (Invitrogen) as a control. The SLC26A9 primers cover the region corresponding to both sets of primers used by Lohi et al. (2002) and include both the 5′ UTR and the N-terminal coding region of the mRNA; they amplify an 1,100-bp product. The CFTR primers amplify a 237-bp product, and the β-actin primers identify a 353-bp product. The PCR reaction was performed according to the RETROscript kit protocol with an annealing temp of 55°C for both CFTR and β-actin, and 62°C for SLC26A9. A Robocycler with a temperature gradient block was used to perform all the reactions simultaneously using two separate annealing temperatures. 35 cycles were run.
For coimmunoprecipitation studies, HEK 293 cells were transiently transfected with wtCFTR ± Myc-SLC26A9. After 48 h, cells were briefly treated with 10 µM forskolin, and then lysed (150 mM NaCl, 50 mM HEPES, pH 8.0, 1% Nonidet P-40, 1 mM EDTA, 10% glycerol, and protease inhibitors). After disruption of the cells, 500 µg of total proteins was subjected to IP with an anti-Myc monoclonal antibody (University of Iowa Hybridoma Center), as described previously (Sun et al., 2008). Precipitates were resolved by SDS-PAGE, and immunoblots were performed using anti-CFTR antibody (no. 217; Cystic Fibrosis Foundation Therapeutics, http://www.cftrfolding.org/CFFTReagents.htm).
Whole cell patch clamping
All whole cell patch clamping was performed using a 200B Axopatch amplifier controlled by Clampex 8.1 software through a Digidata 1322A acquisition board (all from MDS Analytical Technologies). Bath solutions containing the different blockers and/or stimulants to be applied were distributed among eight separate reservoirs of a Valvelink 8 pressurized perfusion system (Automate Scientific). Reservoir selection was also controlled by the Clampex 8.1 software to ensure consistent timing for all experiments. The output line from the perfusion system was run through a heated, circulating water bath and applied to the imaging chamber at 2.0 ml/m and 37°C. The delay between valve selection and appearance of the solution at the 300-µl chamber was 20 s.
The imaging chamber was mounted on the stage of a Nikon Diaphot microscope equipped with standard illumination and a 150-W Xenon lamp and GFP filter cube (Ex 485/Em 550). The fluorescent light source was applied with a manual shutter to permit selection of GFP-labeled cells viewed through a 40× objective. Once a cell was selected, the shutter was closed and the remainder of the experiment was performed under standard (transmitted light) illumination. The cells selected displayed a consistent shape and fluorescence intensity, as suggested in published guidelines for use of the HEK 293 expression system (Thomas and Smart, 2005). Seal formation was monitored using the seal test mode of Clampex. Seal resistances exceeded 8 GΩ, and pipette capacitance was compensated. After rupture of the seal membrane, whole cell parameters were verified using the membrane test mode of Clampex before the start of each experiment.
All experiments used a standard protocol that alternated an I-V step measurement with a voltage clamp interval at a holding potential of −40 mV. The I-V measurement stepped the holding potential from −100 to +100 mV in 20-mV steps, 206 samples per step at a 50-µs sampling interval for a total measurement time of 120 ms. The voltage clamp measurements were collected at 200-µs intervals, and both measurements were filtered at 1 KHz through the Axopatch amplifier filter. Each experiment started with a 60-s drug-free voltage clamp to ensure the cells were stable. After this interval, all protocols alternated I-V measurements with 90-s voltage clamp intervals. Single-drug protocols applied drug for 3 min, followed by a 3-min washout period for a total protocol of 7 min, while two-drug protocols included a second 3-min drug application for a total protocol of 10 min. The alternating measurements were automated using the sequence key function in Clampex to minimize gaps.
NMDG-Cl was used for both the bath and pipette solutions to isolate chloride currents. The osmolarity of both solutions was measured, and NMDG glutamate was added to the bath solution (in mM: 140 NMDG-Cl, 10 HEPES, 1 MgCl2, 1.5 CaCl2, and 5 glucose, to pH 7.3 with Tris) to generate a 25-mOsm gradient that obviated cell swelling (Worrell et al., 1989). The pipette solution (in mM: 140 NMDG-Cl, 10 HEPES, 1 MgCl2, 5 glucose, and 1 EGTA, to pH 7.2 with Tris) included 1 mM Mg-ATP and 100 µM GTP. Pipettes using thin-wall thickness borosilicate glass were pulled to tip diameters of 1–2 µm (access resistance, <4 MΩ).
Ussing chamber measurements
HBE monolayers cultured on filter supports were mounted in modified Costar Ussing chambers, and the cultures were continuously short circuited with an automatic voltage clamp (Dept. of Bioengineering, University of Iowa). All experiments were performed at 37°C. Transepithelial resistance was measured by applying a 2.5-mV bipolar pulse every 100 s and calculated using Ohm's law. The I-V relation of α-toxin–permeabilized monolayers was measured by applying a bipolar pulse of increasing voltage steps from 10 to 70 mV at 5-s intervals per step. Each voltage step lasted 2 s, and the monolayer was short circuited (0 mV) between steps. Transepithelial resistance measurements were suspended during I-V measurements. Due to the large currents recorded during the I-V measurements, electrode stability was closely monitored.
For intact monolayer experiments, the bathing Ringer's solution was composed of 120 mM NaCl, 25 mM NaHCO3, 3.3 mM KH2PO4, 0.8 mM K2HPO4, 1.2 mM MgCl2, 1.2 mM CaCl2, and 10 mM glucose. Chambers were constantly gassed with a mixture of 95% O2/5% CO2, which maintained the pH at 7.4. Solutions used during α-toxin permeabilization experiments were bicarbonate free, and a chloride gradient was established to generate a driving force for transepithelial chloride flow. For experiments using a mucosal to serosal gradient, the mucosal solution was composed of 115 mM NaCl, 25 mM Na-gluconate, 5 mM KCl, 10 mM HEPES, 1 mM MgCl2, and 5 mM glucose, and the serosal solution consisted of 70 mM NaCl, 70 mM Na-gluconate, 5 mM KCl, 10 mM HEPES, 1 mM MgCl2, and 5 mM glucose, both at pH 7.4. To generate a serosal to mucosal gradient, the bathing solutions (above) were reversed. The mucosal solution for either gradient direction also included 1.5 mM CaCl2 to maintain tight junction integrity.
Basolateral membrane permeabilization was accomplished using 1 µg/ml of Staphylococcus aureus α-toxin. Because the toxin pores are large enough to permit the flow of calcium and ATP (Bhakdi et al., 1993), and preliminary experiments demonstrated a loss of forskolin-stimulated response in the absence of added ATP (Supplemental text), basolateral solutions were nominally calcium free and 1 mM Na-ATP was added to the basolateral solution. In addition, ouabain was added to the basolateral solution after permeabilization commenced to inhibit the NaK-ATPase and limit ATP consumption.
Data analysis
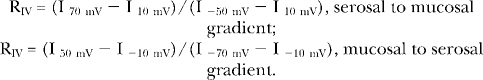
I-V relations are plotted as the average value of the current for the duration of each holding potential. Whole cell current tracings were reduced 1,000 times using the substitute average method (PClamp) for display purposes only. All patch clamp data are normalized by the membrane capacitance value recorded for each cell at the start of the experiment. For whole cell I-V data with a chloride equilibrium potential of 0 mV (symmetrical chloride concentrations), the nonlinearity of the I-V relation was quantified by calculating the ratio (RIV) of currents measured at the ±60-mV step (Vstep) potentials:
For HBE monolayer data, the chloride equilibrium potential was approximately ±10 mV based on the gradient direction. Thus, in addition to the voltage step applied during the I-V measurement, an additional 10-mV bias potential exists. The RIV calculations were adjusted to account for this bias:
 |
For a subset of experiments, the contribution of the paracellular pathway to the RIV values was subtracted using an estimate of the paracellular conductance (GP). To estimate GP, the values of GT and Isc acquired during permeabilization and GlyH-101 block were fit to a linear relation and, as previously demonstrated, using amiloride inhibition of sodium currents (Yonath and Civan, 1971; Wills et al., 1979), GP was assigned the y-intercept value. The current through SLC26A9 alone (IA9-Vstep) recorded in response to the voltage steps used in the calculation of RIV was then derived using the current divider equation:
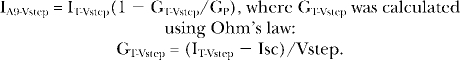 |
All results are displayed as means ± SEM. To test for significance, Student's t test was applied. To examine changes in the same group of measurements after different treatments, paired t testing was used. P < 0.05 was considered significant.
Chemicals
GlyH-101 was purchased from EMD; both GlyH-101 and glibenclamide were prepared as 1,000× stock solutions in DMSO. Forskolin was prepared in EtOH. Vehicle additions did not produce detectable responses in the recordings. Unless otherwise noted, all chemicals were purchased from Sigma-Aldrich.
Online supplemental material
As a basis for these experiments, the behavior of endogenous channels and temperature sensitivity of the expressed wtCFTR response in HEK 293 cells was examined (Figs. S1 and S2). In addition, suitable parameters for α-toxin permeabilization of HBE cells were established (Fig. S3). Finally, the effects of additional chloride channel blockers on SLC26A9 currents are reported. The online supplemental material is available at http://www.jgp.org/cgi/content/full/jgp.200810097/DC1.
RESULTS
HBE monolayers demonstrate GlyH-101–inhibited constitutive currents
We initially tested whether the constitutive currents observed across our polarized, well-differentiated HBE monolayers after amiloride inhibition of sodium transport were sensitive to GlyH-101 inhibition. These experiments were performed using the short-circuit technique under standard conditions for HBE monolayers that included a bicarbonate-buffered Ringer's solution in both mucosal and serosal compartments and continuous aeration with a CO2/O2 mix to maintain pH. After amiloride inhibition of ENaC currents, HBE monolayers exhibited an average basal current of −13.7 ± 1.2 μA/cm2 (n = 8; Fig. 1). Apical addition of 50 µM GlyH-101 rapidly inhibited 44 ± 4% (n = 4) of this basal current (gray curve). The addition of forskolin to the GlyH-101–blocked monolayer produced a small increase in Cl− secretion (ΔIsc = −4.1 ± 1.5 μA/cm2) that was completely inhibited by basolateral addition of bumetanide; basolateral addition of 4,4′-diisothiocyanatostilbene-2,2' disulfonic acid (DIDS) had little or no effect on the residual current. By comparison (black curve), forskolin stimulated a larger Cl− secretory current (ΔIsc = −17.7 ± 5.6 μA/cm2; n = 4) in the absence of GlyH-101 that was substantially inhibited by basolateral addition of bumetanide. Unlike the GlyH-101–blocked monolayer, however, basolateral addition of DIDS blocked a portion of the current remaining after bumetanide inhibition, reducing the final current to a level comparable to GlyH-101–inhibited monolayers. These results indicated that GlyH-101 significantly inhibited the constitutive current present before forskolin addition, confirming prior observations (Wang et al., 2005). Additionally, they suggested that a portion of the anion secretory response in HBE monolayers after NKCC1 block by bumetanide may be due to bicarbonate secretion, as basolateral DIDS is expected to inhibit multiple basolateral bicarbonate entry processes (Devor et al., 1999; Fischer and Widdicombe, 2006).
Figure 1.

Short-circuit current measurements in HBE monolayers reveal GlyH-101 inhibition of basal anion secretion. After amiloride inhibition of ENaC current, a basal anion current was evident. Application of 50 µM GlyH-101 to the apical chamber inhibited the basal current (gray trace) and attenuated the subsequent response to forskolin. In the absence of GlyH-101 (black trace), forskolin stimulated additional anion secretion. Basolateral application of bumetanide inhibited the forskolin-stimulated current in both GlyH-101–treated and untreated epithelia; only the latter were sensitive to basolateral DIDS (see Results). Traces representative of four filters from each condition are shown.
SLC26A9 is a constitutively active chloride channel
We compared the characteristics of the chloride currents of SLC26A9 and CFTR expressed in HEK 293 cells to determine whether their properties would elucidate the basis of the constitutive and regulated currents across HBE monolayers. All experiments using HEK 293 expression were performed with solutions that limited the conductive ions to chloride. On establishment of the whole cell patch mode, SLC26A9-transfected HEK 293 cells displayed an average membrane current (Im) of −16 ± 2 pA/pF at a holding potential of −40 mV (used for all whole cell voltage clamp measurements), and a relatively low initial Rm of 290 ± 40 MΩ (n = 36). By comparison, cells expressing wtCFTR alone had an initial basal Im of −2.3 ± 0.4 pA/pF with an Rm of 1,200 ± 100 MΩ (n = 61), whereas cells transfected with GFP alone exhibited an Im of −0.2 ± 0.25 pA/pF and an Rm of 2,700 ± 400 MΩ (n = 12). The constitutive activity of HEK 293 cells expressing SLC26A9 alone was maintained during the course of a 7-min recording (Fig. 2 A). Bath addition of 10 µM forskolin had no significant effect on SLC26A9 currents, nor did 100 µM ATP (not depicted). In addition, the I-V curves for SLC26A9 transfectants were linear, with a reversal potential equivalent to the chloride equilibrium potential (Fig. 2 B). HEK 293 cells transfected with GFP alone were also unresponsive to forskolin (Fig. 2 A) and ATP (not depicted), and they typically displayed small currents with a reversal potential of −40 mV and a sigmoidal I-V (Supplemental text), consistent with other studies of this cell line (Thomas and Smart, 2005).
Figure 2.

HEK 293 cells transiently transfected with SLC26A9 exhibit constitutive chloride currents under whole cell voltage clamp. (A) Cells transfected with GFP ± SLC26A9 were voltage clamped at −40 mV. A subset of cells were stimulated with 10 µM forskolin. SLC26A9-expressing cells exhibited constitutive chloride currents that were not enhanced by forskolin stimulation. Cells expressing GFP alone exhibited no significant basal current or response to forskolin. Representative tracings from at least three experiments each are shown. (B) SLC26A9-transfected cells exhibited linear I-V relations before, during, and after forskolin treatment. I-V curves are for the trace shown in A, labeled SLC26A9 + GFP + fsk, recorded at the indicated times (solid diamonds). HEK 293 cells transfected with GFP alone had negligible currents that did not contribute significantly to the I-V relations of SLC26A9-expressing cells (Supplemental text). All current values are normalized by cell capacitance.
To quantify the whole cell I-V characteristics of SLC26A9 and CFTR channels with and without stimulation and in the presence of blockers, we calculated an I-V ratio (RIV; see Materials and methods) at different time points during the measurement protocols. At 60 s after break-in, SLC26A9-transfected HEK 293 cells had an RIV of 1.00 ± 0.03 (n = 18), confirming that this constitutively active channel exhibited linear (voltage-independent) currents in symmetrical chloride solutions. HEK 293 cells transiently transfected with wtCFTR exhibited an initial RIV of 1.31 ± 0.05 (n = 28), 60 s after break-in. This outward-rectified (OR) I-V relation and small recorded current (above) likely reflect endogenous HEK 293 channels that exhibit significant rundown (Supplemental text) because wtCFTR exhibits linear I-V properties in symmetrical chloride solutions during stimulation and maintains a linear RIV after returning to baseline after washout of forskolin.
CFTR channel blockers interact with SLC26A9
One of the most specific and rapidly acting CFTR channel blockers reported to date is GlyH-101 (Muanprasat et al., 2004). Unlike most blockers of CFTR, this negatively charged glycine hydrazide occludes the extracellular vestibule of the open CFTR pore, which results in a strong inward rectification (IR) of the CFTR I-V relation in the presence of blocker (Sheppard, 2004). Another commonly used CFTR channel blocker is glibenclamide; the strong OR I-V characteristic observed during glibenclamide inhibition of CFTR has been attributed to the interaction of this negatively charged blocker with the intracellular face of the channel pore (Schultz et al., 1999; Sheppard, 2004). We measured the magnitude of inhibition and I-V relations of these blockers on HEK 293 expressing either SLC26A9 or CFTR.
As summarized in Fig. 3, SLC26A9-transfected cells demonstrated a rundown in current to 80% of initial levels within 3 min of break-in, which then stabilized for the duration of the recordings. The current rundown and stabilization was unaffected by the application of forskolin (Fig. 3 B). Strikingly, we found that GlyH-101 was also a potent inhibitor of the constitutive activity of SLC26A9 at a concentration (50 µM) typically used to inhibit CFTR, blocking 71 ± 4% (n = 4) of the constitutive current. This inhibition of SLC26A9 exhibited a rapid initial phase followed by a slower inhibition, and the block was partially reversed, again with two kinetic components, during a 3-min washout (Fig. 4 A). Unlike the result with GlyH-101, the addition of 100 µM glibenclamide to SLC26A9-transfected cells had no significant effect on Im (Figs. 3 and 4), in agreement with the observations of Dorwart et al. (2007).
Figure 3.

Summary of SLC26A9 current time course and blocker effects. (A) HEK 293 cells treated with 50 µM GlyH-101 were significantly inhibited after 3 min and exhibited a partial recovery after 3 min of blocker washout. The effect of 100 µM glibenclamide was not statistically different from the 20% rundown in constitutive current normally observed in untreated cells. (B) The addition of forskolin during the blocker protocols did not significantly affect either the rundown or blocker efficacy. All currents are normalized to their respective basal current (see Results) at break-in. *, P < 0.05 compared against the same time point from unblocked cells and for paired t test with prior time point. Number of experiments for each case is indicated on the bar groups. A representative time course and protocol are shown in Fig. 2 A.
Figure 4.

The CFTR channel inhibitor GlyH-101 inhibits SLC26A9. (A) HEK 293 cells transfected with SLC26A9 and voltage clamped at −40 mV were exposed to either 50 µM GlyH-101 or 100 µM glibenclamide after a 60-s stabilization period. GlyH-101 inhibited 50% of the constitutive chloride current within seconds and an additional 20% over the course of a 3-min application. The inhibition was partially reversed after 3 min of washout, also with two phases of recovery. The minor drop in current during application of 100 µM glibenclamide was statistically insignificant; longer exposure times and/or higher doses were not explored. Representative tracings of at least three experiments each are shown. (B) Representative I-V behavior of SLC26A9 and CFTR in the presence of the indicated blockers. SLC26A9-transfected cells displayed a mild IR I-V response after 3 min of exposure to either GlyH-101 or glibenclamide. Cells transfected with wtCFTR, stimulated with 10 µM forskolin, and then inhibited with 50 µM GlyH-101 for 3 min displayed a strong IR I-V response. SLC26A9 I-V curves are for traces shown in A, measured at 240 s (solid diamond). All current values are normalized by cell capacitance.
Importantly, the I-V relation during GlyH-101 inhibition of SLC26A9 was only mildly IR with an RIV of 0.83 ± 0.02, compared with an RIV of 0.42 ± 0.03 (n = 3) for GlyH-101 inhibition of stimulated CFTR currents (Fig. 4 B; only the I-V relations in the presence of blocker are shown for comparison of their voltage-dependent properties). These I-V ratios suggest that the interaction of GlyH-101 with SLC26A9 is mechanistically different from that with CFTR. Although glibenclamide did not significantly inhibit SLC26A9 currents at a holding potential of −40 mV, the RIV during its application dropped slightly, but significantly, from 1.06 ± 0.07 to slightly IR (0.95 ± 0.02; n = 6; paired t test; P < 0.05). Thus, it is possible that glibenclamide has a weak interaction with SLC26A9 that might reach statistical significance at a higher concentration and/or longer duration of application. In contrast, glibenclamide inhibition of forskolin-stimulated HEK 293 cells expressing wtCFTR displayed the expected strong OR RIV (1.84 ± 0.02; discussed in detail below). The inhibitory actions of both blockers were compared against untreated or forskolin-treated controls at time points after the initial current rundown, and both blockers were prepared in the same concentration of vehicle (0.1% DMSO). Under the conditions used here, the inhibition of current and shift in RIV indicate that GlyH-101 significantly inhibits SLC26A9, whereas glibenclamide does not. Most importantly, the shift in RIV on the application of either blocker to SLC26A9 is significantly different from the shift in RIV during their inhibition of CFTR, providing a fingerprint to uniquely identify the two channels.
Coexpression of SLC26A9 and wtCFTR enhances the response to forskolin
Cells coexpressing SLC26A9 + wtCFTR had a basal current of −21 ± 3 pA/pF with an Rm of 218 ± 21 MΩ (n = 56) on establishment of the whole cell mode; these values were not statistically different from cells expressing SLC26A9 alone (above). To further assess whether an interaction between the channels was occurring in this initial unstimulated state, we monitored the current rundown, as well as the effects of a 3-min exposure to GlyH-101 or glibenclamide, in the absence of forskolin. As shown in Fig. 5, there was no difference in the rundown or action of the blockers before stimulation whether SLC26A9 was expressed alone or with wtCFTR. Furthermore, the I-V ratios were essentially unchanged from those measured for SLC26A9 alone: GlyH-101 induced a mild IR RIV (0.84 ± 0.04; n = 3), whereas the glibenclamide ratio remained linear (1.03 ± 0.07; n = 6). Neither ratio was statistically different from its paired, pre-blocked value or from the ratios measured for SLC26A9 alone.
Figure 5.

Current and blocker properties in HEK 293 cells coexpressing SLC26A9 + wtCFTR are no different before forskolin stimulation from cells expressing SLC26A9 alone. The number of experiments for each case is included on the bar groups. All currents were normalized to their respective basal current at break-in. *, P < 0.05 compared with bath alone.
As shown in Fig. 6 A, cells expressing CFTR + SLC26A9 or CFTR alone responded to forskolin within 30 s of addition and reached peak currents in 90 ± 7 s (n = 11) or 98 ± 6 s (n = 21), respectively. However, coexpression of wtCFTR with SLC26A9 significantly modified the typical response of CFTR to stimulation. Although the essential shape of the response was similar, cells coexpressing SLC26A9 and wtCFTR exhibited larger currents that did not return to baseline after washout of forskolin. This poststimulation current was not due to a delay in CFTR recovery; as shown in Fig. 6 A, it persisted for 8 min after CFTR alone had returned to its prestimulation baseline. Coexpressors maintained linear I-V characteristics before, during, and after stimulation, and cells expressing CFTR alone demonstrated linear I-V relations during and also after forskolin stimulation (Fig. 6, B and C).
Figure 6.

HEK 293 coexpression of SLC26A9 with wtCFTR increases forskolin-stimulated chloride currents over cells expressing CFTR alone. (A) Coexpressers (gray) consistently had larger currents than CFTR alone (black) as assessed at four measurement points: the basal currents before stimulation (60 s), the transient peak in response to 10 µM forskolin (150 s on average), the current plateau in the continued presence of forskolin (240 s), and the poststimulation current observed 3 min after forskolin washout (420 s). The poststimulation current in the coexpressers did not diminish during extended recordings (extra 8 min, this case). Representative tracings of at least three experiments each are shown. I-V measurements were performed at the indicated intervals (solid diamonds). (B) Cells expressing CFTR alone displayed the classical linear I-V in response to forskolin, with minimal current before stimulation and after forskolin washout. Curves are for black trace shown in A. (C) Cells expressing SLC26A9 + CFTR also displayed a linear I-V in response to forskolin; however, the magnitudes were larger and included the constitutive and enhanced poststimulation currents (note scale doubled from B). Curves are for gray trace shown in A. (D) Summary of the responses for SLC26A9 and CFTR expressed alone and together. Representative tracings are shown in A and Fig. 2 A. Fixed measurement points are identified in A. Peak values were measured at the actual peak of each tracing, with average peak times occurring at 150 ± 7 s for SLC26A9 + wtCFTR coexpressors and 158 ± 6 s for wtCFTR alone. The value for SLC26A9 alone was measured at 150 s. The SLC26A9 + wtCFTR coexpressor currents exceed the sum of the wtCFTR and SLC26A9 individual currents during and after forskolin stimulation (see Results). All current values were normalized to cell capacitance; VH = −40 mV. *, P < 0.05 compared with CFTR alone.
The observations in Fig. 5 suggested that SLC26A9 and CFTR channels were functioning independently before the addition of forskolin. If the channels continued to function independently during stimulation, we would expect the larger currents of the coexpressors (Fig. 6 A) to reflect the sum of the currents measured from the independent constructs under the same stimulation protocol. We identified three specific measurement points for comparison and found that this was not the case (Fig. 6 D): at the peak of stimulation, coexpressors averaged an additional −97 ± 54 pA/pF, and during the current plateau, an additional −67 ± 34 pA/pF over the response of CFTR alone. Both increases are several times greater than the comparable currents of SLC26A9 alone (−12 and −11 pA/pF, respectively). Furthermore, although SLC26A9 normally exhibits some rundown within 3 min when expressed alone (Fig. 3 B) or with unstimulated CFTR (Fig. 5), the poststimulation current of the coexpressors exceeded the current observed for SLC26A9 alone by −55 ± 16 pA/pF. These results suggest that an interaction between the channels occurred during forskolin stimulation, and that this interaction persisted well after forskolin was removed (Fig. 6 A). This behavior could result from the maintenance of CFTR in an active state after forskolin washout or from an increase in the activity of SLC26A9.
Effect of blockers on HEK 293 cells coexpressing SLC26A9 and wtCFTR
We tested the effect of blockers on forskolin-stimulated cells and first verified published data on the action of the blockers on cells expressing wtCFTR alone. The time course of the inhibition and corresponding I-V curves are shown in Fig. 7. We found that GlyH-101 was very effective on wtCFTR alone (Fig. 7 A), inhibiting 90 ± 2% (n = 3; P < 0.001) of the plateau current within 1 min of addition. Glibenclamide inhibition was slower to develop, most likely due to its intracellular binding site, and it was less effective, inhibiting 52 ± 10% (n = 4) of the plateau current (both 3 min after addition). The I-V relations during inhibition (Fig. 7 B) demonstrate significant differences in the voltage dependence of block. Applying the same protocol to cells coexpressing SLC26A9 and wtCFTR (Fig. 7 C), we also found that both blockers inhibited the plateau current within 2 min of addition. GlyH-101 acted more rapidly and inhibited 65 ± 3% (n = 4) of the plateau current, whereas glibenclamide inhibition was slower to develop and blocked 36 ± 11% (n = 3) of the plateau current. The I-V relations (Fig. 7 D) demonstrated the expected inward and OR profiles for GlyH-101 and glibenclamide block, respectively; however, the voltage dependence of the inhibition was decreased compared with CFTR alone (Fig. 7 B; see quantitation in Table I, discussed below).
Figure 7.

Responses of forskolin-stimulated currents to blockers in HEK 293 cells expressing wtCFTR ± SLC26A9. (A) HEK 293 cells expressing wtCFTR alone were stimulated with forskolin and allowed to reach a plateau, and then inhibited with either glibenclamide or GlyH-101; the latter rapidly and almost completely inhibited wtCFTR alone. VH = −40 mV. (B) I-V curves measured 90 s after the addition of blocker (330 s in A) demonstrate the opposite voltage dependence of the two blockers. (C) HEK 293 cells coexpressing SLC26A9 and wtCFTR were stimulated with forskolin and allowed to reach a plateau, and then inhibited with either glibenclamide or GlyH-101. VH = −40 mV. (D) The I-V curves measured 90 s after the addition of blocker (330 s in C) demonstrate the opposite voltage dependencies of the two blockers. The nonlinearity or voltage dependence of the block of wtCFTR alone (B) is greater than evidenced in the coexpressors (see Table I for mean values).
TABLE I.
Comparison of blocker impact on RIV for all HEK 293 constructs
| Drug order | Basala | Forskolin | GlyH-101 | Forskolin+GlyH-101 | Forskolin+Glibenclamide | GlyH-101+Forskolin | Glibenclamide+Forskolin |
| Construct | |||||||
| SLC26A9 | 0.98 ± 0.03 | 0.96 ± 0.04 | 0.85 ± 0.02 | 0.83 ± 0.02 | 0.95 ± 0.02 | ntb | nt |
| wtCFTR | 1.30 ± 0.05 | 0.98 ± 0.01 | 0.96 ± 0.04c | 0.42 ± 0.03 | 1.84 ± 0.02 | 0.35 ± 0.01 | 1.82 ± 0.03 |
| SLC26A9 + wtCFTR | 1.04 ± 0.04 | 0.99 ± 0.01 | 0.84 ± 0.04 | 0.62 ± 0.05 | 1.41 ± 0.10 | 0.50 ± 0.07 | 1.40 ± 0.09 |
Order of agonist or blocker represents experimental additions. Each measurement represents an n ≥ 3.
Basal values given are for cells subsequently exposed to forskolin.
nt, not tested.
CFTR was inactive with Im = −0.09 ± 0.27 pA/pF.
To assess the individual contributions of coexpressed SLC26A9 and wtCFTR to the increased current response to forskolin (Fig. 6 D), we measured the RIV under different blocker conditions and compared them to the RIV measured for cells expressing the channels individually. As reported above and summarized in Table I, cells expressing SLC26A9 alone demonstrated a slight IR during application of either blocker, whereas cells expressing CFTR alone demonstrated strong IR (GlyH-101) and OR (glibenclamide) I-V relations during inhibition. In addition, the RIV values during blocker inhibition of coexpressors before forskolin stimulation were the same as for SLC26A9 alone (0.84 ± 0.04, n = 3 for GlyH-101; 1.03 ± 0.07, n = 6 for glibenclamide), as was also shown for the current magnitudes (Fig. 5). In the presence of forskolin, the RIV values for the blocked currents were intermediate between the values measured for SLC26A9 alone and wtCFTR alone, suggesting that both channels were contributing to the total stimulated current observed in the coexpressors. Similarly, although GlyH-101 inhibited 90 ± 2% of the forskolin-stimulated CFTR-alone current, it was less effective on the constitutive SLC26A9 current (71 ± 4%) and the forskolin-stimulated current in the coexpressors (65 ± 3%). These results are consistent with a physical interaction between stimulated CFTR and SLC26A9, as was demonstrated for wtCFTR and SLC26A3 (Ko et al., 2002, 2004). Reversing the order of treatment (blocker for 3 min, then forskolin stimulation for 3 min in the continued presence of blocker) resulted in the same final RIV values (Table I).
With clearly defined RIV values for SLC26A9 and CFTR expressed alone and together, we tested the effect of GlyH-101 inhibition on the poststimulation current evident in the coexpressors after forskolin washout (Fig. 6, A and D). As shown in Fig. 8, HEK 293 coexpressors were first stimulated with forskolin for 3 min, and then perfused with forskolin-free solution for 3 min to establish the poststimulation current (295 ± 57% of basal current; n = 11). Cells were then treated with GlyH-101 for 3 min, which significantly blocked the poststimulation current (73 ± 10%; n = 3; P < 0.05). Washout of the blocker resulted in a small recovery of the poststimulation current, reminiscent of the partial reversal of the GlyH-101 block in cells expressing SLC26A9 alone (Fig. 4 A). The RIV during block of the poststimulation current was 0.83 ± 0.03 (n = 3), identical to the value obtained for GlyH-101 block in cells expressing SLC26A9 alone (Table I). Thus, the action of GlyH-101 on the poststimulation current in coexpressors was the same as its action on the constitutive current of SLC26A9 alone: 70% inhibition with an RIV of 0.83. These results suggest that the enhanced poststimulation current was due to SLC26A9, rather than to a continued activation of CFTR in the absence of forskolin. However, as shown in Fig. 6 D, the poststimulation current of the coexpressors was significantly greater than in cells expressing SLC26A9 alone. Either forskolin stimulation in coexpressors recruited additional SLC26A9 channels to the plasma membrane, or the open probability of SLC26A9 increased in the presence of phosphorylated CFTR and persisted after CFTR itself had inactivated. Any change in the properties of SLC26A9 required an interaction with CFTR because forskolin had no impact on the extended currents of SLC26A9 expressed alone (Figs. 2 and 3).
Figure 8.

GlyH-101 blocks the poststimulation current in HEK cells coexpressing SLC26A9 and wtCFTR. Cells were stimulated with 10 µM forskolin for 3 min, and then perfused with bath alone for an additional 3 min to expose the poststimulation current. After the poststimulation current had stabilized, 50 µM GlyH-101 was added for 3 min, after which cells slowly recovered from blocker. The effect of GlyH-101 was similar to its effect on cells expressing SLC26A9 alone (Fig. 4 A). VH = −40 mV, and currents are normalized to cell capacitance. A representative tracing of three experiments is shown.
Thus far, our results have demonstrated that SLC26A9 alone was sufficient to generate basal currents, that SLC26A9 was substantially inhibited by the CFTR blocker GlyH-101, that cells coexpressing SLC26A9 and wtCFTR exhibited both basal currents and enhanced forskolin-stimulated currents, and that the contribution of these channels to the basal and stimulated currents could be differentiated by measurement of the whole cell RIV during blocker treatments. As shown in Fig. 1, HBE monolayers exhibit a basal current after inhibition of sodium transport and in the absence of cAMP/PKA stimulation. Previously, this basal current has been attributed to a constitutive activity of CFTR, in part because it is absent in HBE cells from CF patients. Interestingly, and also in support of a basal activation of CFTR, it was demonstrated that this basal activity was inhibited by GlyH-101 (Wang et al., 2005; Song et al., 2006), and that this inhibition had an impact on ASL composition. Our results in HEK 293 cells support a potential role for SLC26A9 in generating the basal currents observed in HBE monolayers.
HBE cells express SLC26A9 mRNA
Lohi et al. (2002) have reported the expression of SLC26A9 in airway surface epithelia. We used RT-PCR to confirm that the primary HBE cells used in these protocols expressed SLC26A9, as well as to examine its expression in HBE cells from CF patients. RNA was harvested from HBE filters grown at an air–liquid interface; the filters used were from the same groups used for transepithelial current measurements. RNA was also harvested from HEK 293 cells transfected with the different constructs used for whole cell electrophysiology as controls. The RNA was reverse transcribed, and then probed for CFTR and SLC26A9 mRNA expression using PCR. As shown in Fig. 9, both wt and CF HBE cells demonstrated PCR products for both SLC26A9 and CFTR. Transfected HEK 293 cells were positive for SLC26A9 and CFTR, whereas GFP-transfected control HEK 293 cells were not.
Figure 9.

RT-PCR indicates that HBE monolayers express SLC26A9 mRNA. (A) RNA harvested from either wt or ΔF508/ΔF508 CF HBE monolayers grown at air liquid interface for at least 2 wk demonstrates endogenous mRNA for both SLC26A9 (1,100-bp product) and CFTR (237-bp product); β-actin was amplified as a control (353-bp product). Apparent differences in SLC26A9 mRNA between wt and CF HBE monolayers were not quantified. (B) HEK 293 cells were transfected with GFP alone (as control), or GFP and SLC26A9 ± wtCFTR, as indicated in Materials and methods and at the bottom of the figure. Control HEK cells do not express endogenous SLC26A9. Molecular weights and markers are the same as in A (n ≥ 3).
Permeabilization of HBE monolayers reveals the basal chloride current
Our results in HEK 293 cells suggested that the inhibitory action of GlyH-101 on SLC26A9 could be differentiated from its action on CFTR by comparing the I-V relations during blocker application. The complexity of the HBE cell monolayer in terms of the known channels, transporters, and pumps required us to electrically isolate the apical membrane and limit permeant bath solution anions to those used in the whole cell patch clamp experiments to perform meaningful I-V comparisons. The results of Fig. 1 indicated the possibility of both a chloride and bicarbonate component in the basal and/or stimulated anion efflux, and both CFTR (Smith and Welsh, 1992; Poulsen et al., 1994; Devor et al., 1999; Krouse et al., 2004) and SLC26A9 (Xu et al., 2005) may be conductive to bicarbonate under appropriate conditions. With the goal of determining whether SLC26A9 contributes to the basal currents in HBE monolayers, in comparison with the chloride currents and their I-V characteristics in HEK 293 cells, we performed the remainder of our monolayer measurements in bicarbonate-free solutions.
α-Toxin has been used to permeabilize membranes and isolate the CFTR anion conductance in several systems (Ostedgaard et al., 1992; Hallows et al., 2003; Reddy and Quinton, 2003). It has the disadvantage of creating relatively large pores (1.5 nm; Bhakdi et al., 1993) that also permit the flux of divalent cations and ATP, which requires attention to bath solution composition. After testing several different doses of α-toxin and the impact of ATP loss on the forskolin response of permeabilized monolayers (Supplemental text), we adopted a permeabilization protocol that included a relatively low dose of α-toxin, inhibition of the Na-K-ATPase with 100 µM ouabain (to limit energy use), and addition of 1 mM Na-ATP, all applied to the basolateral bath. As shown in Fig. 10 A, complete permeabilization with α-toxin required ∼15 min, as judged by the shift in current. Sequential addition of ouabain and ATP after the initial evidence of permeabilization did not alter the short-circuit current from that seen in their absence (Supplemental text). Apical addition of the cation channel blockers amiloride and barium chloride had no impact on Isc, as expected in the absence of bath solution cation gradients.
Figure 10.

α-Toxin–permeabilized HBE monolayers exhibit constitutive and forskolin-stimulated chloride currents and voltage-dependent blocker effects. (A) Short-circuit current measurements performed on three separate filters demonstrate GlyH-101 and glibenclamide inhibition properties. With a mucosal to serosal chloride gradient of 48 mM (EqCl = −13 mV), constitutive chloride currents from mucosa to serosa were evident after permeabilization, and forskolin stimulation tripled the current. GlyH-101 rapidly inhibited the stimulated current (blue trace), whereas glibenclamide inhibition was slower and less effective (black trace). GlyH-101 was equally effective at inhibiting the constitutive current before forskolin stimulation (red trace). The forskolin-stimulated current after GlyH-101 block was small, but forskolin still significantly shifted the RIV, consistent with activation of CFTR (see Results). Bars below the traces indicate additions to the basolateral chamber, whereas those above indicate additions to the apical chamber. Permeabilization with α-toxin required ∼15 min; ouabain was added to inhibit Na-K-ATPase, whereas ATP was added to replenish intracellular stores (Supplemental text). Solutions were bicarbonate free, and recordings were started within 2 min of filter submersion. Representative tracings of at least four filters per blocker are shown. (B) Same tracings as in A but including the I-V measurements, consisting of bipolar pulses from ±10 to ±60 mV in 10-mV steps. Pulses were simultaneously applied to two filters for the traces shown. I-V measurements were performed after permeabilization (basal), forskolin stimulation (fsk), and blocker inhibition (fsk+blocker). Although the I-V responses overlapped for the basal and fsk measurements, differences in the voltage dependence of the two blockers were evident in the third measurement. Cation channel blockers (A) were added to minimize contributions from ENaC and potassium channels to the I-V response. The permeabilization phase of the recording was removed for clarity. (C) The I-V curves measured for the forskolin-stimulated monolayer treated with glibenclamide (black) demonstrate the shift from linear (open symbols) to OR on blocker addition (solid triangles), whereas the I-V curves measured for the stimulated monolayer treated with GlyH-101 (blue) demonstrate the shift from linear (open symbols) to IR on blocker addition (blue triangles).
The effectiveness of permeabilization was determined by comparing the pre- and post-permeabilization basal currents using equivalent mucosal to serosal or serosal to mucosal chloride gradients. With a mucosal to serosal chloride gradient, monolayers exhibited an initial Isc of −16.5 ± 1.3 μA/cm2 that shifted to +16.3 ± 1.0 μA/cm2 (n = 19) after permeabilization (Fig. 10 A), consistent with the chloride-absorptive current expected for this gradient and holding potential (0 mV). With a similar but oppositely directed (serosal to mucosal) chloride gradient, monolayers exhibited a basal Isc of −27.1 ± 1.6 μA/cm2 (n = 12) that dropped to −14.8 ± 2.8 μA/cm2, consistent with a secretory chloride current. The pre-permeabilization currents were statistically different; however, only the polarity of the post-permeabilization current changed. Furthermore, basolateral addition of bumetanide to permeabilized forskolin-stimulated monolayers had no effect (not depicted). These results indicated that the basolateral membrane was completely permeable to chloride, and the short-circuit current was driven solely by the imposed chloride gradient.
GlyH-101 and glibenclamide have different inhibition characteristics in HBE monolayers
These results confirmed that HBE monolayers had a significant, constitutively active chloride conductance (Isc = 16.3 ± 1.0 μA/cm2) localized to the apical membrane. As shown in Fig. 10 A, basolateral addition of 10 µM forskolin rapidly stimulated an additional chloride current to a plateau of 47.1 ± 3.0 μA/cm2 (n = 9), and this elevated current was sustained until blocker addition. The CFTR channel blockers GlyH-101 and glibenclamide had significantly different effects on the stimulated chloride current. GlyH-101 rapidly inhibited 68 ± 9% of Isc within 1 min of application (n = 5; P < 0.01, paired test), whereas glibenclamide inhibition was much more protracted: only 14 ± 8% (n = 4, NS) in the first min and 28 ± 3% after 3 min (P < 0.01). GlyH-101 inhibition was unchanged after 3 min (69 ± 7%). Thus, GlyH-101 was considerably more effective at inhibiting the stimulated chloride current. These blocker inhibition characteristics (kinetics and magnitude) are similar to those observed in HEK 293 cells coexpressing SLC26A9 and CFTR (Fig. 7 C).
Having demonstrated the adequacy of permeabilization, the presence of both constitutive and forskolin-stimulated currents, and blocker actions on forskolin-stimulated currents in our permeabilized HBE monolayers, we asked the central question: What is the blocker fingerprint for HBE constitutive currents? We verified that GlyH-101 inhibited the constitutive current in the permeabilized HBE monolayers (Fig. 10 A) and measured the I-V relation during inhibition and after the addition of forskolin. GlyH-101 inhibited 68 ± 6% of the basal current, yet the RIV for this inhibition was essentially linear (0.97 ± 0.01; n = 8), a strong argument against CFTR as the source of this constitutive current (Table II). Furthermore, although the forskolin-stimulated current in the presence of GlyH-101 was small (Fig. 10 A), the corresponding RIV dropped to 0.89 ± 0.01, a statistically significant shift toward IR (P < 0.005, paired t test; n = 8), consistent with both the activation of CFTR and the similar response of HEK 293 coexpressors.
TABLE II.
Comparison of blocker impact on RIV for all HBE monolayers
| Drug order | Basal | Forskolin | GlyH-101 | Forskolin+GlyH-101 | Forskolin+Glibenclamide | GlyH-101+Forskolin | Glibenclamide+Forskolin |
| wtHBE | 1.06 ± 0.01 | 1.06 ± 0.02 | 0.97 ± 0.01 | 0.83 ± 0.03 | 1.39 ± 0.14 | 0.89 ± 0.01 | 1.50 ± 0.03 |
| GP adjusteda | 1.17 ± 0.06 | 0.90 ± 0.05 | 0.66 ± 0.03 |
Order of agonist or blocker represents experimental additions. Each measurement represents an n ≥ 6.
Values calculated with correction for paracellular conductance.
After forskolin stimulation, the different voltage dependencies of the two blockers were evident in the skewed amplitudes of the I-V pulse currents (Fig. 10 B). The derived I-V curves confirmed that the basal and forskolin-stimulated I-V relations were essentially linear, whereas glibenclamide induced an OR I-V relation and GlyH-101 resulted in an IR I-V relation (Fig. 10 C). The mean RIV values are provided in Table II. The basal ratio was unchanged by forskolin stimulation, and both were slightly OR (1.06). Stimulated monolayers treated with glibenclamide shifted to an OR RIV of 1.39 ± 0.14 (n = 3), whereas those treated with GlyH-101 had an IR RIV of 0.83 ± 0.03 (n = 5). Both ratios were significantly changed from their RIV before block (paired t test, P < 0.05). Similar to the HEK 293 findings (Table I), the blocker-dependent changes in RIV were not affected by the order of stimulation versus blocker application (Table II). Compared with the RIV measured in HEK 293 cells (Table I), the degree of nonlinearity was substantially less than that observed in cells expressing only wtCFTR, and moderately less than HEK 293 cells coexpressing SLC26A9 and CFTR.
The tendency toward less rectification in the RIV of the monolayers for all blocker combinations likely reflects voltage-independent currents through the paracellular pathway. The intact monolayer is of moderate transepithelial resistance, 405 ± 40 Ωcm2, yielding a conductance (GT) of 2.80 ± 0.50 mS/cm2 (n = 8). After α-toxin permeabilization effectively eliminated the resistance of the basolateral membrane, and cation channel blockers were added to the apical bath, the recorded GT was 4.39 ± 0.85 mS/cm2, which should primarily reflect the conductance of SLC26A9 and the paracellular pathway. The addition of GlyH-101 to the apical bath to inhibit SLC26A9 reduced GT to 2.68 ± 0.47 mS/cm2. If this represents 70% inhibition of SLC26A9 (Figs. 5 and 8), the paracellular pathway accounts for ∼45% of the total conductance of the permeabilized monolayer. To confirm this without relying on assumed blocker efficiency, we estimated GP from a fit of Isc under constitutive and GlyH-101–blocked conditions (see Materials and methods). GP was 2.29 ± 0.5 mS/cm2 by this technique, or 50 ± 6% of the recorded GT. Adjusted RIV values based on the apical membrane conductance alone, for monolayers treated with GlyH-101, are shown italicized in Table II and compare favorably with the values observed in HEK coexpressors (Table I).
Effect of ΔF508 CFTR on SLC26A9 current
The RT-PCR results revealed expression of SLC26A9 mRNA in the CF HBE monolayers. To probe for a basal current suggestive of SLC26A9 expression at the apical membrane, we applied the α-toxin permeabilization protocol to CF HBE. In the presence of a mucosal to serosal chloride gradient, the CF epithelia had an initial basal current of −5.67 ± 0.56 μA/cm2 (n = 6) that shifted to 2.38 ± 0.51 μA/cm2 after permeabilization, significantly less basal current than observed in normal HBE (16.3 ± 1.0 μA/cm2). This basal current was unaffected by either GlyH-101 (107 ± 10% of basal; n = 3) or glibenclamide (105 ± 6% of basal; n = 3), and the I-V relation during blocker addition remained mildly IR for both (0.94 ± 0.02 and 0.93 ± 0.03, respectively). The addition of forskolin was without effect on the current, as expected for a lack of functional CFTR at the apical plasma membrane. Thus, the CF monolayers did not appear to express conductive SLC26A9 or CFTR at the apical membrane.
To test whether defective CFTR could suppress or modify the expression of SLC26A9 at the plasma membrane, we coexpressed SLC26A9 and ΔF508 CFTR in HEK 293 cells. These ΔF508 CFTR coexpressors had a basal current of −29 ± 5 pA/pF (n = 5), but their I-V relations matched the RIV properties measured for endogenous chloride channels in HEK cells (Table III). This basal current rapidly ran down (50 ± 9% in 3 min), consistent with observations in HEK cells expressing GFP alone (Supplemental text). As shown in Table III, cells expressing GFP alone maintained an OR RIV over time, even though current rundown occurred. The same phenomenon was observed in the HEK cells coexpressing SLC26A9 with ΔF508 CFTR, even though the cells were exposed to forskolin for 3 min. In contrast, cells expressing wtCFTR alone transitioned from an OR RIV to a linear relation with current stimulation on exposure to forskolin. Thus, the linear RIV fingerprint, typical of SLC26A9 alone or in combination with wtCFTR (Table I), was not evident when the channel was coexpressed with ΔF508 CFTR.
TABLE III.
Endogenous channel RIV fingerprint is evident in SLC26A9 + ΔF508CFTR coexpressing HEK 293 cells
| Construct | Time | ||
| 60 s | 240 s | 420 s | |
| GFP(± fsk, n.s.)a | 1.27 ± 0.09 | 1.28 ± 0.09 | 1.29 ± 0.11 |
| wtCFTR (no fsk) | 1.27 ± 0.15 | 1.36 ± 0.11 | ntb |
| wtCFTR(3 min fsk at 240 s) | 1.30 ± 0.05 | 0.98 ± 0.01c | 0.95 ± 0.01c |
| SLC26A9 + ΔF508CFTR(3 min fsk at 240 s) | 1.20 ± 0.05 | 1.20 ± 0.07 | 1.27 ± 0.08 |
GFP-alone constructs did not demonstrate significant differences in RIV in the presence or absence of forskolin stimulation, and the data are pooled.
nt, not tested.
P < 0.01 compared to same time point in other constructs.
SLC26A9 immunoprecipitates wtCFTR
To confirm an interaction between SLC26A9 and wtCFTR in vivo, coimmunoprecipitation was performed on HEK 293 cells transiently transfected with wtCFTR ± myc-tagged SLC26A9. As shown in Fig. 11, anti-myc precipitated both immature (band B) and mature (band C) wtCFTR from HEK 293 cells coexpressing both channels, confirming that an interaction exists between SLC26A9 and CFTR in vivo. Interestingly, the interaction between immature CFTR and myc-SLC26A9 may provide an explanation for our finding that constitutive SLC26A9 currents were not detected in either CF HBE or HEK 293 cells coexpressing SLC26A9 with ΔF508 CFTR. As this mutation blocks the maturation and plasma membrane expression of CFTR (Cheng et al., 1990), their interaction may also lead to the intracellular retention of SLC26A9.
Figure 11.

SLC26A9 interacts with wtCFTR in vivo. Equal amounts of protein (∼500 µg) from HEK 293 cells transiently transfected with wtCFTR alone or with CFTR plus myc-SLC26A9 (myc-A9) were subjected to IP with anti-myc antibodies (left). Of the total protein used for IP (left), 10% was used as input (right); this and coprecipitated CFTR were detected by immunoblot. SLC26A9 was detected by immunoblot with anti-myc; the doublet shown has been previously detected for both myc- and HA-tagged SLC26A9 (Dorwart et al., 2007). An immunoblot of actin was performed as a loading control (separate blot). Representative blots of three experiments are shown.
DISCUSSION
Significant, constitutive chloride secretion has been detected in the airways (e.g., Figs. 1 and 10), and this constitutive activity has been attributed to CFTR due to its absence in airway epithelia from CF patients as well as its partial inhibition by specific CFTR channel blockers. However, a mechanism for basal CFTR activity in the absence of added agonists has not been forthcoming. Our results have demonstrated that SLC26A9 exhibits the properties previously attributed to the constitutive activity of CFTR: it is active in the absence of cAMP/PKA-dependent agonists, it conducts chloride and contributes to transepithelial chloride currents, it displays linear I-V characteristics, and it is significantly inhibited by the CFTR pore blocker, GlyH-101. Furthermore, SLC26A9 appears to require functional CFTR to maintain significant activity at the apical membrane of airway epithelia. Finally, our results in the HEK 293 expression system show that the coexpression of SLC26A9 and wtCFTR confers enhanced forskolin-stimulated chloride currents, suggestive of a reciprocal regulatory interaction, as demonstrated between other SLC26A family proteins and CFTR (Ko et al., 2004).
Establishing a pharmacological fingerprint for SLC26A9
Determining a means for differentiating the contributions of SLC26A9 and CFTR to the chloride secretory currents was essential, as there was no definitive identifying feature in the constitutive activity of SLC26A9 expressed in HEK 293 cells (Figs. 2–5) that could be used to differentiate it from CFTR in HBE monolayers. Because GlyH-101 was known to inhibit basal currents in airway epithelia (Wang et al., 2005; Song et al., 2006), we evaluated its ability to interact with SLC26A9. GlyH-101 proved to be an effective inhibitor of SLC26A9, although the difference in the magnitude of inhibition, while statistically significant, was not sufficiently selective to permit differentiation of the contributions of SLC26A9 and CFTR to the currents across airway epithelia. However, the I-V relations during block were markedly different. The typical strong IR I-V relation seen during GlyH-101 inhibition of CFTR (Muanprasat et al., 2004) was nearly absent during its inhibition of SLC26A9 (Fig. 4 B). We calculated the ratio of the currents (RIV) to quantify the degree of nonlinearity in the I-V relations. The RIV values in Table I document the significant differences noted for SLC26A9 and CFTR. Thus, measurement of RIV during blocker application provided the needed fingerprint to examine the behavior of HEK 293 cells coexpressing SLC26A9 and CFTR, and ultimately HBE.
Coexpression of SLC26A9 with CFTR in HEK 293 cells
Cells coexpressing SLC26A9 and CFTR had both constitutive currents and enhanced currents in response to cAMP stimulation, as quantified during and after exposure to the cAMP agonist, forskolin (Fig. 6 D). Before forskolin stimulation, the magnitude of the constitutive current and the GlyH-101 inhibition fingerprint in coexpressors were indistinguishable from the responses measured for SLC26A9 alone (Fig. 5 and Table I), suggesting that the channels were acting independently in the absence of cAMP/PKA stimulation. In studies of the interaction between the electrogenic exchanger SLC26A3 or A6 and CFTR (Dorwart et al., 2008), pH measurements indicated that the exchangers were functional in the absence of stimulation, and CFTR activation enhanced not only the open probability (Po) of CFTR, but also the anion exchange rate of these SLC26A transporters. In our studies, the magnitude of the currents observed during forskolin stimulation in the coexpressors exceeded the sum of the currents measured from SLC26A9 and CFTR expressed separately (Fig. 6 D), suggesting that activation of CFTR indeed promoted functional channel interactions. Furthermore, coimmunoprecipitation experiments (Fig. 11) confirmed a physical interaction between these proteins in vivo. Thus, our results were consistent with these earlier observations.
To identify whether the activity of both channels increased during their stimulation-induced functional interaction, as noted above for SLC26A3/6, we looked to the blocker results. Interestingly, binding of the STAS domain of these SLC26A transporters to the phosphorylated R domain was shown to increase the Po of CFTR 2.2-fold (Ko et al., 2004). This magnitude of increase in CFTR activity alone could account for the enhanced forskolin-stimulated current of the SLC26A9 and CFTR coexpressors. Application of GlyH-101 during the forskolin-stimulated current plateau shifted the I-V relation from linear to IR (Fig. 7), but cells coexpressing SLC26A9 + CFTR demonstrated significantly less nonlinearity than cells expressing CFTR alone (Fig. 7, B and D, and Table I). Also, the magnitude of current inhibition in the coexpressors (65%) was significantly less than that observed for inhibition of CFTR alone (90%), and was not different from the inhibition of SLC26A9 alone (71%). These results indicated that current flowed through both SLC26A9 and CFTR during stimulation. If the enhanced response of the stimulated coexpressors was due entirely to an increase in the Po of CFTR, we would expect the magnitude of GlyH-101 inhibition and its RIV properties to mirror the properties observed for CFTR alone because the prestimulation current for SLC26A9 was relatively small (Fig. 6 D). Rather, the GlyH-101 inhibition results support a role for increased activity of SLC26A9 during CFTR stimulation.
Additional evidence that SLC26A9 activity was modified by an interaction with stimulated CFTR was provided by the enhanced poststimulation currents that persisted after forskolin washout (Fig. 6 A). As shown in Fig. 8, GlyH-101 effectively blocked the poststimulation current, and the inhibition magnitude and kinetics were similar to its actions on SLC26A9 alone (Fig. 4 A). Furthermore, the RIV for this inhibition was identical to that of SLC26A9 alone (Table I), suggesting that the enhanced poststimulation current was due entirely to SLC26A9. This current could result from increased SLC26A9 activity (Po) maintained by a continued interaction with CFTR after R domain dephosphorylation, or from the recruitment of additional SLC26A9 channels to the membrane during forskolin stimulation in the presence of CFTR. Either mechanism depends on CFTR stimulation, so that a lack of functional CFTR would impact SLC26A9 currents at the plasma membrane.
HBE responses reflect SLC26A9 properties
HBE cells harvested from both non-CF and CF donors expressed mRNA for both SLC26A9 and CFTR (Fig. 9). To probe the I-V relations of the monolayers against the blocker fingerprint identified in HEK 293 cells, it was necessary to electrically isolate the apical membrane. We optimized an α-toxin permeabilization protocol (Supplemental text) that left the basolateral membrane completely permeable to chloride, as assessed by reversing the chloride gradient direction, while leaving the monolayers responsive to forskolin stimulation (Fig. 10). Similar to the intact monolayer (Fig. 1), GlyH-101 blocked the constitutive chloride current in permeabilized HBE monolayers (Fig. 10 A), and the RIV during inhibition remained linear (Table II). After GlyH-101 inhibition, the addition of forskolin resulted in only a small increase in current, but the RIV nonetheless shifted significantly to IR (Table II), consistent with activation of CFTR and confirming that the properties of the constitutive current were like those of SLC26A9.
The degree of nonlinearity was mild and more closely matched the results from HEK cells coexpressing SLC26A9 and wtCFTR than those expressing CFTR alone. The reduced degree of nonlinearity for all monolayer RIV measurements (Table II) as compared with the same protocols in HEK 293 cells (Table I) appears to reflect the I-V properties of the paracellular pathway because values quite similar to those observed in the HEK coexpressors were noted (Tables I and II) after subtraction of the estimated paracellular current component. In particular, the shift toward IR observed on the addition of forskolin to GlyH-101–inhibited monolayers was amplified after adjustment for GP.
Potential blocker variability
One concern with the use of blocker response as a channel identifier in these assays is that the blocker effectiveness could be modified by the interaction between CFTR and SLC26A9. First, we note that earlier studies using glibenclamide demonstrated that it was equally effective at inhibiting the forskolin-stimulated currents in HEK cells expressing CFTR alone as in cells coexpressing electrogenic SLC26A transporters and CFTR (Ko et al., 2004), and at the same concentration used in our studies. Second, we demonstrated that GlyH-101 inhibition of the poststimulation current in HEK 293 cells coexpressing both CFTR and SLC26A9 (Fig. 8) results in the same RIV and magnitude of inhibition as seen in cells expressing SLC26A9 alone (Fig. 4 A and Table I), even though this current required CFTR stimulation. Thus, the properties of GlyH-101 inhibition of SLC26A9 would not appear to be altered by its functional interaction with CFTR. Third, the changes in RIV in HEK 293 cells (Table I) and HBE monolayers (Table II) support a shift toward greater IR upon activation of CFTR in the presence of GlyH-101, consistent with CFTR contributing the greater nonlinearity. Finally, the RIV values measured in HEK cells coexpressing SLC26A9 plus CFTR are the approximate averages of the values measured in the cells expressing the channels individually for both glibenclamide and GlyH-101 (Table I). Thus, our data supports the concept that a summation of the voltage-dependent properties of the blocker effects provides the simplest explanation for the aggregate RIV behavior of the coexpressed channels, rather than modification of blocker efficacy.
ΔF508-CFTR alters SLC26A9 behavior
Permeabilized ΔF508-CFTR HBE monolayers lacked both constitutive currents and a response to forskolin, as in prior studies (Smith and Welsh, 1992). The addition of blockers did not affect the magnitude of the small transepithelial current observed after permeabilization or the associated RIV. Thus, although the RT-PCR results indicated that CF HBE expressed SLC26A9 mRNA (Fig. 9), the absence of CFTR at the apical membrane correlated with a lack of constitutive current. Similarly, HEK 293 cells coexpressing ΔF508-CFTR and SLC26A9 failed to demonstrate the RIV fingerprint identified in cells expressing SLC26A9 and/or wtCFTR (Tables I and III), although they displayed a small, transient basal current that bore the fingerprint of endogenous chloride channels. Forskolin had no effect on the RIV as well, in contrast to cells expressing wtCFTR (Table III). Thus, the HEK 293 system confirmed that coexpression of SLC26A9 with ΔF508-CFTR suppressed the function of both proteins at the plasma membrane.
These results suggest that ΔF508 CFTR has a negative impact on the overall activity of SLC26A9. Positive regulation of SLC26A9 and other SLC26A family members through an interaction with wtCFTR has been discussed above; this positive interaction is thought to occur at the plasma membrane because it is facilitated by the presence of Class I PDZ motifs in both proteins (Ko et al., 2004). Because ΔF508 CFTR does not traffic to the plasma membrane (Cheng et al., 1990), its interaction with SLC26A9 might be expected to occur at the level of the ER, and our coimmunoprecipitation results (Fig. 11) confirm that SLC26A9 associates with both immature and mature CFTR. Because immature ΔF508 CFTR is delivered to the proteasome for degradation and SLC26A9 appears to be associated with it, SLC26A9 may also be sequestered in the ER and targeted for degradation. Finally, although expression of SLC26A9 alone in HEK 293 cells produced constitutive currents, this may occur because high levels of expression overwhelm the cell's endogenous traffic regulatory and/or quality control mechanisms. The question of whether SLC26A9 can function as a chloride channel in the absence of endogenously expressed wtCFTR will be explored in future studies.
Potential functions of SLC26A9 in the airway epithelia
Constitutive chloride conductances with properties similar to SLC26A9 have been demonstrated in various native tissues, such as human trachea (Smith and Welsh, 1992), bronchus (Coakley et al., 2003), and nasal (Paradiso et al., 2003) surface epithelium, porcine trachea and small airway epithelia (Wang et al., 2005), porcine and human submucosal glands (Song et al., 2006), and the serous cell submucosal gland cell line Calu-3 (Krouse et al., 2004). In all cases, these currents have been attributed to spontaneous activity of CFTR. These observations, combined with our findings, suggest that SLC26A9 contributes significantly to constitutive anion secretion by both airway gland and surface epithelia, and thus may be an important modulator of ASL volume and pH regulation. The absence of constitutive currents in tissues from CF patients, together with our data suggesting that SLC26A9 is not functional at the plasma membrane when coexpressed with ΔF508-CFTR, implies that SLC26A9 contributes to the airway pathology observed in CF.
Members of the SLC26A family are found in all epithelia known to express CFTR, and they demonstrate a diverse range of functions that appear to be specific for the physiological requirements of the organ systems where they are expressed: bicarbonate transport in the pancreas and intestine, acid regulation in the gastric parietal cells, and as demonstrated here, constitutive chloride secretion in the airway. As a family of transport proteins whose functions coordinate with the activity of CFTR, they support the hypothesis of CFTR as a transmembrane conductance regulator.
Acknowledgments
The authors wish to thank Drs. Michael Butterworth and Mike Myerburg for helpful discussions on HBE transepithelial current measurements, as well as Chloe King, Joe Latoche, and Erin McKenna for excellent technical assistance.
Resources providing support for this work include the National Institutes of Health (DK68196 and DK72506) and the Cystic Fibrosis Foundation (CFF R883-CR02).
Angus C. Nairn served as editor.
Footnotes
Abbreviations used in this paper: ASL, airway surface liquid; CF, cystic fibrosis; DIDS, 4,4′-diisothiocyanatostilbene-2,2' disulfonic acid; GFP, green fluorescent protein; HBE, human bronchial epithelial; Im, membrane current; IP, immunoprecipitation; IR, inward-rectified/rectification; OR, outward-rectified/rectification; RIV, I-V ratio; Rm, membrane resistance; RP, reverse transcriptase; wt, wild-type.
References
- Bhakdi S., Weller U., Walev I., Martin E., Jonas D., Palmer M. 1993. A guide to the use of pore-forming toxins for controlled permeabilization of cell membranes.Med. Microbiol. Immunol. (Berl.). 182:167–175 [DOI] [PubMed] [Google Scholar]
- Cheng S.H., Gregory R.J., Marshall J., Paul S., Souza D.W., White G.A., O'Riordan C.R., Smith A.E. 1990. Defective intracellular transport and processing of CFTR is the molecular basis of most cystic fibrosis.Cell. 63:827–834 [DOI] [PubMed] [Google Scholar]
- Coakley R.D., Grubb B.R., Paradiso A.M., Gatzy J.T., Johnson L.G., Kreda S.M., O'Neal W.K., Boucher R.C. 2003. Abnormal surface liquid pH regulation by cultured cystic fibrosis bronchial epithelium.Proc. Natl. Acad. Sci. USA. 100:16083–16088 [DOI] [PMC free article] [PubMed] [Google Scholar]
- Devor D.C., Pilewski J.M. 1999. UTP inhibits Na+ absorption in wild-type and DeltaF508 CFTR-expressing human bronchial epithelia.Am. J. Physiol. 276:C827–C837 [DOI] [PubMed] [Google Scholar]
- Devor D.C., Singh A.K., Lambert L.C., DeLuca A., Frizzell R.A., Bridges R.J. 1999. Bicarbonate and chloride secretion in Calu-3 human airway epithelial cells.J. Gen. Physiol. 113:743–760 [DOI] [PMC free article] [PubMed] [Google Scholar]
- Dorwart M.R., Shcheynikov N., Wang Y., Stippec S., Muallem S. 2007. SLC26A9 is a Cl channel regulated by the WNK kinases.J. Physiol. 584:333–345 [DOI] [PMC free article] [PubMed] [Google Scholar]
- Dorwart M.R., Shcheynikov N., Yang D., Muallem S. 2008. The solute carrier 26 family of proteins in epithelial ion transport.Physiology (Bethesda). 23:104–114 [DOI] [PubMed] [Google Scholar]
- Fischer H., Widdicombe J.H. 2006. Mechanisms of acid and base secretion by the airway epithelium.J. Membr. Biol. 211:139–150 [DOI] [PMC free article] [PubMed] [Google Scholar]
- Hallows K.R., Kobinger G.P., Wilson J.M., Witters L.A., Foskett J.K. 2003. Physiological modulation of CFTR activity by AMP-activated protein kinase in polarized T84 cells.Am. J. Physiol. 284:C1297–C1308 [DOI] [PubMed] [Google Scholar]
- Hille B. 2001. Ion Channels of Excitable Membranes. Third edition Sinauer Associates, Sunderland, MA: 814 pp [Google Scholar]
- Ishibashi K., Okamura K., Yamazaki J. 2008. Involvement of apical P2Y2 receptor-regulated CFTR activity in muscarinic stimulation of Cl- reabsorption in rat submandibular gland.Am. J. Physiol. 294:R1729–R1736 [DOI] [PubMed] [Google Scholar]
- Ko S.B.H., Shcheynikov N., Choi J.Y., Luo X., Ishibashi K., Thomas P.J., Kim J.Y., Kim K.H., Lee M.G., Naruse S., Muallem S. 2002. A molecular mechanism for aberrant CFTR-dependent HCO3- transport in cystic fibrosis.EMBO J. 21:5662–5672 [DOI] [PMC free article] [PubMed] [Google Scholar]
- Ko S.B.H., Zeng W., Dorwart M.R., Luo X., Kim K.H., Millen L., Goto H., Naruse S., Soyombo A., Thomas P.J., Muallem S. 2004. Gating of CFTR by the STAS domain of SLC26 transporters.Nat. Cell Biol. 6:343–350 [DOI] [PMC free article] [PubMed] [Google Scholar]
- Krouse M.E., Talbott J.F., Lee M.M., Joo N.S., Wine J.J. 2004. Acid and base secretion in the Calu-3 model of human serous cells.Am. J. Physiol. 287:L1274–L1283 [DOI] [PubMed] [Google Scholar]
- Lohi H., Kujala M., Makela S., Lehtonen E., Kestila M., Saarialho-Kere U., Markovich D., Kere J. 2002. Functional characterization of three novel tissue-specific anion exchangers SLC26A7, -A8, and -A9.J. Biol. Chem. 277:14246–14254 [DOI] [PubMed] [Google Scholar]
- Ma T., Thiagarajah J.R., Yang H., Sonawane N.D., Folli C., Galietta L.J.V., Verkman A.S. 2002. Thiazolidinone CFTR inhibitor identified by high-throughput screening blocks cholera toxin-induced intestinal fluid secretion.J. Clin. Invest. 110:1651–1658 [DOI] [PMC free article] [PubMed] [Google Scholar]
- Muanprasat C., Sonawane N.D., Salinas D., Taddei A., Galietta L.J.V., Verkman A.S. 2004. Discovery of glycine hydrazide pore-occluding CFTR inhibitors: mechanism, structure-activity analysis, and in vivo efficacy.J. Gen. Physiol. 124:125–137 [DOI] [PMC free article] [PubMed] [Google Scholar]
- Ostedgaard L.S., Shasby D.M., Welsh M.J. 1992. Staphylococcus aureus alpha-toxin permeabilizes the basolateral membrane of a Cl(-)-secreting epithelium.Am. J. Physiol. 263:L104–L112 [DOI] [PubMed] [Google Scholar]
- Paradiso A.M., Coakley R.D., Boucher R.C. 2003. Polarized distribution of HCO3- transport in human normal and cystic fibrosis nasal epithelia.J. Physiol. 548:203–218 [DOI] [PMC free article] [PubMed] [Google Scholar]
- Poulsen J.H., Fischer H., Illek B., Machen T.E. 1994. Bicarbonate conductance and pH regulatory capability of cystic fibrosis transmembrane conductance regulator.Proc. Natl. Acad. Sci. USA. 91:5340–5344 [DOI] [PMC free article] [PubMed] [Google Scholar]
- Reddy M.M., Quinton P.M. 2003. Control of dynamic CFTR selectivity by glutamate and ATP in epithelial cells.Nature. 423:756–760 [DOI] [PubMed] [Google Scholar]
- Romero M., Chang M.-H., Plata C., Zandi-Nejad K., Mercado A., Broumand V., Sussman C.R., Mount D.B. 2006. Physiology of electrogenic SLC26 paralogues. Epithelial Anion Transport in Health and Disease: the Role of the SLC26 Transporters Family. John Wiley & Sons Inc., New York: 126–147 [PubMed] [Google Scholar]
- Schultz B.D., Singh A.K., Devor D.C., Bridges R.J. 1999. Pharmacology of CFTR chloride channel activity.Physiol. Rev. 79:109–144 [DOI] [PubMed] [Google Scholar]
- Schwiebert E.M., Benos D.J., Egan M.E., Stutts M.J., Guggino W.B. 1999. CFTR is a conductance regulator as well as a chloride channel.Physiol. Rev. 79:145–166 [DOI] [PubMed] [Google Scholar]
- Sheppard D.N. 2004. CFTR channel pharmacology: novel pore blockers identified by high-throughput screening.J. Gen. Physiol. 124:109–113 [DOI] [PMC free article] [PubMed] [Google Scholar]
- Smith J.J., Welsh M.J. 1992. cAMP stimulates bicarbonate secretion across normal, but not cystic fibrosis airway epithelia.J. Clin. Invest. 89:1148–1153 [DOI] [PMC free article] [PubMed] [Google Scholar]
- Song Y., Salinas D., Nielson D.W., Verkman A.S. 2006. Hyperacidity of secreted fluid from submucosal glands in early cystic fibrosis.Am. J. Physiol. 290:C741–C749 [DOI] [PubMed] [Google Scholar]
- Sun F., Mi Z., Condliffe S.B., Bertrand C.A., Gong X., Lu X., Zhang R., Latoche J.D., Pilewski J.M., Robbins P.D., Frizzell R.A. 2008. Chaperone displacement from mutant cystic fibrosis transmembrane conductance regulator restores its function in human airway epithelia.FASEB J. 22:3255–3263 [DOI] [PMC free article] [PubMed] [Google Scholar]
- Tarran R., Grubb B.R., Gatzy J.T., Davis C.W., Boucher R.C. 2001. The relative roles of passive surface forces and active ion transport in the modulation of airway surface liquid volume and composition.J. Gen. Physiol. 118:223–236 [DOI] [PMC free article] [PubMed] [Google Scholar]
- Thomas P., Smart T.G. 2005. HEK293 cell line: a vehicle for the expression of recombinant proteins.J. Pharmacol. Toxicol. Methods. 51:187–200 [DOI] [PubMed] [Google Scholar]
- Wang X., Zhang Y., Amberson A., Engelhardt J.F. 2001. New models of the tracheal airway define the glandular contribution to airway surface fluid and electrolyte composition.Am. J. Respir. Cell Mol. Biol. 24:195–202 [DOI] [PubMed] [Google Scholar]
- Wang X., Lytle C., Quinton P.M. 2005. Predominant constitutive CFTR conductance in small airways.Respir. Res. 6:7–19 [DOI] [PMC free article] [PubMed] [Google Scholar]
- Wills N.K., Lewis S.A., Eaton D.C. 1979. Active and passive properties of rabbit descending colon: a microelectrode and nystatin study.J. Membr. Biol. 45:81–108 [DOI] [PubMed] [Google Scholar]
- Wine J.J. 2006. Acid in the airways. Focus on “Hyperacidity of secreted fluid from submucosal glands in early cystic fibrosis”.Am. J. Physiol. Cell Physiol. 290:C669–C671 [DOI] [PubMed] [Google Scholar]
- Worrell R.T., Butt A.G., Cliff W.H., Frizzell R.A. 1989. A volume-sensitive chloride conductance in human colonic cell line T84.Am. J. Physiol. 256:C1111–C1119 [DOI] [PubMed] [Google Scholar]
- Xu J., Henriksnas J., Barone S., Witte D., Shull G.E., Forte J.G., Holm L., Soleimani M. 2005. SLC26A9 is expressed in gastric surface epithelial cells, mediates Cl-/HCO3- exchange, and is inhibited by NH4+.Am. J. Physiol. Cell Physiol. 289:C493–C505 [DOI] [PubMed] [Google Scholar]
- Yonath J., Civan M.M. 1971. Determination of the driving force of the Na+ pump in toad bladder by means of vasopressin.J. Membr. Biol. 5:366–385 [DOI] [PubMed] [Google Scholar]