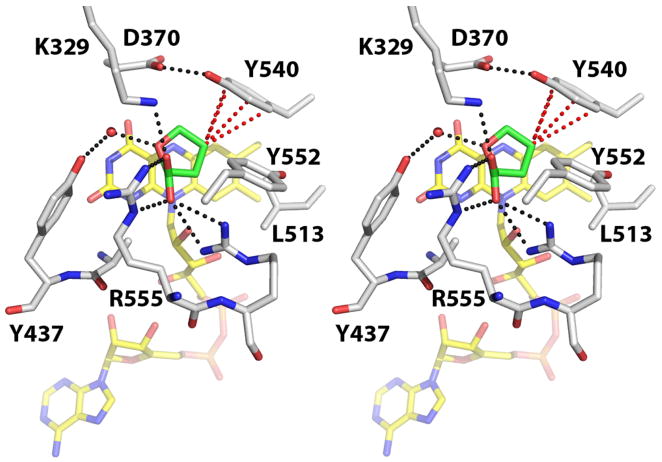
Figure 1.
Stereographic view of the active site of PutA86-669 complexed with THFA (PDB entry 1TIW). The FAD cofactor and THFA are colored yellow and green, respectively. Red dotted lines indicate close contacts (within 4.0 Å) between the C4 atom of THFA and the side chain of Tyr540. Black dotted lines indicate favorable electrostatic interactions. This figure and others were created with PyMOL (38).

