Abstract
Tissue engineered substitutes consisting of cells in biocompatible materials undergo remodeling with time as a result of cell growth and death processes. With inert matrices that do not directly influence cell growth, remodeling is driven mainly by the concentration of dissolved oxygen (DO). Insulin-secreting cell lines encapsulated in alginate-based beads and used as a pancreatic substitute represent such a case. Beads undergo remodeling with time so that an initially homogeneous distribution of cells is eventually replaced by a dense peripheral ring of primarily viable cells, whereas inner cells are mostly necrotic. This paper develops and analyzes a mathematical model of an encapsulated cell system of spherical geometry that tracks the viable and dead cell densities and the concentration of DO within the construct as functions of radial position and time. Model simulations are compared with experimental histology data on cell distribution. Correlations are then developed between the average intrabead DO concentration (AIDO) and the total viable cell number, as well as between AIDO and the radial cell and DO distributions in beads. As AIDO can be measured experimentally by incorporating a perfluorocarbon emulsion in the beads and acquiring 19F nuclear magnetic resonance (NMR) spectroscopic data, these correlations can be used to track the remodeling that occurs in the construct in vitro and potentially in vivo. The usefulness of mathematical models in describing the dynamic changes that occur in tissue constructs with time, and the value of these models at obtaining additional information on the system when used interactively with experimental measurements, are discussed.
Keywords: βTC insulinomas, Pancreatic substitute, Encapsulated cells, 19F NMR, Tissue modeling
1. Introduction
The engineering of living tissues, or tissue engineering, involves the use of living cells, manipulated through their extracellular environment or genetically, to develop biological substitutes for implantation into the body and/or to foster the remodeling of tissue in some other active manner (Nerem and Sambanis, 1995). Tissue substitutes often consist of cells in hydrogel materials, such as collagen, agarose, or calcium alginate, in appropriate three-dimensional (3D) configurations that enable cell and construct function and permit handling of the substitute for in vitro manipulations and in vivo implantation. Substitutes may undergo significant remodeling with time, especially when the cells can proliferate in the matrix environment. Remodeling occurs as a result of cell growth and death processes and does not necessarily involve cell migration within the matrix (Constantinidis et al., 1999; Stabler et al., 2001, 2002). The matrix itself may directly affect the cellular growth kinetics and the type of remodeling that occur, as is the case with proliferative βTC mouse insulinomas encapsulated in calcium alginate/poly-l-lysine/alginate (APA) beads made using high guluronic alginate (Constantinidis et al., 1999; Stabler et al., 2001). Although plausible explanations for the observed effects have been proposed, the precise mechanism remains unclear. On the other hand, with permissive matrices which do not inhibit cell growth, there exists ample experimental evidence that cellular reorganization is driven by the concentration of available oxygen. For example, βTC insulinomas encapsulated and homogeneously distributed in APA beads made with permissive high manuronic alginate, form, after a period of 14–16 days, a dense peripheral ring of mainly viable cells, whereas inner cells are mostly necrotic (Stabler et al., 2001). This type of remodeling occurs because, as cells at the bead periphery—where oxygen is more abundant—grow, oxygen gradients across the bead radius become steeper, hence inner cells are exposed to increasingly hypoxic conditions and eventually die.
To directly monitor the dynamic changes that occur in tissue constructs with time, in vitro and post-implantation in vivo, our group has been developing methods based on nuclear magnetic resonance (NMR) imaging and spectroscopy. While NMR imaging allows the assessment of structural features of the construct, localized NMR spectroscopy enables the evaluation of the number of viable cells and of the cellular metabolic state in a volume of interest (VOI) contained within the construct (Constantinidis and Sambanis, 1998; Constantinidis et al., 2001, 2002; Burg et al., 2002; Stabler et al., 2005a, b). For instance, the resonance of total cellular choline, measured by water-suppressed 1H NMR spectroscopy, correlates positively and linearly with the viable cell number, hence it is a reliable estimate of the latter (Long et al., 2000; Stabler et al., 2005a, b). The resonances of intracellular metabolites measured by 31P NMR, which include nucleotide triphosphates and phosphorylcholine, offer an assessment of the cellular bioenergetic status (Constantinidis and Sambanis 1995, 1998).
Due to the sensitivity of the 1H nucleus, 1H NMR spectroscopy can be performed both in vitro and in vivo. On the other hand, 31P NMR spectra have, thus far, been obtained from tissue engineered constructs only in vitro (Constantinidis and Sambanis 1995, 1998; Constantinidis et al., 2001, 2002; Stabler et al., 2005a, b). To indirectly assess the cellular metabolic state, one could alternatively use measurements of dissolved oxygen (DO) concentration within the construct. Indeed, DO is a critical parameter determining many aspects of cell function, including viability, metabolism and protein secretion (Dionne et al., 1989, 1991, 1993; Mukundan et al., 1995; Papas et al., 1996, 1997, 1999b). Given this importance of oxygen, our laboratory, as well as others (McGovern et al., 1993; Noth et al., 1999), are developing NMR-based methods to measure DO concentration in tissue constructs by incorporating a perfluorocarbon emulsion in the hydrogel. Using the linear correlation between DO concentration and the inverse of the T1 relaxation of 19F (McGovern et al., 1993; Noth et al., 1999) the average oxygen concentration in a VOI can be measured. It should be noted that 19F is the second most sensitive nucleus after 1H and there is no significant amount of 19F normally present in tissues, hence 19F NMR spectroscopy is particularly suitable for constructs in NMR-compatible bioreactors and in vivo situations.
As a construct remodels, the distributions of viable cells, cellular metabolic states, and DO change with time. To evaluate these distributions non-invasively, one could collect spectra from a series of VOIs within the construct using chemical shift imaging in one, two, or possibly three dimensions, as previously reported in one dimension in vitro with encapsulated cells (Constantinidis and Sambanis 1995; Papas et al., 1999a, b; Long et al., 2000). However, even if feasible, these are time-consuming techniques with limited applicability especially in vivo due to cost and the long anesthesia times required for experimental animals. Since collecting signal from the entire tissue construct is a more rapid process, a methodology that permits an evaluation of the cellular and oxygen distributions from concentration measurements averaged over the entire construct, or by measuring the overall metabolic activity of the construct, would thus be highly desirable.
In this paper, we present the development of a quantitative mathematical model describing the cellular remodeling and changes in DO profile when proliferative cells are encapsulated in hydrogel beads. The model considers only a permissive material, which does not directly influence cell growth and in which remodeling of the cell distribution occurs only in response to the available oxygen. Model parameters were representative of mouse insulinoma βTC cells in permissive high manuronic calcium alginate beads. This encapsulated cell system constitutes a model pancreatic substitute appropriate for in vitro and small animal in vivo experiments (Papas et al., 1999a, b; Stabler et al., 2001; Black et al., 2006). Model solutions on changes of the cellular and oxygen profiles with time are first presented and compared with experimental results. Importantly, the model was also used in a reverse fashion, specifically to decipher cell and oxygen distributions—both critical in determining the functional ability of a construct—from measurements of the average oxygen concentration in the tissue substitute or of the total oxygen consumption rate by the construct. The use of the model in synergy with experimental measurements to obtain spatial information on intra-construct gradients, and the significance of such information, are discussed.
2. Mathematical model and assumptions
A number of assumptions were incorporated in the development of the model and are listed below. These assumptions were based on experimental data collected with βTC3 mouse insulinoma cells encapsulated in calcium alginate and agarose matrices (Constantinidis and Sambanis 1995, 1998; Constantinidis et al., 2001, 2002; Stabler et al., 2005a, b). Hence, the assumptions are realistic for this and likely other similar systems of proliferative cells in inert permissive hydrogels.
DO is the only nutrient that limits cell proliferation. Thus, all other essential nutrients are assumed to be in excess throughout the construct.
Spatial constraints are the only other factor besides DO concentration that limits the rate and extent of cell proliferation within the construct.
Cells do not migrate within the matrix, hence the observed remodeling in cell distribution is due entirely to cellular growth and death at each locale. This is supported by the fact that cells do not attach to alginate hydrogels without modification of the alginate by grafting adhesion molecules (Alsberg et al., 2001; Rowley and Mooney, 2002).
The values of the model parameters, including the effective diffusivity of DO through the encapsulated system, remain constant over the time period of the simulations.
There is no external boundary layer effect. This is a reasonable assumption for systems in which there is significant velocity of the medium relative to the surface of the beads, as is the case in perfusion bioreactors where beads are retained in place while medium flows through the bed.
The model equations for spherical geometry are as follows:
| (1) |
| (2) |
In the above equations, t is time and r is radial position in the construct; C(r,t) and X(r,t) are the concentration of oxygen and the cell density, respectively, as functions of radial position and time; Deff is the effective oxygen diffusivity; S(r, t) is the rate of oxygen consumption per unit volume as a function of radial position and time; and μg and μd are the specific cell growth and death rates, respectively. Eqs. (1) and (2) need two initial and two boundary conditions to be solved, which are given as follows:
| (3) |
| (4) |
| (5) |
| (6) |
The expressions used for the kinetics of oxygen consumption by the cells, cell growth and cell death are as follows:
| (7) |
| (8) |
| (9) |
In the above equations, μg,max and μd,max are the maximum specific growth and death rates, respectively; μd,min is the minimum death rate, which prevails under an abundance of oxygen; Kg and Kd are Monod model parameters; and Xmax in the maximum cell density that can be accommodated in the construct. The ratio X/Xmax is thus the fractional maximum occupancy at a particular locale in the construct.
The cumulative number of dead cells D(r,t) as a function of time and position can be obtained by integrating over time the specific death rate multiplied by the cell density, as in the following equation:
| (10) |
2.1. Baseline model parameters
Baseline parameter values for the above mathematical model are representative of βTC3 mouse insulinoma cells encapsulated in calcium alginate beads and are listed in Table 1. The continuous βTC3 cell line, a member of the βTC family of insulinomas established by Efrat and co-workers (Efrat et al., 1988, 1995; Efrat, 1999), has been extensively studied by our group and others both as such and following alginate encapsulation as a model tissue-engineered pancreatic substitute (Papas et al., 1996, 1997, 1999a, b; Stabler et al., 2001).
Table 1.
Baseline parameter values used in simulating the spatio-temporal profiles of cells and oxygen in a system of βTC3 cells encapsulated in spherical calcium alginate/poly-l-lysine/alginate (APA) beads
| Parameter | Value | Reference | |
|---|---|---|---|
| Effective diffusivity | Deff | 1.4 cm2/day | Tziampazis and Sambanis (1995), Mehmetoglu et al. (1996), Stabler (2004) |
| Maximum O2 consumption | νmax | 2.88 mmloe/(day × 109 cells | Tziampazis and Sambanis (1995) |
| Monod parameter–O2 | Km | 0.01mM | Tziampazis and Sambanis (1995) |
| Maximum specific growth rate | μg, max | 0.35 day−1 | Monolayer growth rate (Stabler et al., 2001) |
| Maximum specific death rate | μd, max | 1.4dat−1 | Graeber et al. (1996) |
| Minimum specific death rate | μd, min | 0.00273 day−1 | Tziampazis et al. (unpublished) |
| Monod Kg | 0.01mM | parameter–growth Tziampazis et al. (unpublished) | |
| Monod Kd | 0.001mM | parameter–death Tziampazis et al. (unpublished) | |
| Maximum cell density | Xmax | 9 × 10⁸ cells/ml | Calculated based on a 10 μm diameter cell |
The maximum oxygen consumption rate, νmax, and parameter Km were estimated from reported results for encapsulated βTC3 cells as 2 μmole/(min 109 cells) and 0.01mM, respectively (Wohlpart et al., 1990; Mukundan et al., 1995; Tziampazis and Sambanis, 1995). The maximum specific death rate μd,max was estimated using published rates of hypoxia-induced apoptosis. Oncogenically transformed cells (with wild-type p53) exposed to low DO concentrations (<0.0001mM) had an approximate 15% viability after 24 h (Graeber et al., 1996), which corresponds to a specific death rate of 1.9 day−1. The p53 gene status of βTC3 cells is not known. Thus, for the mathematical model presented here, a conservative maximum specific death rate of 1.4 day−1 was assumed. The maximum specific growth rate was estimated from growth rates observed in T-flask experiments where death is negligible. In particular, T-175 flasks seeded with βTC3 cells at a surface density corresponding to 35 cm2 became confluent (at 175 cm2) in 5 days, which results in a specific growth rate of 0.32 day−1. Thus, a value of 0.35 day−1 was used for a maximum growth rate. This estimate is also compatible with data from freshly encapsulated cells (Stabler et al., 2001), in which the glucose consumption rate (GCR) doubled over a period of 50 h. Although the per cell GCR depends on the DO concentration, encapsulated cells are all well oxygenated before remodeling occurs (Tziampazis and Sambanis, 1995; Stabler et al., 2001), hence GCR is a measure of viable cell number under these conditions. In the sensitivity analysis section of this paper, the effect of μg,max and μd,max on the steady-state cell and DO profiles is investigated.
To estimate the maximum cellular density, Xmax, which can be accommodated in the calcium alginate matrix, βTC3 cells were assumed to be 10 μm in diameter. At this diameter, the maximum viable cell density with no void space is 1.9 × 10⁹ cells/ml. To account for space occupied by the matrix, for dead cells, and for voids revealed by histology even after extensive cell growth (Constantinidis et al., 1999; Papas et al., 1999a; Stabler et al., 2001), the baseline value of Xmax was set equal to 1/2 of the theoretical maximum, or 9 × 10⁸ cells/ml. A sensitivity analysis was also performed on the effect of changing Xmax from its baseline value in regards to the resulting cell and oxygen profiles.
The effective diffusivity of oxygen Deff in cell-loaded alginate beads was estimated as follows. Using the Wilke–Chang equation, the oxygen diffusivity in water at 37 °C is calculated to be 1.8 × 10⁻³ cm2/min (Tziampazis and Sambanis, 1995). Oxygen diffusivity is lower in cell-free and, more so, cell-containing alginate beads (Sambanis and Tan, 1999). In cell-free alginate beads, the oxygen diffusivity was found to be 1.53 × 10⁻³cm2/min (Mehmetoglu et al., 1996). In cell-containing beads, reported values of the effective oxygen diffusivity range from 0.764 × 10⁻³ to 1.39 × 10⁻³ cm2/min (Tziampazis and Sambanis, 1995; Mehmetoglu et al., 1996). An intermediate value of 0.972 × 10⁻³ cm2/min, or 1.4 cm2/day, was chosen for the simulations in this study. It should be noted that, since Deff depends on cell density, it likely changes with time at a particular radial position in the beads as remodeling occurs. In this initial study, however, a constant value of Deff-independent of time and position—was assumed; a sensitivity analysis was performed by changing Deff from its baseline value for all positions within the bead.
2.2. Numerical methods
The steady-state solution was calculated numerically using finite difference equations programmed in MatLab software. Accuracy was verified by ensuring that the solution did not change by decreasing Δr.
The transient model equations were also solved using finite difference equations programmed in MatLab. Convergence of the calculations was ensured by keeping the Δt component much smaller than Δr (Kreyszig, 2003). Specifically, for all simulations presented here the following relationship was maintained:
The accuracy of the simulations was then verified by: (i) ensuring that the transient solution after 150 days closely approximated the steady-state solution, and (ii) confirming that the solution did not change by decreasing Δr.
3. Results
3.1. Steady-state solution
The steady-state oxygen and cell density profiles were calculated by setting the time derivatives equal to zero. Hence, Eq. (1) was reduced to
| (11) |
and Eq. (2) to
| (12) |
Substituting Eqs. (8) and (9) in Eq. (12), the following is obtained:
| (13) |
By a simple algebraic manipulation, the cell density, X(r), is found as a function of C(r) resulting in the following equation:
| (14) |
Eq. (14) was then substituted in Eq. (11) and the resulting equation was solved numerically. Results are shown in Fig. 1A and B for a 1.0mm diameter bead and external DO concentrations of 0.20 and 0.06mM, respectively. The DO concentration of 0.20mM corresponds to normal incubator conditions, while 0.06mM is representative of the peritoneal environment. The cellular profile in Fig. 1A illustrates the viable cell ring at the periphery which has been observed experimentally by histological sectioning of the beads (Constantinidis et al., 1999; Papas et al., 1999a; Stabler et al., 2001).
Fig. 1.
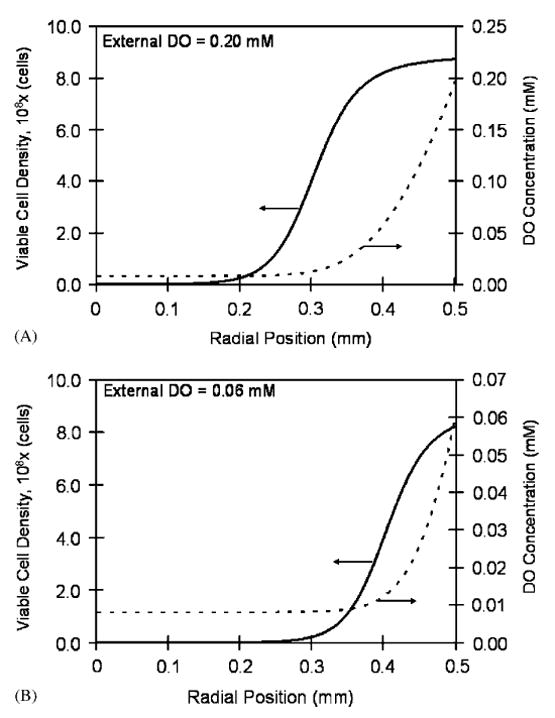
Steady-state viable cell density and DO profiles in a 1.0mm diameter bead at two external DO concentrations: (A) external DO equal to 0.20mM. At the periphery (radial position equal to 0.5mm), the cell density reaches 8.74 × 10⁸ cells/ml due to the high DO concentration (0.20mM). The cell density declines towards the center of the bead attaining its lowest value of 1.8 × 10⁵ cells/ml at the center where the DO concentration is 0.008mM. (B) External DO equal to 0.06mM. The maximum cell density at the periphery is 8.23 × 10⁸ cells/ml. At the center where the oxygen concentration is 0.008mM, the cell density declines to 5.0 × 10³ cells/ml.
Reported results on the effect of oxygen on the βTC3 cell line indicated that cellular metabolism shifts to enhanced anaerobic glycolytic activity below 0.032mM (25mmHg), whereas insulin secretion becomes inhibited as DO is reduced to 0.01mM (7mmHg) or lower (Papas et al., 1996). As seen in Fig. 1, for beads exposed to 0.20mM external DO, 0.032mM DO occurs at a position approximately 136 μm from the bead's periphery, and the lower 0.01mM DO occurs at 224 μm from the periphery. Hence, at steady state, 2% of the cells have their secretory capacity compromised under these conditions. On the other hand, with beads exposed to 0.06mM external DO, the DO concentration reached 0.032 and 0.01mM only 37 and 124 μm, respectively, from the bead's periphery. Thus, in this case, 6% of the cells have their secretory capacity compromised. The steady-state oxygen profiles correspond to average intrabead DO concentrations (AIDO) of 0.073 and 0.020mM for 0.20 and 0.06mM external DO, respectively. The average viable cell densities in the beads are 6.52 × 10⁸ and 3.88 × 10⁸ cells/ml and the total cell numbers are 3.41 × 10⁵ and 2.03 × 10⁵ cells/bead for the high and low value of the external DO, respectively.
3.2. Sensitivity analysis of the steady-state solution
A sensitivity analysis was performed to evaluate the effect Deff on the steady-state viable cell density and DO concentration in beads. Figs. 2A and B show the simulated steady-state cell density and DO profiles, respectively, at an external DO concentration of 0.20mM and with values of Deff ranging from 1.0 to 2.0 cm2/day. As the diffusivity was increased, the thickness of the dense peripheral band of cells also increased and oxygenated conditions extended to longer distances from the bead periphery. Decreasing Kd caused the cell density profile to become steeper (results not shown). Parameter Kg had little effect on the steady-state solutions. In regards to the maximum specific growth and death rates, Eq. (14) indicates that it is the ratio of these two parameters that determines the viable cell distribution in beads. Fig. 3(A) and (B) shows the sensitivity of the steady-state cell and oxygen profiles for different values of μg,max/μd,max around the baseline value of 0.25. The effect of the two oxygen consumption parameters, νmax and Km, on the steady-state solutions was comparable to previous reported findings (Bassom et al., 1997; Radisic et al., 2006) and was as follows. Increasing νmax resulted in steeper cell density gradients and a decrease in the number of viable cells that could be supported towards the center, as oxygen concentrations quickly reached hypoxic levels away from the bead periphery. Similarly, increasing νmax resulted in sharper DO gradients. Changing Km from the baseline value had little effect on the viable cell and DO profiles compared to νmax (results not shown).
Fig. 2.
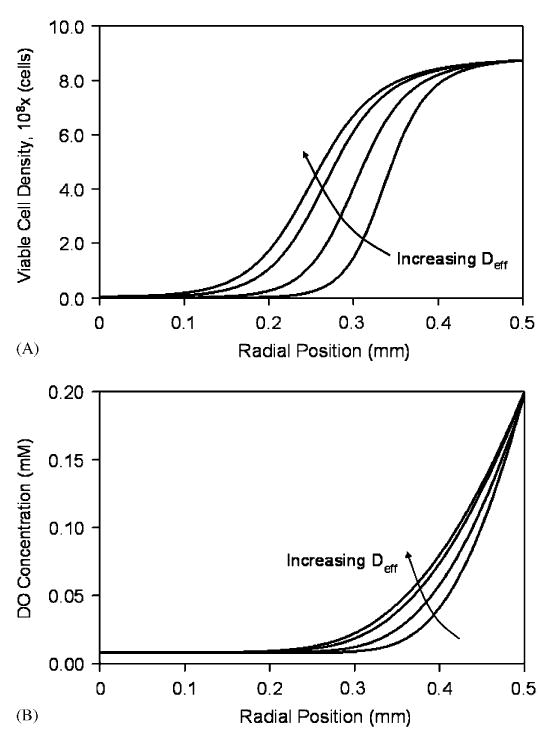
Sensitivity analysis of the steady-state cell (A) and DO (B) distributions in a 1.0mm diameter bead at 0.20mM external DO for effective diffusivity values of 1.0, 1.4, 1.8, and 2.0 cm2/day.
Fig. 3.
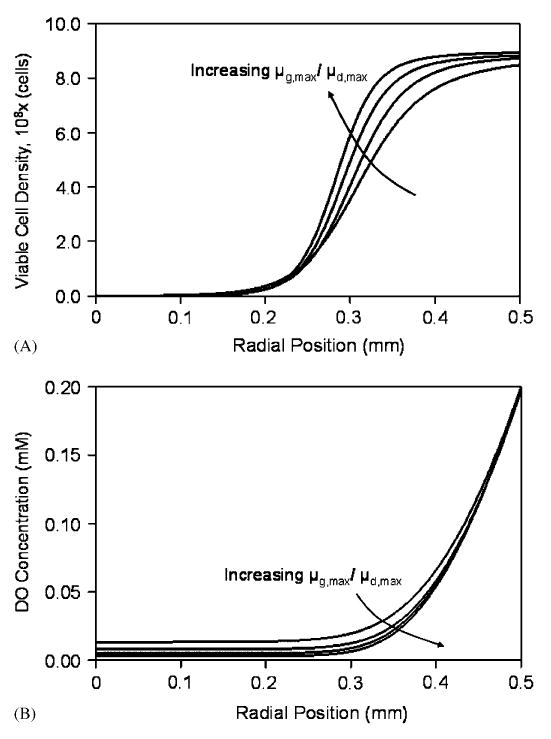
Sensitivity analysis of the steady-state cell (A) and DO (B) distributions in a 1.0mm diameter bead at 0.20mM external DO for μg,max/μd,max values of 0.125, 0.25, 0.5, and 1.0.
To investigate the sensitivity of steady-state solutions to Xmax, model solutions were obtained with this parameter increased and decreased by 50% from the baseline value. Changes in Xmax influence primarily the cell density close to the bead periphery, as the cell density closer to the center is determined mainly by the DO concentration. Thus, increasing Xmax resulted in steeper cell density profiles and, conversely, decreasing Xmax made the steady-state cell density distribution more homogeneous (results not shown).
3.3. Unsteady-state solutions
Using the parameters listed in Table 1, the changes in cellular and oxygen profiles in spherical geometry were tracked over 30 days. Fig. 4(A) and (B) illustrate the radial changes in cell density and DO concentration starting from a uniform cell density of 5 × 10⁷ cells/ml alginate and a uniform DO concentration of 0.20mM. Initially, the DO concentration throughout the bead is sufficient to facilitate cell proliferation regardless of radial position (Fig. 4(A) and (B), days 1–5). However, as the cell density at the periphery increases, the DO concentration towards the center of the bead decreases, consequently the number of cells that can be supported at this locale also decreases. The proliferation of cells at the periphery continues until spatial constraints are reached, whereas at positions closer to the center the equilibrium cell density is determined by the equilibrium DO concentration (Fig. 4(A) and (B), days 5–30). Comparing the steady- and unsteady-state solutions, the viable cell number in a bead reaches 95% of its steady-state value within 16 days. This is consistent with the growth profiles observed experimentally, where the total metabolic activity of a culture reaches a plateau after approximately 15 days (Stabler et al., 2001). Fig. 4C shows the spatio-temporal accumulation of dead cells in the beads. Interestingly, the highest accumulation of dead cells at later time points occurs not at the center of the beads, but at intermediate radial positions.
Fig. 4.
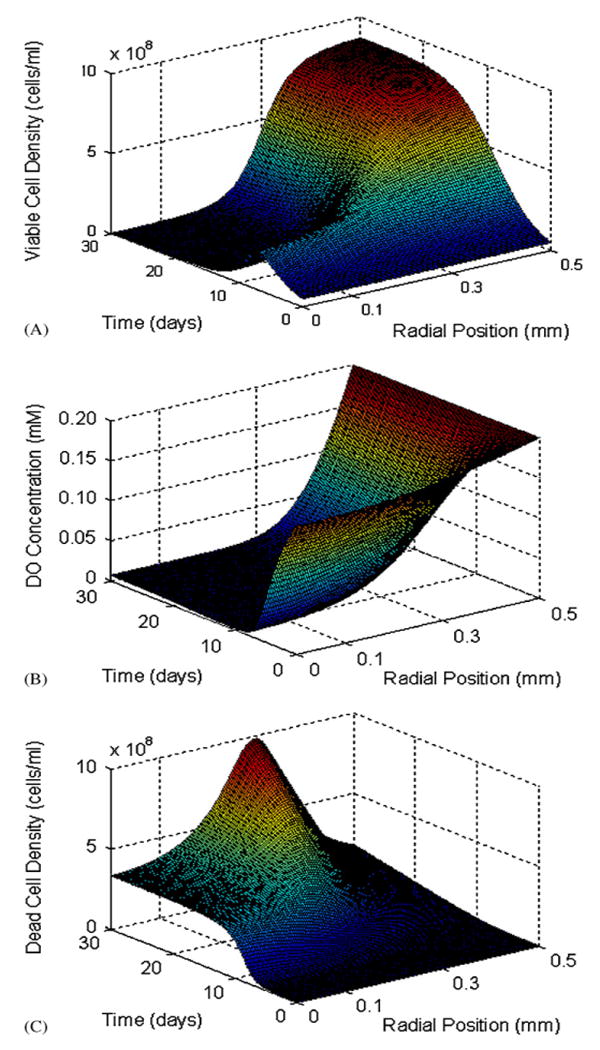
(A) Changes in viable cell density as functions of the radial position in a 1.0mm diameter bead and time. At the periphery, the cell density increases until spatial constraints are reached, while densities towards the center are determined by the DO concentration. (B) Changes in DO concentration as functions of the radial position and time. Oxygen remains abundant at the periphery, but declines towards hypoxic levels towards the center of the construct. (C) Time and space profile of the accumulation of dead cells over 30 days. The external DO concentration is 0.20mM.
Implant antigens exiting the bead are thought to be recognized by the host and invoke an immune response via the indirect antigen presentation pathway (Mikos et al., 1998). Antigens are released in the capsule as a result of cellular death and lysis, possibly also protein secretion. For this reason, the accumulation of dead cells was tracked using Eq. (10) for two different initial cell densities (1.0 and 10 × 107 cells/ml) and at external DO concentrations of 0.20 and 0.06mM. The temporal accumulation of dead cells in beads is shown, along with the corresponding accumulation of viable cells, in Figs. 5A and B. At both external DO concentrations, the rates of dead cell accumulation reached the same values irrespective of initial cell density (1.1 × 10⁴ cells/day at 0.20mM external DO (Fig. 5A), and 1.3 × 10⁴ cells/day at 0.06mM external DO (Fig. 5B)), as shown by the equal slopes of the lines at later time points in the simulations. However, at the DO concentration of 0.20mM, the beads with the higher initial cell density reached 95% of the steady-state dead cell accumulation rate within 10 days, whereas the beads started with the lower initial cell density reached the 95% value on day 18. The times to reach 95% of the steady-state rate were somewhat higher at the lower external DO, and they were equal to 13 and 23 days for the high and low initial cell densities, respectively.
Fig. 5.
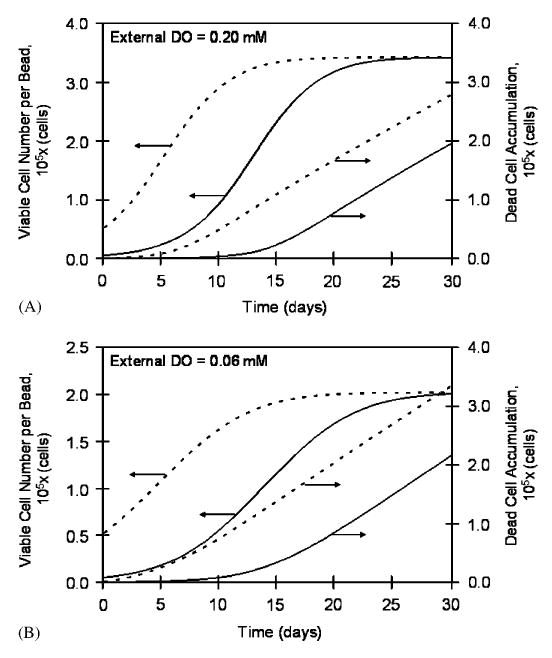
Viable cell number and accumulated dead cells in a 1.0mm diameter bead as a function of time for 0.20mM (A) and 0.06mM (B) external DO concentrations. At each external DO concentration, simulations were performed with two initial cell densities—1.0 and 10 × 107 cells/ml. All constructs eventually attain the same viable cell number per bead and rate of cell death (equal slopes of the accumulated dead cells vs. time curves); however, the total number of accumulated dead cells correlates positively with the initial loading density.
As is seen in Eqs. (7)–(9) above, the final viable cell number within a construct is a function of both the available oxygen and spatial constraints. Because of this relationship, the total viable cell number and the viable cell distribution within a bead are the same at steady state for a given external DO, irrespective of the initial cell density. Figs. 5A and B show the temporal profiles of the viable cell numbers in a bead at two different external oxygen concentrations—0.20 and 0.06mM—and two initial densities (1 and 10 × 107 cells/ml). At each external DO, the cell number plateaued at the same level, irrespective of initial conditions. Reducing the external DO by 70%, or from 0.20 to 0.06mM, decreased the steady-state viable cell number by 59%. This difference in percentages is due to the spatial constraints. When oxygen is more abundant (0.20mM), the cells at the periphery are predominantly affected by the spatial constrains, while at lower oxygen levels the DO concentration is the major contributor to the steady-state cell density throughout the bead, including the periphery.
Simulated changes in cellular distribution were compared against experimental data obtained with βTC3 mouse insulinomas encapsulated in high mannuronic alginate APA beads and reported by Stabler et al. (2001). Initially, the cells were homogeneously distributed in the beads, but with time in culture the cells proliferated at the periphery creating a ring of cells at the bead's edge. Histological data on the cell distribution on days 1, 7, 16 and 29 post-encapsulation (Stabler et al., 2001) are in agreement with the model-predicted cell redistribution at these time points. Furthermore, the model-predicted thickness of the cell ring is in agreement with experimentally measured values by MR imaging (Simpson et al., 2006).
3.4. Experimentally useful correlations
To investigate whether measurements of the AIDO, which are acquired through a single T1 NMR relaxation from an entire bead, could offer information on the number and distribution of cells and on the DO gradients in a bead, pertinent correlations were developed and the following graphs were constructed. Fig. 6 shows the total viable cell number in a bead vs. AIDO for different initial cell densities and for two DO concentrations in the surrounding medium. For a given external DO, all points fall on the same curve, irrespective of the initial cell density. Time is a parameter along each curve. Thus, these graphs demonstrate that with a given external DO, an AIDO value uniquely identifies the number of viable cells within a construct, irrespective of the initial cell density. It should be noted that similar correlations are obtained when the viable cell number is plotted vs. the total oxygen consumption rate (OCR) exhibited by a certain number of beads (results not shown). The latter can be measured in vitro when the beads are in a perfusion bioreactor with DO sensors positioned upstream and downstream of the bed (Papas et al., 1999a, b). With beads implanted in experimental animals, however, OCR cannot be measured and AIDO is the useful measurement.
Fig. 6.
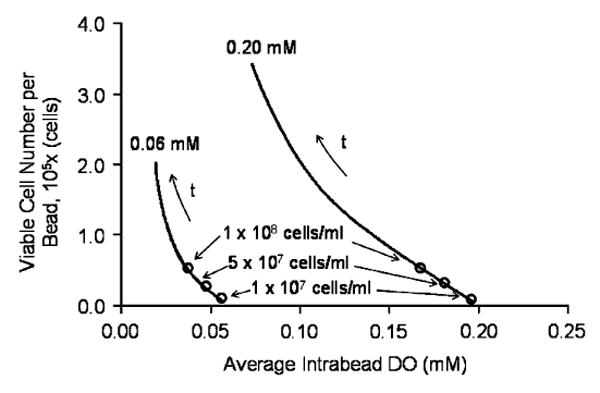
Correlation between the total viable cell number in a bead and the average intrabead dissolved oxygen concentration (AIDO) for two external DO levels. For a given external DO, the correlation is independent of the initial cell density. Time (t) is a parameter along the trajectories.
To evaluate whether AIDO could offer information on the cell distribution within a bead for a particular external DO, the distances from the bead periphery to the points at which the cell density dropped to 50% and 90% of the peripheral cell density—which is the maximum in the bead—were adopted as measures indicative of cell distribution. Fig. 7 shows this distance as a function of AIDO for two external DO concentrations. Each curve was obtained by performing calculations with different initial cell densities and again all points fell on the same curve, irrespective of the initial density; time is a parameter along each curve. When the distance is 0.5mm, i.e. it extends all the way to the bead center, this means that the cell density is relatively uniform and does not drop to either 50% or 90% of the maximal even at the bead center. This occurs with fresh bead preparations, in which oxygen-driven remodeling has not yet occurred and for which AIDO is relatively high. However, as the density of cells close to the periphery increases, the position of 50% and 90% maximum cell density shifts closer to the bead's edge. Additionally, the AIDO decreases while this redistribution occurs. Hence, this correlation can be used to assess the cell distribution in the bead from experimentally measured AIDO. It should be noted that similar correlations are obtained when the measures of cell distribution are plotted vs. the OCR exhibited by a certain number of beads (results not shown).
Fig. 7.
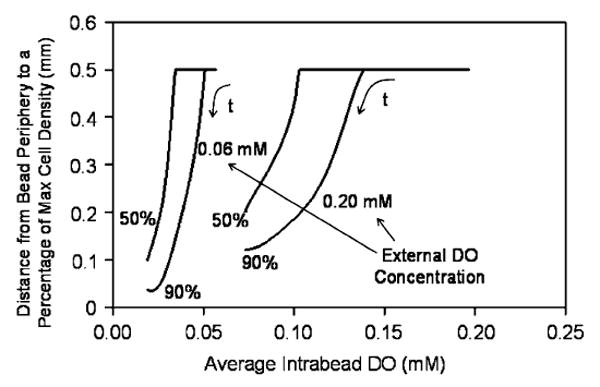
Correlation between a measure of the cellular distribution in beads (distance from the periphery to the points corresponding to 50% and 90% of maximum viable cell density) and AIDO for two external DO levels. For a given external DO, the correlation is independent of the initial cell density. Time (t) is a parameter along the trajectories.
To determine the correlation between the oxygen profile and the AIDO, the distances from the bead's edge to the radial positions at which the DO concentration is 20% and 50% of the external DO (indicative of intrabead DO distribution) were plotted against AIDO. As is seen in Fig. 8, at a high AIDO, the DO concentration within the bead is everywhere higher than 20% and 50% of the external DO, hence the plotted distance extends to the center of the bead. However, as the AIDO decreases, so does the distance from the periphery to which 20% and 50% of external DO is reached. Thus, as with cell distribution, experimentally measured AIDOs can be used to assess the DO distribution in this encapsulated cell system. Again, similar correlations are obtained when the measures of DO distribution are plotted vs. the OCR of a certain number of beads (results not shown).
Fig. 8.
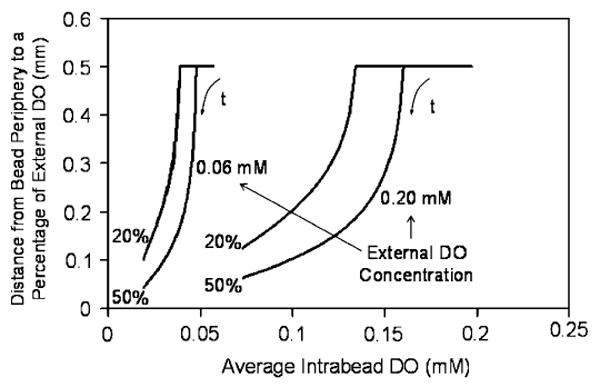
Correlation between a measure of the DO distribution in beads (distance from the periphery to the points corresponding to 20% and 50% of the external DO concentration) and AIDO for two external DO levels. For a given external DO, the correlation is independent of the initial cell density. Time (t) is a parameter along the trajectories.
4. Discussion
Understanding the oxygen-driven remodeling in tissue-engineered substitutes in general and encapsulated cell systems in particular is essential in determining how tissue constructs will ultimately function. The mathematical model developed in this paper simulated the microenvironment within a spherical pancreatic substitute in regards to the cell and oxygen profiles. The surrounding DO concentration and spatial constraints were the two parameters that had the greatest influence over the final cell distribution. The influence of the DO concentration and spatial constraints parameters were seen in the sensitivity analysis. For the simulations presented here, external mass transport limitations were not accounted for, which is a reasonable approximation for perfusion and well mixed in vitro culture systems. On the other hand, boundary layer effects are likely to be present in vivo, with beads implanted extravascularly, such as intraperitoneally, in experimental animal models. The maximum oxygen consumption rate νmax dictated the distance to which DO could diffuse before being reduced to hypoxic levels. The maximum cell density, Xmax, also influenced the cell profile, specifically the cell density within 200 μm of the construct's edge. After approximately 15 days, equilibrium was essentially reached, where the rate of cell growth equaled the rate of cell death at all radial positions. The simulated growth profile and cellular remodeling closely matched data from βTC insulinoma cells encapsulated in high mannuronic, growth permissive alginate beads. Simulating cellular remodeling within non-permissive materials would require additional constraints within the mathematical equations. As the precise nature of the cell–material interactions for non-permissive matrices is currently unclear, a robust mechanistic model describing such a system cannot be presently developed.
Given the strong dependence of cell viability and insulin secretion on the DO concentration a cell experiences, the ability to non-invasively monitor DO concentration profiles would be beneficial in determining how a construct is functioning in vivo. For instance, in experiments with diabetic small animal models, an animal is made diabetic by an injection of streptozotocin, a chemical which specifically destroys the insulin-secreting β cells of the pancreas; a tissue engineered substitute is then implanted and its efficacy is evaluated by monitoring blood glucose levels during normal feeding or glucose injection episodes. However, the implant itself is evaluated only at the end of the experiment when the animal is euthanized and the construct is explanted. Non-invasive monitoring of cell viability and construct function on the same animal during the course of an experiment is thus especially useful in establishing an important link between implantation and end-point physiologic effects. Monitoring the DO concentration in a tissue substitute offers an indirect but clear indication of cell function within the construct.
Previous literature demonstrated the capacity of 19F and 1H NMR spectroscopy to quantify oxygen concentrations and the number of viable cells in a VOI, respectively. Nonetheless, determining the local DO concentrations and viable cell number using chemical shift imaging requires a significant amount of time that may limit in vivo applications. We have demonstrated in this paper the feasibility of using a mathematical model to evaluate cellular and oxygen profiles from a single 19F NMR measurement (AIDO), which can be performed relatively quickly.
For a given external DO, the AIDO uniquely identified the viable cell number per bead irrespective of the initial cell density (i.e. a construct with 2 × 10⁸ viable cells had the same AIDO regardless of whether it started with 1 × 10⁷ or 5 × 10⁷ cells/ml). At lower external DO concentrations, the correlation between AIDO and viable cell number becomes more difficult to discern, in the sense that a certain change in AIDO corresponds to a larger difference in viable cell number. However, if AIDO measurements are used in combination with 1H NMR measurements performed on the same VOI, it is reasonably expected that a more accurate assessment of viable cell number can be made.
For a given external DO, cellular and DO profiles were also uniquely identified by the AIDO regardless of initial cell density. Indeed, at higher AIDO concentrations, the cell density is low and homogeneous enough to allow proliferation throughout the bead, and a drop to 90% of maximum density or below is not attained. Similarly, at a low cell density the oxygen consumption is not sufficient to reduce the DO concentration to less than 50% of the external DO. At lower external DO concentrations, the measures of cell and DO distribution become more difficult to decipher from an AIDO measurement, as small changes in AIDO correspond to large changes of the distributions.
Tissue-engineered constructs are fabricated in many shapes and sizes, and the modeling framework presented here can be easily adapted to other construct geometries. Simulations for a disk-shaped construct of the type reported by Stabler et al. (2005a, b) have also been performed (results not shown), and there was generally good agreement between simulated and experimentally measured viable cell numbers over a 14-day period. For the disk-shaped construct, too, AIDO could be used to assess viable cell number and cell and DO distributions for a given external DO through correlations similar to those shown in Figs. 6–8.
Current work in our laboratory involves further validating the model by measuring the intra-bead DO distribution in vitro using magnetic resonance techniques. The model will then be applied to in vitro and in vivo experimental systems in order to assess the viable cell number and cell and DO distributions from non-invasive measurements of AIDO by 19F NMR.
Acknowledgments
This work was supported by grants from the ERC Program of the National Science Foundation under Award no. EEC-9731643, and the NIH (DK47858). Additionally, JDG wishes to acknowledge the financial support received from NSF IGERT-0221600.
Footnotes
Publisher's Disclaimer: This article was originally published in a journal published by Elsevier, and the attached copy is provided by Elsevier for the author's benefit and for the benefit of the author's institution, for non-commercial research and educational use including without limitation use in instruction at your institution, sending it to specific colleagues that you know, and providing a copy to your institution's administrator.
All other uses, reproduction and distribution, including without limitation commercial reprints, selling or licensing copies or access, or posting on open internet sites, your personal or institution's website or repository, are prohibited. For exceptions, permission may be sought for such use through Elsevier's permissions site at: http://www.elsevier.com/locate/permissionusematerial
References
- Alsberg E, Anderson KW, et al. Cell-interactive alginate hydrogels for bone tissue engineering. J Dent Res. 2001;80(11):2025–2029. doi: 10.1177/00220345010800111501. [DOI] [PubMed] [Google Scholar]
- Bassom AP, Ilchmann A, et al. Oxygen diffusion in tissue preparations with Michaelis–Menten kinetics. J Theor Biol. 1997;185(1):119–127. doi: 10.1006/jtbi.1996.0298. [DOI] [PubMed] [Google Scholar]
- Black SP, Constantinidis I, et al. Immune responses to an encapsulated allogeneic islet beta-cell line in diabetic NOD mice. Biochem Biophys Res Commun. 2006;340(1):236–243. doi: 10.1016/j.bbrc.2005.11.180. [DOI] [PubMed] [Google Scholar]
- Burg KJ, Delnomdedieu M, et al. Application of magnetic resonance microscopy to tissue engineering: a polylactide model. J Biomed Mater Res. 2002;61:380–390. doi: 10.1002/jbm.10146. [DOI] [PubMed] [Google Scholar]
- Constantinidis I, Sambanis A. Towards the development of artificial endocrine tissues: 31P NMR spectroscopic studies of immunoisolated, insulin-secreting AtT-20 cells. Biotechnol Bioeng. 1995;47:431–443. doi: 10.1002/bit.260470404. [DOI] [PubMed] [Google Scholar]
- Constantinidis I, Sambanis A. Non-invasive monitoring of tissue engineered constructs by nuclear magnetic resonance methodologies. Tissue Eng. 1998;4:9–17. doi: 10.1089/ten.2005.11.404. [DOI] [PubMed] [Google Scholar]
- Constantinidis I, Rask I, et al. Effects of alginate composition on the metabolic, secretory, and growth characteristics of entrapped beta TC3 mouse insulinoma cells. Biomaterials. 1999;20(21):2019–2027. doi: 10.1016/s0142-9612(99)00104-0. [DOI] [PubMed] [Google Scholar]
- Constantinidis I, Long RC, Jr, et al. Non-invasive monitoring of a bioartificial pancreas in vitro and in vivo. Ann N Y Acad Sci. 2001;944:83–96. doi: 10.1111/j.1749-6632.2001.tb03825.x. [DOI] [PubMed] [Google Scholar]
- Constantinidis I, Stabler CL, et al. Noninvasive monitoring of a retrievable bioartificial pancreas in vivo. Ann N Y Acad Sci. 2002;961:298–301. doi: 10.1111/j.1749-6632.2002.tb03106.x. [DOI] [PubMed] [Google Scholar]
- Dionne KE, Colton CK, et al. Effect of oxygen on isolated pancreatic tissue. ASAIO Trans. 1989;35(3):739–741. doi: 10.1097/00002480-198907000-00185. [DOI] [PubMed] [Google Scholar]
- Dionne KE, Colton CK, et al. A microperifusion system with environmental control for studying insulin secretion by pancreatic tissue. Biotechnol Prog. 1991;7(4):359–368. doi: 10.1021/bp00010a011. [DOI] [PubMed] [Google Scholar]
- Dionne KE, Colton CK, et al. Effect of hypoxia on insulin secretion by isolated rat and canine islets of Langerhans. Diabetes. 1993;42(1):12–21. doi: 10.2337/diab.42.1.12. [DOI] [PubMed] [Google Scholar]
- Efrat S. Genetically engineered pancreatic beta-cell lines for cell therapy of diabetes. Ann N Y Acad Sci. 1999;875:286–293. doi: 10.1111/j.1749-6632.1999.tb08511.x. [DOI] [PubMed] [Google Scholar]
- Efrat S, Linde S, et al. Beta-cell lines derived from transgenic mice expressing a hybrid insulin gene-oncogene. Proc Natl Acad Sci USA. 1988;85(23):9037–9041. doi: 10.1073/pnas.85.23.9037. [DOI] [PMC free article] [PubMed] [Google Scholar]
- Efrat S, Fusco-DeMane D, et al. Conditional transformation of a pancreatic beta-cell line derived from transgenic mice expressing a tetracycline-regulated oncogene. Proc Natl Acad Sci USA. 1995;92(8):3576–3580. doi: 10.1073/pnas.92.8.3576. [DOI] [PMC free article] [PubMed] [Google Scholar]
- Graeber TG, Osmanian C, et al. Hypoxia-mediated selection of cells with diminished apoptotic potential in solid tumours. Nature. 1996;379(6560):88–91. doi: 10.1038/379088a0. [DOI] [PubMed] [Google Scholar]
- Kreyszig E. Advanced Engineering Mathematics. Wiley; New York: 2003. [Google Scholar]
- Long RC, Jr, Papas KK, et al. In vitro monitoring of total choline levels in a bioartificial pancreas: 1H NMR spectroscopic studies of the effects of oxygen level. J Magn Reson. 2000;146:49–57. doi: 10.1006/jmre.2000.2112. [DOI] [PubMed] [Google Scholar]
- McGovern KA, Schoeniger JS, et al. Gel-entrapment of perfluorocarbons: a fluorine-19 NMR spectroscopic method for monitoring oxygen concentration in cell perfusion systems. Magn Reson Med. 1993;29:196–204. doi: 10.1002/mrm.1910290207. [DOI] [PubMed] [Google Scholar]
- Mehmetoglu U, Ates S, et al. Oxygen diffusivity in calcium alginate gel beads containing gluconobacter suboxydans. Artif Cells Blood Substit Immobil Biotechnol. 1996;24(2):91–106. doi: 10.3109/10731199609118877. [DOI] [PubMed] [Google Scholar]
- Mikos AG, McIntire LV, et al. Host response to tissue engineered devices. Adv Drug Deliv Rev. 1998;33(12):111–139. doi: 10.1016/s0169-409x(98)00023-4. [DOI] [PubMed] [Google Scholar]
- Mukundan NE, Flanders PC, et al. Oxygen consumption rates of free and alginate-entrapped beta TC3 mouse insulinoma cells. Biochem Biophys Res Commun. 1995;210(1):113–118. doi: 10.1006/bbrc.1995.1634. [DOI] [PubMed] [Google Scholar]
- Nerem RM, Sambanis A. Tissue engineering: from biology to biological substitutes. Tissue Eng. 1995;1(1):3–13. doi: 10.1089/ten.1995.1.3. [DOI] [PubMed] [Google Scholar]
- Noth U, Grihn P, et al. 19F-MRI in vivo determination of the partial oxygen pressure in perfluorocarbon-loaded alginate capsules implanted into the peritoneal cavity and different tissues. Magn Reson Med. 1999;42:1039–1047. doi: 10.1002/(sici)1522-2594(199912)42:6<1039::aid-mrm8>3.0.co;2-n. [DOI] [PubMed] [Google Scholar]
- Papas KK, Long RC, Jr, et al. Effects of oxygen on metabolic and secretory activities of beta TC3 cells. Biochim Biophys Acta. 1996;1291(2):163–166. doi: 10.1016/0304-4165(96)00062-1. [DOI] [PubMed] [Google Scholar]
- Papas KK, Long RC, Jr, et al. Role of ATP and Pi in the mechanism of insulin secretion in the mouse insulinoma betaTC3 cell line. Biochem J. 1997;326(Part 3):807–814. doi: 10.1042/bj3260807. [DOI] [PMC free article] [PubMed] [Google Scholar]
- Papas KK, Long RC, Jr, et al. Development of a bioartificial pancreas: I. Long-term propagation and basal and induced secretion from entrapped betaTC3 cell cultures. Biotechnol Bioeng. 1999a;66(4):219–230. [PubMed] [Google Scholar]
- Papas KK, Long RC, Jr, et al. Development of a bioartificial pancreas: II. Effects of oxygen on long- term entrapped betaTC3 cell cultures. Biotechnol Bioeng. 1999b;66(4):231–237. [PubMed] [Google Scholar]
- Radisic M, Malda J, et al. Oxygen gradients correlate with cell density and cell viability in engineered cardiac tissue. Biotechnol Bioeng. 2006;93(2):332–343. doi: 10.1002/bit.20722. [DOI] [PubMed] [Google Scholar]
- Rowley JA, Mooney DJ. Alginate type and RGD density control myoblast phenotype. J Biomed Mater Res. 2002;60(2):217–223. doi: 10.1002/jbm.1287. [DOI] [PubMed] [Google Scholar]
- Sambanis A, Tan SA. Quantitative modeling of limitations caused by diffusion. In: Morgan JR, Yarmush ML, editors. Methods in Molecular Medicine, Tissue Engineering Methods and Protocols. Vol. 18. Humana Press Inc.; Totowa, NJ: 1999. [DOI] [PubMed] [Google Scholar]
- Simpson NE, Grant SC, et al. Biochemical consequences of alginate encapsulation: a NMR study of insulin-secreting cells. Biomaterials. 2006;27(12):2577–2586. doi: 10.1016/j.biomaterials.2005.11.042. [DOI] [PubMed] [Google Scholar]
- Stabler CL. Ph D thesis. Georgia Institute of Technology; Atlanta, Georgia: 2004. Development of non-invasive methods for monitoring tissue engineered constructs using nuclear magnetic resonance. [Google Scholar]
- Stabler C, Wilks K, et al. The effects of alginate composition on encapsulated betaTC3 cells. Biomaterials. 2001;22(11):1301–1310. doi: 10.1016/s0142-9612(00)00282-9. [DOI] [PubMed] [Google Scholar]
- Stabler CL, Sambanis A, et al. Effects of alginate composition on the growth and overall metabolic activity of betaTC3 cells. Ann N Y Acad Sci. 2002;961:130–133. doi: 10.1111/j.1749-6632.2002.tb03065.x. [DOI] [PubMed] [Google Scholar]
- Stabler CL, Long RC, Jr, et al. Noninvasive measurement of viable cell number in tissue-engineered constructs in vitro, using 1 H nuclear magnetic resonance spectroscopy. Tissue Eng. 2005a;11(3–4):404. doi: 10.1089/ten.2005.11.404. [DOI] [PubMed] [Google Scholar]
- Stabler CL, Long RC, Jr, et al. In vivo noninvasive monitoring of a tissue engineered construct using 1 H NMR spectroscopy. Cell Transplant. 2005b;14(2–3):139–149. doi: 10.3727/000000005783983197. [DOI] [PubMed] [Google Scholar]
- Tziampazis E, Sambanis A. Tissue engineering of a bioartificial pancreas: modeling the cell environment and device function. Biotechnol Prog. 1995;11(2):115–126. doi: 10.1021/bp00032a001. [DOI] [PubMed] [Google Scholar]
- Wohlpart D, Kirwan D, Gainer J. Effects of cell density and glucose and glutamine levels on the respiration rates of hybridoma cells. Biotechnol Bioeng. 1990;36:630–635. doi: 10.1002/bit.260360611. [DOI] [PubMed] [Google Scholar]


