

Abstract
Macromolecular assemblies play critical roles in regulating cellular functions. The cysteine synthase complex (CSC), which is formed by association of serine O-acetyltransferase (SAT) and O-acetylserine sulfhydrylase (OASS), acts as a sensor and modulator of thiol metabolism by responding to changes in nutrient conditions. Here we examine the oligomerization and energetics of formation of the soybean CSC. Biophysical examination of the CSC by size exclusion chromatography and sedimentation ultracentrifugation indicates that this assembly (complex Mr ∼ 330,000) consists of a single SAT trimer (trimer Mr ∼ 110,000) and three OASS dimers (dimer Mr ∼ 70,000). Analysis of the SAT-OASS interaction by isothermal titration calorimetry reveals negative cooperativity with three distinct binding events during CSC formation with Kd values of 0.3, 7.5, and 78 nm. The three binding events are also observed using surface plasmon resonance with comparable affinities. The stability of the CSC derives from rapid association and extremely slow dissociation of OASS with SAT and requires the C terminus of SAT for the interaction. Steady-state kinetic analysis shows that CSC formation enhances SAT activity and releases SAT from substrate inhibition and feedback inhibition by cysteine, the final product of the biosynthesis pathway. Cysteine inhibits SAT and the CSC with Ki values of 2 and 70 μm, respectively. These results suggest a new model for the architecture of this regulatory complex and additional control mechanisms for biochemically controlling plant cysteine biosynthesis. Based on previous work and our results, we suggest that OASS acts as an enzyme chaperone of SAT in the CSC.
Many cellular processes depend on the reversible and specific association of two or more proteins into macromolecular complexes. Multiprotein assemblies formed either transiently or permanently are involved in transcription, DNA replication, signal transduction, and metabolism (1-4). Unlike the wide-ranging examinations of protein-protein interactions in signal transduction pathways, relatively few studies have aimed to dissect the molecular details of multienzyme complexes in either primary or secondary metabolic pathways. In primary metabolism, protein-protein interactions can lead to formation of multiprotein complexes for optimal flux through a particular pathway. Although metabolic channeling of reactants between different enzyme active sites is the most recognized advantage of forming a macromolecular assembly, enzyme interactions in complexes can also have regulatory functions, as occurs in the cysteine biosynthesis pathway of plants and bacteria (5, 6).
Serine O-acetyltransferase (SAT)3 and O-acetylserine sulfhydrylase (OASS or O-acetylserine(thiol)lyase) comprise the two-step pathway for cysteine synthesis in plants and bacteria. Both enzymes interact to form the cysteine synthase complex (CSC) (7). Early studies showed that association of these proteins does not channel metabolites but alters the activity of each enzyme in the complex (8-12). These changes in enzymatic activities allow the CSC to function as a molecular sensor of intracellular sulfur conditions (13, 14). Upon complex formation SAT is activated and OASS is inactivated (9, 11). Under sulfur-sufficient conditions, O-acetylserine is converted to cysteine by free OASS, which is present in large excess in the cell. Under low sulfur conditions, OASS cannot catalyze cysteine production, and O-acetylserine accumulates in the cell. Elevated levels of O-acetylserine promote dissociation of the CSC to down-regulate SAT and increase expression of genes for sulfur assimilation from the environment. Because cysteine is the metabolic source of sulfur for all thiol-containing compounds in plants, the interplay between sulfur assimilation and cysteine biosynthesis modulated by the CSC has a central role in thiol metabolism and can affect a variety of cellular processes.
Multiple studies demonstrate interaction between OASS and SAT from plants and bacteria (10-12, 15-18), but the detailed molecular basis for formation of the CSC remains poorly understood. Little information is available about the structure of the CSC from either plants or bacteria. Using ultracentrifugation, Kredich et al. (7) determined a combined molecular weight of 310 for the CSC purified from Salmonella typhimurium and proposed that it contains one SAT hexamer and two OASS dimers. Later, size-exclusion chromatography studies of the plant CSC revealed a similar molecule weight but suggested an alternate model in which a homotetrameric SAT and two OASS dimers associate to form the macromolecular assembly (11). Subsequently, x-ray crystal structures of SAT from bacteria and OASS from bacteria and plants were determined (17, 19-22). The bacterial SAT appear to function as a homohexamer (monomer Mr ∼ 30-33) in which two trimers are arranged head-to-head with the C-terminal tails of each trimer at opposite ends of the hexamer (Fig. 1a). The C-terminal region of SAT is also the location of the active site. In plants and bacteria, OASS is organized as a homodimeric protein (monomer Mr ∼ 35-38) with each monomer active site containing a pyridoxal phosphate molecule forming a Schiff base with a catalytic lysine residue (Fig. 1b). Efforts to identify the SAT-OASS interaction site demonstrate that the C-terminal tail of SAT is critical for complex formation (10, 15, 23, 24). X-ray crystal structures of bacterial and plant OASS in complex with peptides corresponding to the C-terminal regions of their cognate SAT revealed that the OASS active site is the location of SAT binding (20, 23, 25) (Fig. 1b).
FIGURE 1.

Structural overview of SAT and OASS. a, ribbon diagram of a homology model of the soybean SAT trimer, based on E. coli SAT (22). A red sphere indicates the C-terminal tail of each monomer subunit. In the bacterial SAT structures, an additional 10-20 residues of each C-terminal tail are disordered beyond the residue indicated by the red sphere (21, 22). b, ribbon diagram of A. thaliana OASS (blue) with an A. thaliana SAT C-terminal peptide (gold) bound at each active site (23).
To date, biochemical studies provide only a partial view of assembly of the CSC from either plants or bacteria. Using a combination of biophysical approaches, we examine here the composition of a plant CSC and suggest a new model for the architecture of this regulatory macromolecular assembly. Analysis of the energetics and kinetics of CSC formation indicate that interaction of OASS and SAT is negatively cooperative and that association of the two enzymes relieves feedback inhibition by cysteine of SAT activity. Based on previous reports and our data, we suggest that OASS acts as an enzyme chaperone of SAT.
EXPERIMENTAL PROCEDURES
Reagents—All chemicals and reagents were of analytical grade and purchased from Sigma-Aldrich. The standard buffer is 20 mm Tris (pH 8.0), 0.2 m NaCl, 0.1 mm EDTA, 0.1 mm dithiothreitol, and 10% glycerol (v/v).
Protein Expression, Purification, and Assays—For all experiments the cytosolic forms of Glycine max (soybean) SAT (GenBank™ accession number AF452452.1; Ref. 27) and G. max OASS (GenBank™ accession number AF452451.1; Ref. 28) were used. Proteins were overexpressed in E. coli as His-tagged proteins using either pET-28c (Novagen) or pHIS8 (26) expression vectors and purified using nickel-affinity and size-exclusion chromatography (17). For size-exclusion chromatography, all proteins were chromatographed using a Sephadex S-200 26/60 fast protein liquid chromatography column, which was equilibrated in the standard buffer (flow rate 1 ml min-1). Calibration of the gel-filtration column used ribonuclease A (13.7 kDa), chymotrypsinogen A (25.0 kDa), ovalbumin (43.0 kDa), albumin (67.0 kDa), aldolase (158 kDa), and ferritin (440 kDa) from low and high molecular weight gel filtration calibration kits (GE Healthcare) under the same buffer conditions. Thrombin digestion was used to remove the His tag from each protein as necessary. To generate the C-terminal deletion mutants of G. max SAT lacking either the C-terminal isoleucine (CΔ1) or the last 10 amino acids (CΔ10), a stop codon was introduced at the appropriate position by QuikChange mutagenesis (Stratagene). Expression and purification of the deletion mutant was performed as for wild-type SAT. Assays of SAT and OASS were performed as previously described (17, 27, 28).
Analytical Ultracentrifugation—Sedimentation equilibrium experiments were performed using an Optima XL-A analytical ultracentrifuge equipped with absorbance optics with an An50Ti rotor (Beckman Inc.). Purified thrombin-cleaved OASS, SAT, and CSC were extensively dialyzed in the standard buffer. Sedimentation equilibrium studies were carried out at 10,000, 13,000, and 17,000 rpm at 25 °C using six-channel charcoal-filled centerpieces with quartz windows. All experiments were performed at two protein concentrations for each rotor speed. Equilibrium data were collected by scanning samples at A280 nm with spacing = 0.003 cm and an average of 4 scans per step. The partial specific volume and solvent density were calculated using SEDNTERP. The equilibrium data were edited using WinREEDIT program, and edited data sets were then analyzed by nonlinear least squares using program WINNONLIN. The molecular weights for OASS, SAT, and CSC were obtained by fitting the sedimentation equilibrium data to single species model as described previously (29).
Calorimetric Measurements—Isothermal titration calorimetry (ITC) experiments were performed using a VP-ITC calorimeter (Microcal, Inc). All purified thrombin-cleaved proteins were dialyzed extensively versus the standard buffer. All samples and buffers were degassed at room temperature before use. OASS (10-12 μl/injection) was added using a computer-controlled 250-μl microsyringe at an interval of 5-6 min into the sample solution containing SAT. Control experiments using buffer determined the heat of dilution for each injection. Data obtained from titrations were analyzed using either a single-site binding model (Equation 1) or a three-site sequential binding model (Equation 2),
 |
(Eq.1) |
 |
(Eq.2) |
where  is total
heat after the ith injection, V0 is the volume of
calorimetric cell, K1, K2, and
K3 are the observed equilibrium constants for each site,
P is the concentration of free OASS dimer, and
ΔH1, ΔH2, and
ΔH3 are the corresponding enthalpy changes. The
corresponding of Kobs and ΔH were obtained
by fitting the experimental data to either model using software provided by
the instrument manufacturer (Microcal, Inc.). The observed binding constants
were converted to change in free energy (ΔG) using
ΔG =-RTln Kobs, where R is the gas
constant (1.9872 cal K-1 mol-1) and T is
absolute temperature. Changes in entropy (ΔS) were calculated
using ΔG =ΔH-TΔS.
is total
heat after the ith injection, V0 is the volume of
calorimetric cell, K1, K2, and
K3 are the observed equilibrium constants for each site,
P is the concentration of free OASS dimer, and
ΔH1, ΔH2, and
ΔH3 are the corresponding enthalpy changes. The
corresponding of Kobs and ΔH were obtained
by fitting the experimental data to either model using software provided by
the instrument manufacturer (Microcal, Inc.). The observed binding constants
were converted to change in free energy (ΔG) using
ΔG =-RTln Kobs, where R is the gas
constant (1.9872 cal K-1 mol-1) and T is
absolute temperature. Changes in entropy (ΔS) were calculated
using ΔG =ΔH-TΔS.
Surface Plasmon Resonance—Real-time monitoring of the protein-protein interaction was performed with a BIAcore 2000 using a Ni2+-nitrilotriacetic acid sensor chip charged with Ni2+ (BIAcore). All experiments were performed at 25 °C in the standard buffer. Flow cell 1 lacking Ni2+ was the reference, which was subtracted from each binding isotherm before analysis. Flow cell 2 was charged by the addition of 0.5 m NiCl2 to the running buffer. Control experiments tested nonspecific binding of OASS to the nickel-coated surface and showed less than a1%(<30 response units) change in signal. Purified His-tagged soybean SAT (1.3 μm) was immobilized on the chip by constant injection of 10 μl min-1 over 200-400 s. The SAT-bound chip was washed twice with buffer (10 μl min-1 for 60 s). Multiple kinetic experiments were initiated by injection of purified thrombin-cleaved OASS (0.018-1.2 μm) in the running buffer (10 μl min-1). After the signal change was constant, buffer lacking OASS was used to initiate the dissociation phase. The experimental data were analyzed as described by O'Shannessy et al. (30) using Origin 7.0. Models for one-, two-, and three-site binding (Equations 3-5, respectively) were used to fit the observed data, as follows:
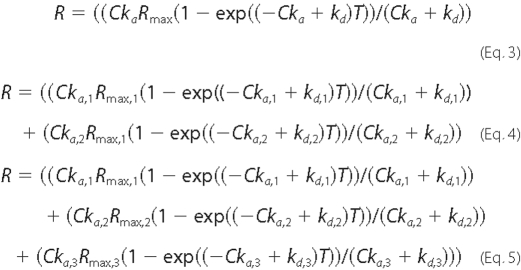
where C is the concentration of OASS dimer, T is temperature (K), R is the maximum response (response units), ka is the on-rate, and kd is the off-rate.
RESULTS
Oligomerization of the CSC and Its Components—For analytical analysis of the soybean CSC, size-exclusion chromatography and sedimentation equilibrium ultracentrifugation were used to determine the molecular weights of soybean SAT (27), OASS (28), and CSC. Compared with efforts to use the Arabidopsis thaliana SAT for these experiments, overexpression and purification of the soybean enzyme resulted in higher protein yields, better stability of the purified protein, and no detectable contamination of the preparation by E. coli OASS (data not shown).
Size-exclusion chromatography of soybean OASS shows an elution profile consistent with a homodimeric 70-kDa molecule (Fig. 2a, green), as previously observed for the Arabidopsis enzyme (17). This peak also exhibited an A412 nm signal due to the presence of pyridoxal phosphate in the active site. Analysis of the sedimentation equilibrium data for G. max OASS yields an estimated molecular mass of 74.2 ± 2.5 kDa, which is comparable with the 67.6 kDa calculated mass of the protein (Fig. 2b).
FIGURE 2.

Analytical characterization of OASS, SAT, and the CSC. a, size-exclusion chromatography of G. max OASS (green), G. max SAT (blue), and the G. max CSC (red). All proteins were analyzed as described under “Experimental Procedures.” Peaks marked with an asterisk showed A412 nm signal corresponding to the pyridoxal phosphate cofactor of OASS. The inset gel shows SDS-PAGE of the peak corresponding to the CSC. In the analysis of the CSC additional peaks represent unbound OASS dimer and SAT trimer. b, sedimentation equilibrium analysis of G. max OASS (1.5 and 3.0 μm). Data were fit globally to a single species model. c, sedimentation equilibrium analysis of G. max SAT (1.3 and 3.0 μm). Data were fit globally to a single species model. d, sedimentation equilibrium analysis of the G. max CSC. A 3:1 ratio of OASS dimer to SAT trimer was used. Experimental data at two rotor speeds (13,000 and 17,000 rpm) are shown. Data were fit to a single species model. a.u., absorbance units.
The size-exclusion elution profile of soybean SAT (Fig. 2a, blue) corresponds to a molecular mass of ∼110 kDa. This suggests that the soybean SAT functions as a trimer and not a hexamer, as described for the bacterial SAT (21, 22), despite sharing greater than 85% amino acid sequence identity. To further examine the solution oligomerization of this protein, equilibrium ultracentrifugation experiments were performed. Analysis of the data indicates a molecular mass of 120 ± 3.5 kDa for soybean SAT (Fig. 2c). The expected molecular masses for a SAT trimer and hexamer are 108.4 and 216.8 kDa, respectively.
To study the oligomeric assembly of the soybean CSC, purified SAT was mixed with a 10-fold molar excess of OASS and analyzed by gel-filtration chromatography. Comparison of the resulting elution profile with those obtained for individual SAT and OASS clearly shows a distinct major peak and two minor peaks corresponding to uncomplexed SAT and OASS (Fig. 2a, red). The major peak (Mr ∼ 300,000) shows that both proteins co-elute, with absorbance at A412 nm indicating the presence of pyridoxal phosphate from OASS. Proteins from this peak were subsequently analyzed by SDS-PAGE (Fig. 2a, inset) and identified by matrix-assisted laser desorption (MALDI) mass spectrometry (Danforth Center Mass Spectrometry Facility). The resulting MALDI peptide mass fingerprints confirmed the upper band as G. max OASS and identified the lower band as G. max SAT (data not shown). For sedimentation equilibrium analysis of the CSC, the molar ratio of OASS to SAT was varied. Analysis of sedimentation profiles for mixtures of OASS and SAT indicated that molecular weight of the complex is a function of OASS concentration with a maximum molecular weight observed at a 3:1 molar ratio of OASS dimer to SAT trimer. A single species model was used to fit the 3:1 stoichiometry sedimentation profile of the CSC (Fig. 2d). The results indicate that the apparent molecular mass of soybean CSC is 330 ± 19 kDa, which is slightly higher than the expected value of 312 kDa for a complex containing one SAT trimer and three OASS dimers.
Calorimetric Analysis of the Energetics of SAT-OASS Interaction—To probe the thermodynamics of OASS-SAT interaction in the CSC, we used ITC. ITC experiments (Fig. 3a) show that binding of OASS to SAT is exothermic and that multiple binding events occur. Fitting of the ITC data to either single- or two-site binding models failed to adequately describe the observed results, whereas a three-site binding model yielded an excellent agreement with the data (Fig. 3a). The stoichiometry of the OASS-SAT interaction indicates that a maximum of three OASS dimers bind to one SAT trimer, which agrees with the sedimentation studies. Interestingly, the binding events in formation of the CSC are not energetically identical (Table 1). Although all three interaction sites display a nanomolar-range binding constant, successive addition of each OASS dimer to the SAT trimer decreases affinity for the next binding event.
FIGURE 3.

ITC analysis of CSC formation. a, titration of OASS dimer to SAT trimer at 25 °C. ITC data (upper panel) is plotted as heat signal versus time. The experiment consisted of 20 injections of 12 μl each of OASS dimer (23.7 μm) into a solution containing SAT trimer (1.5 μm) in the binding buffer. In the lower panel, the integrated heat responses per injection are plotted. The solid line represents the fit to data using a three-site sequential binding model, and the dashed line is the fit to data using a one-site binding model. b, temperature dependence of binding enthalpy (H) for a single OASS dimer binding to one monomer of SAT. The solid line represents the linear regression fit to the binding enthalpies obtained at indicated temperatures. c, temperature dependence of binding constant for a single OASS dimer binding to one monomer in the SAT trimer. The solid nonlinear line is drawn to show the trend of binding constants and does not represent a fit to data.
TABLE 1.
Thermodynamic parameters of CSC formation
ITC experiments were performed at 25 °C as described under “Experimental Procedures” with data fitting to a three-site binding model. K1, Ks, and K3 are the first, second, and third binding events, respectively.
| Kd | ΔG | ΔH | −TΔS | |
|---|---|---|---|---|
| nm | kcal mol−1 | kcal mol−1 | kcal mol−1 | |
| K1 | 0.30 ± 0.01 | −12.9 ± 0.1 | −15.8 ± 0.8 | 2.9 |
| K2 | 7.5 ± 2.0 | −11.0 ± 0.1 | −9.3 ± 0.9 | −1.7 |
| K3 | 78.0 ± 5.0 | −9.0 ± 0.1 | −4.7 ± 0.2 | −4.3 |
Temperature dependence studies show that molar enthalpy of OASS binding to a single site on the SAT trimer decreases as temperature increases (Table 2). From the slope of temperature dependence of enthalpy, the estimated change in heat capacity (ΔCp) for binding of OASS to SAT is 400 kcal mol-1 (Fig. 3b). This value is slightly less than the ΔCp = -430 kcal mol-1, determined for interaction of an SAT C-terminal peptide to OASS (24). Moreover, binding of one OASS dimer to SAT shows a significantly lower Kd value (up to 30-fold at 25 °C) than observed for interaction between OASS and a peptide corresponding to the C-terminal 10 amino acids of SAT (24). This suggests additional interactions are formed during protein-protein association compared with the protein-peptide binding. Analysis of the association constant for binding of the first OASS dimer (K1) to the SAT trimer reveals that binding affinity decreases nonlinearly with temperature (Table 2 and Fig. 3c). The nonlinear nature of the van't Hoff plot suggests that interaction between the two proteins likely involves localized conformational changes upon binding. Although association of OASS and SAT displays a nanomolar-range affinity at all temperatures examined, the temperature dependence of interaction suggests that formation of the CSC is sensitive to temperature. This may have a regulatory function in vivo as plants respond to changes in their environment.
TABLE 2.
Temperature dependence of thermodynamic parameters for CSC formation
ITC experiments were performed as described under “Experimental Procedures” at the indicated temperatures. For comparison, only the K1 values (first binding event in CSC formation) are shown.
| Temperature | Kd | ΔG | ΔH | −TΔS |
|---|---|---|---|---|
| °C | nm | kcal mol−1 | kcal mol−1 | kcal mol−1 |
| 10 | 100.0 ± 0.7 | −9.0 ± 0.1 | −9.4 ± 1.0 | −0.4 |
| 15 | 34.7 ± 1.6 | −10.0 ± 0.1 | −10.3 ± 0.4 | −0.3 |
| 20 | 15.6 ± 0.4 | −10.3 ± 0.1 | −13.9 ± 0.9 | −3.6 |
| 25 | 0.30 ± 0.01 | −12.9 ± 0.1 | −15.8 ± 0.8 | −2.9 |
| 30 | 0.10 ± 0.01 | −13.6 ± 0.1 | −16.2 ± 0.3 | −2.6 |
Surface Plasmon Resonance Analysis of CSC Formation Kinetics—To investigate the kinetics of CSC formation, we used surface plasmon resonance (SPR) to monitor the association and dissociation of OASS to SAT, which was immobilized on an Ni2+-nitrilotriacetic acid chip. In all experiments, one flow cell was not charged with Ni2+ to serve as the reference. After loading of SAT to the chip and extensive washing with buffer, the sensogram signal was stable, indicating that the concentration of SAT bound did not change. The addition of OASS results in increased SPR signal over a range of protein concentrations (Fig. 4a). The kinetic data obtained from binding experiments at low OASS concentrations (0.018 and 0.036 μm) were fit to a one-site binding model for association and dissociation (Table 3); however, association and dissociation data obtained at OASS concentrations greater than 0.18 μm could not be adequately fit to a one-site model, suggesting a multistep binding mechanism. For example, fits of the association phase data for binding of OASS (1.2 μm) to SAT and the dissociation phase data to one-site and three-site models are shown compared in Figs. 4, b and c. For data fitting at higher OASS concentrations, two-site (0.18 and 0.36 μm) and three-site (0.72 and 1.2 μm) binding models were used (Table 3). Variation of OASS allows for the determination of all three ka and kd values, which are independent of OASS concentration used, in CSC formation (Table 3).
FIGURE 4.

SPR analysis of OASS-SAT interaction kinetics. a, SPR difference resonance signal of OASS binding to SAT monitored at varied concentrations of OASS (bottom to top, 0.018, 0.036, 0.18, 0.36, 0.72, 1.2 μm) as a function of time at 25 °C. RU, response units. b, kinetics of OASS (1.2 μm) binding to SAT. Fitting of the association data to a three-site model for the binding of three OASS dimers to one SAT trimer is shown as a gray line. The data fit to a one-site model is shown as the dashed line. c, kinetics of OASS (1.2 μm) dissociation from SAT. The gray line shows the fit of the data a three-site binding model. The data fit to a one-site model is shown as the black line.
TABLE 3.
Summary of kinetic parameters for OASS-SAT interaction determined by SPR
SPR experiments were performed as described under “Experimental Procedures.” Raw SPR data was fit to either a one-(0.018 and 0.036 μm OASS)-, two (0.18 and 0.36 μm OASS)-, or three (0.72 and 1.2 μm OASS)-site binding model to obtain values for each association and dissociation event.
| [OASS] | Kd,1 | Kd,2 | Kd,3 | ka,1 | ka,2 | ka,3 |
|---|---|---|---|---|---|---|
| μm | ×10−3 s−1 | ×10−4 s−1 | ×10−5 s−1 | ×105m−1 s−1 | ×104m−1 s−1 | ×103m−1 s−1 |
| 0.018 | 2.2 ± 0.02 | 2.5 ± 0.01 | ||||
| 0.036 | 1.9 ± 0.02 | 1.4 ± 0.01 | ||||
| 0.180 | 6.0 ± 0.03 | 2.0 ± 0.02 | 2.0 ± 0.01 | 6.2 ± 0.01 | ||
| 0.36 | 2.1 ± 0.01 | 1.9 ± 0.01 | 2.5 ± 0.01 | 4.1 ± 0.01 | ||
| 0.72 | 2.3 ± 0.01 | 2.1 ± 0.02 | 4.3 ± 0.06 | 2.5 ± 0.02 | 3.9 ± 0.01 | 6.3 ± 0.02 |
| 1.2 | 1.9 ± 0.01 | 2.4 ± 0.03 | 4.4 ± 0.04 | 2.5 ± 0.01 | 2.0 ± 0.01 | 2.6 ± 0.02 |
Analyses of these rate constants indicate that assembly of the CSC results in formation of a stable macromolecular assembly. The equilibrium constants for each binding event as estimated from the SPR experiments (Kd,1 = 0.2 nm, Kd,2 = 5.1 nm, Kd,3 = 72 nm) are in excellent agreement with the Kd values determined from ITC (Table 1). The rapid association constants and slow dissociation constants contribute to the observed tight Kd values for CSC formation. As observed in the ITC experiments, once all three binding sites of SAT are saturated with OASS in the SPR experiments, further increases in OASS concentration do not result in additional binding.
The C Terminus of SAT Drives CSC Formation—Earlier studies show that the C-terminal region of plant and bacterial SAT is required for CSC formation (10, 15, 23, 24). Moreover, recent analysis of the interaction between OASS and a peptide corresponding to the C terminus of SAT showed that the terminal isoleucine was critical for binding to OASS (23). To examine the role of the C terminus of soybean SAT in protein-protein interaction with soybean OASS, SAT variants lacking either the C-terminal isoleucine (CΔ1) or the last 10 amino acids (CΔ10) were generated. The CΔ1 and CΔ10 SAT were kinetically similar to wild-type enzyme using acetyl-CoA and serine as substrates (data not shown). The CΔ10 SAT does not interact with OASS, as determined by size-exclusion chromatography, ITC, and SPR analysis (data not shown). Removal of the C-terminal isoleucine of SAT (i.e. CΔ1 SAT) decreases the affinity for OASS by 100-fold compared with the wild-type interaction, as determined by ITC (data not shown). These results demonstrate that the C-terminal tail of SAT is critical for efficient formation of the CSC.
CSC Formation Releases Feedback Inhibition by Cysteine—Multiple studies of the plant CSC show that association of the complex results in activation of SAT and inactivation of OASS (9, 11). Enzyme assays of soybean SAT, OASS, and the CSC show that SAT activity increases 2-fold in the complex (SAT. 150 ± 9 μmol min-1 mg protein-1; CSC. 340 ± 15 μmol min-1 mg protein-1) and that OASS activity is inhibited in the complex (OASS, 1400 ± 28 μmol min-1 mg protein-1; CSC, 50 ± 3 μmol min-1 mg protein-1). Inhibition of OASS activity occurs by binding of the SAT C terminus at the OASS active site (23-25).
To further examine the effect of complex assembly on SAT activity, the steady-state kinetic parameters of SAT and the CSC were determined (Table 4). Maximum activity was observed upon the addition of three OASS dimers to one SAT trimer. Further addition of OASS did not change activity. Formation of the CSC accelerates the rate of catalysis for O-acetylserine formation nearly 2-fold. An 8-fold increase in catalytic efficiency for acetyl-CoA is observed with the CSC, although the kcat/Km values for SAT and CSC are comparable with serine. Interestingly, substrate inhibition by serine is observed for SAT but not for the CSC. Inhibition of SAT by serine at high concentrations occurs by formation of a nonproductive serine·CoA complex, as observed with bacterial SAT (31, 32). The altered substrate inhibition effects may result from structural rearrangements near the active site upon complex formation (21).
TABLE 4.
Steady-state kinetic parameters of SAT and the CSC
All reactions were performed as described under “Experimental Procedures.” The KI value for serine was determined by fitting data to the equation for substrate inhibition. The KI value for serine was determined by fitting data to the equation for non-competitive inhibition. All values are expressed as the mean ± S.E. for n = 3.
| SAT | CSC | |
|---|---|---|
| V/Et (s−1) | 95.6 ± 5.1 | 165 ± 3 |
| Kmacetyl-CoA (μm) | 290 ± 60 | 46 ± 4 |
| kcat/Kmacetyl-CoA (m−1 s−1) | 330,000 | 2,590,000 |
| Kmserine (μm) | 430 ± 60 | 700 ± 20 |
| kcat/Kmserine (m−1 s−1) | 222,000 | 236,000 |
| KIserine (μm) | 8,000 ± 1,000 | |
| KIcysteine (μm) | 2 ± 0.1 | 70 ± 10 |
The loss of substrate inhibition suggested that complex formation might also alter feedback inhibition of SAT by cysteine (33, 34), the final product of the biosynthesis pathway. To evaluate the effect of the SAT-OASS interaction on feedback inhibition, the SAT activities of isolated SAT and the CSC were determined in the presence of increasing concentrations of cysteine. Association of SAT and OASS in the CSC increases the Ki value of cysteine by 35-fold (Table 4), indicating that CSC formation lessens the effectiveness of feedback inhibition by the pathway's final product on SAT.
DISCUSSION
Macromolecular assemblies control an array of cellular processes, but the functional and regulatory roles of many multienzyme complexes in metabolism remain largely unexplored. In plants, association and dissociation of SAT and OASS to form the CSC integrates the linked metabolic demands of sulfur assimilation and cysteine biosynthesis. The CSC serves a key regulatory role in thiol metabolism; however, the structural composition and energetic basis of its formation are unclear. To better understand the physiological function of the CSC, we examined the oligomerization state of the complex, the thermodynamics and kinetics of its formation, and the effect of CSC formation on SAT and OASS activity. These experiments suggest a new model and biochemical consequences for formation of the CSC in plants.
Biophysical analysis of the two enzymes involved in formation of the soybean CSC shows that OASS functions as a dimer and that SAT is trimeric (Fig. 2). The dimeric organization of soybean OASS agrees with the three-dimensional structures of other plant and bacterial OASS (Fig. 1b) (17, 19-20). Although crystal structures of the E. coli SAT reveal a hexamer consisting of two homotrimers arranged head-to-head (21, 22), various oligomerization states, including tetrameric (16) and hexameric (5), have been suggested for the plant SAT based solely on size-exclusion chromatography. The results reported here showing that soybean SAT functions as a homotrimer are the first biophysical analysis of any plant SAT. The SAT from plants and bacteria show multiple amino acid differences in the N-terminal region that forms the head-to-head interaction domain between the two homotrimers observed in the bacterial structures (21, 22). It is possible that amino acid variations in the interaction region are related to evolution of different oligomerization states of the enzyme in various species. The comparable kinetic parameters of the hexameric (31, 32) and trimeric (Table 4) SAT indicate that oligomerization does not significantly alter active site structure. This is also consistent with the C-terminal location of the active site. The head-to-head arrangement observed in the bacterial SAT places the three C-terminal tails of each SAT trimer at opposite ends of the hexamer. Given this architecture, a trimeric SAT would consist of half the hexameric structure (Fig. 1a).
SAT and OASS associate to form the CSC; however, the previously proposed molecular composition of the complex is based on limited analysis of plant and bacterial CSC. The molecular weight determined for the reconstituted soybean CSC by analytical ultracentrifugation (Fig. 2d) agrees with earlier size-exclusion chromatography analysis of the complex isolated from native plant extracts that suggested a molecular weight of 310 kDa (11). Based on the trimeric assembly of soybean SAT (Fig. 2c), this result suggests that three OASS dimers associate to form the complex. Intriguingly, calorimetric and SPR analyses of complex formation reveal three distinct binding events during CSC formation (Figs. 3 and 4), which is consistent with three OASS dimers interacting with an SAT trimer. The binding data also show negative cooperativity in CSC formation as additional molecules of OASS bind to SAT (Tables 1 and 3), suggesting possible steric hindrance or occlusion of the interaction site as the complex increases in size.
Earlier SPR analysis of the Arabidopsis CSC (16) suggested a single-site binding model for interaction between OASS and SAT. Over the same range of OASS concentrations (20-200 nm) used by Berkowitz et al. (16), we also observe one-site binding; however, at OASS concentrations greater than 180 nm, deviations from this model occur that are best fit with two- and three-site models (Table 3). Ultimately, employing multiple techniques to obtain the solution oligomerization of the complex enabled us to dissect out the multi-phase binding nature of the OASS-SAT interaction.
Altogether these results suggest an alternative model for assembly of the CSC (Fig. 5), in which each OASS dimer binds to one of three SAT C termini. X-ray crystal structures of A. thaliana and Haemophilus influenzae OASS in complex with C-terminal peptides of their cognate SAT show binding of a peptide in each active site of the OASS dimer (23, 25); however, thermodynamic analysis of the protein-peptide interaction in Arabidopsis OASS shows that binding at one site can decrease affinity at the second site (24). Moreover, binding of one SAT peptide at one site of OASS appears to lock the second site in a catalytically unfavorable open conformation (23, 25). Thus, interaction between SAT and OASS likely inhibits OASS in the CSC by directly blocking one OASS active site and hindering formation of an active conformation at the second active site. This would also prevent a bound OASS from interacting with a second SAT trimer.
FIGURE 5.

Model of CSC formation. Dimeric OASS (blue) interacts with the C-terminal tail of an SAT trimer (orange). Kd values for each step as determined by ITC and SPR are summarized.
The proposed model for the soybean CSC (Fig. 5) differs from that originally proposed for the bacterial CSC, in which a hexameric SAT interacts with two OASS dimers (7). The variation may reflect differences in species and/or method of isolating the CSC. Kredich et al. (7) purified the CSC from Salmonella, whereas we used recombinant proteins to reconstitute the soybean complex. Because the state of the CSC depends on endogenous sulfur-nutrient levels (13, 14), the number of OASS bound to SAT likely varies under different physiological conditions.
Although disordered in multiple crystal structures of bacterial SAT (21, 22), the C terminus of the enzyme is critical for formation of the CSC, as described here and elsewhere (10, 15, 23, 24). Comparison of the interaction between SAT and OASS (Table 1) versus binding of a C-terminal peptide to OASS (24) suggest that additional interactions are required for complex formation. The affinity between SAT and OASS is up to 300-fold tighter than the interaction between a peptide corresponding to the SAT C terminus and OASS. Although the heat capacities of the two interactions are similar, the nonlinear van't Hoff plot (Fig. 3c) for formation of the soybean CSC suggests that interaction between OASS and SAT results in localized conformational changes.
Steady-state kinetic analysis of SAT as an isolated protein and in the complex also implies that OASS binding may reorganize the C-terminal region of SAT near the active site. As part of the CSC, SAT shows a loss of substrate inhibition by serine, a decrease in the effectiveness of feedback inhibition by cysteine, and improved kinetics for acetyl-CoA (Table 4). The crystal structures of H. influenzae SAT in complex with either cysteine or serine shows that cysteine binding induces major rearrangements in an extended C-terminal loop region that likely excludes co-substrate binding (21). Association of OASS with the C terminus of SAT in the CSC appears to reorganize the SAT active site into a conformation that reduces inhibition by cysteine and enhances the catalytic efficiency of acetyl-CoA as a substrate. The exact nature of these changes will require determination of the three-dimensional structure of a CSC from either plants or bacteria.
Metabolically, OASS acts as an enzyme chaperone of SAT in a number of ways. Not only does formation of the CSC enhance the rate of O-acetylserine synthesis (Table 4) (8-12), association of SAT and OASS releases the limiting step of cysteine biosynthesis from feedback inhibition. Physiologic cysteine levels in plants range from 10 to 20 μm (9, 14). The rapid and stable formation of the CSC would allow production of O-acetylserine to maintain intracellular cysteine levels during high demand conditions, such as environmental oxidative stress. Under conditions of low sulfur state, dissociation of the complex restores regulation of SAT by feedback regulation. Interestingly, formation of the CSC may also increase the physical stability of SAT. In E. coli, association with OASS prevents cold inactivation of SAT (35). It is unclear if this also occurs in plants such as soybean, where the demand for sulfur assimilation and cysteine production increases in response to low temperature chilling (36-40). Ultimately, cysteine biosynthesis and thiol metabolism in plants is highly regulated at the protein level by multiple molecular mechanisms including complex formation, redox-regulation, and phosphorylation, to integrate multiple cellular signals that modulate enzyme activity to meet various demands for metabolite supply (41-43).
Acknowledgments
We thank Prof. Xuemin (Sam) Wang for access to the calorimeter in his laboratory, to the Washington University Biochemistry and Biophysics Department for use of the analytical ultracentrifuge, and to the Danforth Science Center Mass Spectrometry facility for performing peptide mass fingerprinting.
This work was supported by United States Department of Agriculture Grant NRI-2005-02518 (to J. M. J.).
Footnotes
The abbreviations used are: SAT, serine O-acetyltransferase (EC 2.3.1.30); CSC, cysteine synthase complex; ITC, isothermal titration calorimetry; OASS, O-acetylserine sulfhydrylase (also O-acetylserine(thiol)lyase; EC 2.5.1.47); SPR, surface plasmon resonance; MALDI, matrix-assisted laser desorption.
References
- 1.Srere, P. A. (1987) Annu. Rev. Biochem. 56 89-124 [DOI] [PubMed] [Google Scholar]
- 2.Hrazdina, G., and Jensen, R. A. (1992) Annu. Rev. Plant Physiol. Plant Mol. Biol. 43 241-267 [Google Scholar]
- 3.Winkel, B. S. J. (2004) Annu. Rev. Plant Biol. 55 85-107 [DOI] [PubMed] [Google Scholar]
- 4.Xia, Y., Yu, H., Jansen, R., Seringhaus, M., Baxter, S., Greenbaum, D., Zhao, H., and Gerstein, M. (2004) Annu. Rev. Biochem. 73 1051-1087 [DOI] [PubMed] [Google Scholar]
- 5.Hell, R., Jost, R., Berkowitz, O., and Wirtz, M. (2002) Amino Acids 22 245-257 [DOI] [PubMed] [Google Scholar]
- 6.Kumaran, S., Francois, J. A., Krishnan, H. B., and Jez, J. M. (2008) in Sulfur Assimilation and Abiotic Stress in Plants (Khan, N. A., and Singh, R. P., eds) pp. 97-109, Springer-Verlag New York Inc., New York
- 7.Kredich, N. M., Becker, M. A., and Tomkins, G. M. (1969) J. Biol. Chem. 244 2428-2439 [PubMed] [Google Scholar]
- 8.Cook, P. F., and Wedding, R. T. (1977) Arch. Biochem. Biophys. 178 293-302 [DOI] [PubMed] [Google Scholar]
- 9.Saito, K., Yokoyama, H., Noji, M., and Murakoshi, I. (1995) J. Biol. Chem. 270 16321-16326 [DOI] [PubMed] [Google Scholar]
- 10.Bogdanova, N., and Hell, R. (1997) Plant J. 11 251-262 [DOI] [PubMed] [Google Scholar]
- 11.Droux, M., Ruffet, M. L., Dounce, R., and Job, D. (1998) Eur. J. Biochem. 255 235-245 [DOI] [PubMed] [Google Scholar]
- 12.Zhu, X., Yamaguchi, T., and Masada, M. (1998) Biosci. Biotech. Biochem. 62 947-952 [DOI] [PubMed] [Google Scholar]
- 13.Hell, R., and Hillebrand, H. (2001) Curr. Opin. Biotechnol. 12 161-168 [DOI] [PubMed] [Google Scholar]
- 14.Wirtz, M., and Hell, R. (2007) Plant Cell 19 625-639 [DOI] [PMC free article] [PubMed] [Google Scholar]
- 15.Wirtz, M., Berkowitz, O., Droux, M., and Hell, R. (2001) Eur. J. Biochem. 268 686-693 [DOI] [PubMed] [Google Scholar]
- 16.Berkowitz, O., Wirtz, M., Wolf, A., Kuhlmann, J., and Hell, R. (2002) J. Biol. Chem. 277 30629-30634 [DOI] [PubMed] [Google Scholar]
- 17.Bonner, E. R., Cahoon, R. E., Knapke, S. M., and Jez, J. M. (2005) J. Biol. Chem. 280 38803-38813 [DOI] [PubMed] [Google Scholar]
- 18.Campanini, B., Speroni, F., Salsi, E., Cook, P. F., Roderick, S. L., Huang, B., Bettati, S., and Mozzarelli, A. (2005) Protein Sci. 14 2115-2124 [DOI] [PMC free article] [PubMed] [Google Scholar]
- 19.Burkhard, P., Rao, G. S., Hohenester, E., Schnackerz, K. D., Cook, P. F., and Jansonius, J. N. (1998) J. Mol. Biol. 283 121-133 [DOI] [PubMed] [Google Scholar]
- 20.Schnell, R., Oehlmann, W., Singh, M., and Schneider, G. (2007) J. Biol. Chem. 282 23473-23481 [DOI] [PubMed] [Google Scholar]
- 21.Olsen, L. R., Huang, B., Vetting, M. B., and Roderick, S. L. (2004) Biochemistry 43 6013-6019 [DOI] [PubMed] [Google Scholar]
- 22.Pye, V. E., Tingey, A. P., Robson, R. L., and Moody, P. C. E. (2004) J. Biol. Chem. 279 40729-40736 [DOI] [PubMed] [Google Scholar]
- 23.Francois, J. A., Kumaran, S., and Jez, J. M. (2006) Plant Cell 18 3647-3655 [DOI] [PMC free article] [PubMed] [Google Scholar]
- 24.Kumaran, S., and Jez, J. M. (2007) Biochemistry 46 5586-5594 [DOI] [PubMed] [Google Scholar]
- 25.Huang, B., Vetting, M. W., and Roderick, S. L. (2005) J. Bacteriol. 187 3201-3205 [DOI] [PMC free article] [PubMed] [Google Scholar]
- 26.Jez, J. M., Ferrer, J. L., Bowman, M. E., Dixon, R. A., and Noel, J. P. (2000) Biochemistry 39 890-902 [DOI] [PubMed] [Google Scholar]
- 27.Chronis, D., and Krishnan, H. B. (2004) Planta 218 417-426 [DOI] [PubMed] [Google Scholar]
- 28.Chronis, D., and Krishnan, H. B. (2003) Crop Sci. 43 1819-1827 [Google Scholar]
- 29.Kumaran, S., Kozlov, A. G., and Lohman, T. M. (2006) Biochemistry 45 11958-11973 [DOI] [PMC free article] [PubMed] [Google Scholar]
- 30.O'Shannessy, D. J., Brigham-Burke, M., Soneson, K. K., Hensley, P., and Brooks, I. (1993) Anal. Biochem. 212 457-468 [DOI] [PubMed] [Google Scholar]
- 31.Hindson, V. J., and Shaw, W. V. (2003) Biochemistry 42 3113-3119 [DOI] [PubMed] [Google Scholar]
- 32.Johnson, C. M., Huang, B., Roderick, S. L., and Cook, P. F. (2004) Arch. Biochem. Biophys. 429 115-122 [DOI] [PubMed] [Google Scholar]
- 33.Noji, M., Inoue, K., Kimura, N., Gouda, A., and Saito, K. (1998) J. Biol. Chem. 273 32739-32745 [DOI] [PubMed] [Google Scholar]
- 34.Inoue, K., Noji, M., and Saito, K. (1999) Eur. J. Biochem. 266 220-227 [DOI] [PubMed] [Google Scholar]
- 35.Mino, K., Imamura, K., Sakiyama, T., Eisaki, N., Matsuyama, A., and Nakanishi, K. (2001) Biosci. Biotechnol. Biochem. 65 865-874 [DOI] [PubMed] [Google Scholar]
- 36.Nieto-Sotelo, J., and Ho, T. H. (1986) Plant Physiol. 82 1031-1035 [DOI] [PMC free article] [PubMed] [Google Scholar]
- 37.Kocsy, G., Szalai, G., Vagujfalvi, A., Stehli, L., Orosz, G., and Galiba, G. (2000) Planta 210 295-301 [DOI] [PubMed] [Google Scholar]
- 38.Gomez, L. D., Vanacker, H., Buchner, P., Noctor, G., and Foyer, C. H. (2004) Plant Physiol. 134 1662-1671 [DOI] [PMC free article] [PubMed] [Google Scholar]
- 39.Phartiyal, P., Kim, W. S., Cahoon, R. E., Jez, J. M., and Krishnan, H. B. (2006) Arch. Biochem. Biophys. 450 20-29 [DOI] [PubMed] [Google Scholar]
- 40.Phartiyal, P., Kim, W. S., Cahoon, R. E., Jez, J. M., and Krishnan, H. B. (2007) Phytochemistry 69 356-364 [DOI] [PubMed] [Google Scholar]
- 41.Liu, F., Yoo, B. C., Lee, J. Y., Pan, W., and Harmon, A. C. (2006) J. Biol. Chem. 281 27405-27415 [DOI] [PubMed] [Google Scholar]
- 42.Hicks, L. M., Cahoon, R. E., Bonner, E. R., Rivard, R. S., Sheffield, J., and Jez, J. M. (2007) Plant Cell 19 2653-2661 [DOI] [PMC free article] [PubMed] [Google Scholar]
- 43.Dominguez-Solis, J. R., He, Z., Lima, A., Ting, J., Buchanan, B. B., and Luan, S. (2008) Proc. Natl. Acad. Sci. U. S. A. 105 16386-16389 [DOI] [PMC free article] [PubMed] [Google Scholar]