

Abstract
Ca2+-Calmodulin-dependent protein kinase II (CaMKII) is an abundant synaptic protein that was recently shown to regulate the organization of actin filaments leading to structural modifications of synapses. CaMKII is a dodecameric complex with a special architecture that provides it with unique potential for organizing the actin cytoskeleton. We report using biochemical assays that the β isoform of CaMKII binds to and bundles actin filaments, and the disposition of βCaMKII within the actin bundles was revealed by cryoelectron tomography. In addition, βCaMKII was found to inhibit actin polymerization, suggesting that it either serves as a capping protein or binds monomeric actin, reducing the amount of freely available monomers to nucleate polymer assembly. By means of fluorescent cross-correlation spectroscopy, we determined that βCaMKII does indeed bind to monomeric actin, reaching saturation at a stoichiometry of 12:1 actin monomers per βCaMKII holoenzyme with a binding constant of 2.4 × 10⁵ m–1. In cells, βCaMKII has a dual functional role; it can sequester monomeric actin to reduce actin polymerization and can also bundle actin filaments. Together, these effects would impact both the dynamics of actin filament assembly and enhance the rigidity of the filaments once formed, significantly impacting the structure of synapses.
Actin and more than 60 different classes of actin-binding proteins form an abundant and highly regulated cytoskeletal network, constituting more than 25% of protein in non-muscle cells and over 60% in muscle cells (1). Actin is estimated to be ∼4 mg/ml in cells, with half found in the polymerized F-actin state and the remainder in the soluble G-actin state (2). Actin undergoes rounds of polymerization and depolymerization from a soluble (G-actin) pool to a filamentous (F-actin) pool, and it is the kinetics of these forward and backward rates that determines the stability of the actin cytoskeleton. The various actin-binding proteins are, in part, responsible for regulating the kinetics of actin polymerization and depolymerization. Actin is commonly known for its structural and dynamic function in cells, such as its role in muscle contraction and cell locomotion, and has been similarly implicated for its structural role at synapses in the nervous system (3, 4). For example, actin is proposed to serve an important role in coordinating the delivery of synaptic vesicles to the pre-synaptic terminal that appear to underlie certain forms of plasticity mediated by alterations in the probability of stimulus evoked vesicle release (5–7). Additionally, several recent studies have demonstrated the importance of actin dynamics in structural reorganization of the post-synaptic spine compartment of excitatory synapses (8–10). Several pools of actin have been identified within spines with different turnover rates, and activation of glutamate receptors on the spines regulates the kinetics of actin turnover (9, 10). Spine shape changes have been proposed to underlie forms of synaptic plasticity such as long-term potentiation (8, 9). Importantly, several of these studies have also identified Ca2+-calmodulin-dependent protein kinase II (CaMKII)4 as an important regulator of spine actin dynamics (9, 10).
CaMKII is an abundant synaptic protein concentrated in postsynaptic spines. The enzyme is a 12-subunit complex (11) that has been proposed as a scaffolding molecule engaged in molecular complex formation within synapses (12, 13). There are four genes (α, β, γ, and δ) in mammalian cells that encode different isoforms of CaMKII (14). However, the most abundant in the brain are α and β. Altogether they constitute ∼2% of the total hippocampal protein in rat brain (15), a concentration that suggests the kinase plays more than an enzymatic role. The first study of a possible interaction between actin and CaMKII was performed by Ohta et al. (16) who showed that brain CaMKII interacts with filamentous actin (F-actin) and that Ca2+/CaM-binding to the enzyme antagonizes actin binding. Shen et al. (17) confirmed and extended these observations by identifying that it is the β isoform of CaMKII that is responsible for targeting the enzyme to F-actin in cell culture models and in neurons. Further, βCaMKII overexpression and/or knockdown using RNA interference induced an actin-dependent change in synaptic volume (10, 18) and impacted the outgrowth of dendrites and the formation of synapses (19). Studies have also identified that whereas oligomerization of βCaMKII is essential for actin binding, catalytic activity is not (10, 18). Okamoto et al. (10) also show that βCaMKII can bundle actin filaments; however, they report that the enzyme does not affect actin polymerization. These observations are similar to those reported by O'Leary et al. (20) who describe the bundling of actin filaments by βCaMKII and identify the domain responsible for this bundling to be in the N-terminal area of the variable domain of CaMKII, just C-terminal to the CaM-binding domain. A similar domain is also identified for actin binding in the studies of Okamoto et al. (10) and Lin and Redmond (18). Clearly, cellular actin dynamics are significantly impacted by CaMKII, and it appears that the βCaMKII isoform plays a critical role in these dynamics at synapses in the brain and possibly in other tissue in which they are also abundant. What is less clear is how βCaMKII can produce this plethora of effects on actin dynamics, as it's only identified biochemical impact is to bundle actin filaments.
In this report, we present results that extend the impact of the biochemical interactions of βCaMKII with the F-actin system and identify that βCaMKII binds monomeric actin and inhibit actin polymerization in addition to its role in F-actin bundling. We demonstrate using stain and cryoelectron tomographic reconstructions the disposition of βCaMKII within actin bundles. We also show, contrary to what has been described in previous work (10), that βCaMKII is capable of reducing the rate of actin polymerization, decreasing the assembly of F-actin. Furthermore, by means of fluorescent cross-correlation spectroscopy we have determined that βCaMKII binds to monomeric actin (G-actin), consistent with its ability to impact actin polymerization. Similar to binding to F-actin, βCaMKII binding to G-actin is diminished by Ca2+/CaM binding to the enzyme. In conclusion, βCaMKII has a dual functional role: it can sequester monomeric actin to reduce actin polymerization, impacting the cytoskeleton turn-over dynamics, and it can also bundle actin filaments presumably enhancing the structural rigidity of the filamentous actin system. These functions appear responsible, in part, for the reorganization and stabilization of the actin cytoskeleton at synapses and presumably other cells.
EXPERIMENTAL PROCEDURES
Unlabeled actin was purified from frozen rabbit skeletal muscle (Ted Pella Inc.) following a modified version of the protocol described in Feuer et al. (22). This purification procedure depends on the differential salt solubility of actin and myosin, which comprise most of the protein of the contractile apparatus. Tropomyosin was removed by treating the F-actin with 0.8 m KCl, and pure actin was collected by two cycles of polymerization, ultracentrifugation, and depolymerization. The final preparation was dialyzed into Buffer A (5 mm Tris, 0.2 mm CaCl2, 0.2 mm ATP, and 0.5 mm dithiothreitol, pH 8.0) and kept at –80 °C for further use. The concentration of actin was determined using a micro-BCA assay (Pierce Chemical Co.) using bovine serum albumin as the standard. The preparations were more than 90% pure actin when analyzed by SDS-PAGE (see Fig. 1). For the cross-correlation experiments described below, actin labeled with Alexa 647 was obtained from Invitrogen (Molecular Probes, catalog No. A-34051).
FIGURE 1.

Actin pulldown of CaMKII. F-actin was reacted with αCaMKII or βCaMKII for 30 min and sedimented at 20,000 × g for 60 min at room temperature. The supernatant (s) and pellet (p) were separated on SDS-PAGE and stained with Coomassie Blue. Note that in the presence of actin, the great majority of βCaMKII was in the pellet (arrowhead), whereas the majority of αCaMKII remained in the supernatant. Also apparent under these conditions was that a portion of βCaMKII in the absence of actin was spun out of solution, whereas αCaMKII did not. This result is representative of three separate experiments. The molecular masses of the αCaMKII, βCaMKII, and actin are 54, 60, and 43 kDa, respectively.
The expression of all CaMKII constructs used in the present manuscript was accomplished using the baculovirus system as described previously (23). Purification of the kinase was also accomplished as described previously (23) with the last step entailing chromatography on a CaM-Sepharose affinity matrix and dialysis into 20 mm HEPES, pH 7.4, 0.5 m NaCl, and 10% glycerol. The description of the chimeric construct of the α isoform of CaMKII with an eGFP tag on the N terminus was described previously (24). A chimeric construct of eGFP on the N terminus of βCaMKII was obtained in an identical fashion by first inserting the full-length coding sequence of the βCaMKII cDNA into the eGFP-C1 plasmid (Clontech). Then the eGFP-βCaMKII sequence was subcloned into the pFastBac-1 baculovirus expression plasmid (Invitrogen). All other procedures for the production of virus, the expression of protein in Sf21 insect cells, and purification of the enzyme were exactly as described for eGFP-αCaMKII (24, 25). Purified eGFP-βCaMKII exhibited a specific activity of 7 μmol/min/mg (not significantly different than βCaMKII) and migrated as an oligomeric complex on Sepharose 6 gel filtration chromatography. Before each use, samples were thawed and spun at 4 °C at 14,000 rpm for 10 min to remove aggregates.
To produce F-actin, a stock of G-actin was first prepared by depolymerizing
a freshly thawed aliquot of actin in G-buffer (5 mm Tris, pH 8.0,
0.2 mm CaCl2, and 0.2 mm ATP) for 2 h on ice.
The sample was then centrifuged at 4 °C for 20 min at 14,000 rpm in a
Beckman Microphage, and the supernatant containing G-actin was removed.
F-actin was prepared by polymerizing the G-actin by adding
 volume of a
10× polymerization buffer that brought the final concentrations of
reactants to 50 mm KCl, 2 mm MgCl2, and 1
mm ATP. The reactions were done at room temperature for 2 h. Then,
aliquots of F-actin were placed into polystyrene tubes for the TLA 120.1
rotor, and samples of CaMKII (clarified at 14,000 rpm for 20 min at 4 °C)
were added and further incubated for 60 min at room temperature. All samples
were then centrifuged at 20,000 × g (max.) for 1 h at 22 °C
in a TL1 tabletop Ultracentrifuge. The supernatant and pellet from each sample
were collected and diluted with SDS-sample buffer. All fractions were
separated on a 10% SDS-PAGE, and the distribution of proteins between
supernatant and pellet was visualized by Coomassie Blue staining of the gel.
We discovered under these reaction conditions, even at this relatively low
g-force, that some CaMKII could be recovered in the pellet even
without added F-actin. Further increasing the g-force exacerbated
this nonspecific sedimentation of the kinase.
volume of a
10× polymerization buffer that brought the final concentrations of
reactants to 50 mm KCl, 2 mm MgCl2, and 1
mm ATP. The reactions were done at room temperature for 2 h. Then,
aliquots of F-actin were placed into polystyrene tubes for the TLA 120.1
rotor, and samples of CaMKII (clarified at 14,000 rpm for 20 min at 4 °C)
were added and further incubated for 60 min at room temperature. All samples
were then centrifuged at 20,000 × g (max.) for 1 h at 22 °C
in a TL1 tabletop Ultracentrifuge. The supernatant and pellet from each sample
were collected and diluted with SDS-sample buffer. All fractions were
separated on a 10% SDS-PAGE, and the distribution of proteins between
supernatant and pellet was visualized by Coomassie Blue staining of the gel.
We discovered under these reaction conditions, even at this relatively low
g-force, that some CaMKII could be recovered in the pellet even
without added F-actin. Further increasing the g-force exacerbated
this nonspecific sedimentation of the kinase.
Actin polymerization was assessed using fluorescence changes from pyrene-labeled actin using a kit purchased through Cytoskeleton Inc (catalog No. B003). Fluorescence was monitored at room temperature in a PTI fluorimeter with 350 nm excitation and 405 nm emission. Excitation and emission slit widths were 1 and 10 nm, respectively. To minimize photobleaching over the long time course of these experiments, the samples were moved in and out of the light pathway using a four-position automated sample turret. Measurements for each sample were for 1 s every 15 or 30 s for the duration of the experiments. In this assay, polymerization of pyrene-actin produces a time-dependent increase in fluorescence intensity. A stock of pyrene-labeled G-actin was prepared as described in the binding assay, except that depolymerization was permitted to occur overnight at 4 °C to induce complete depolymerization. If this was not done, the base-line fluorescence in the assay decreased throughout the day as more of the pyrene-labeled actin depolymerized. Pyrene-labeled G-actin (0.25 μm final concentration) was added to the cuvettes in G-buffer at room temperature, and a 5-min base line was collected. CaMKII (1.0 μm concentration of subunits; 0.08 μm holoenzyme) or an equivalent amount of control buffer was added to the appropriate cuvette and incubated for an additional 10 min. Then, an aliquot of 10× polymerization buffer was added, and the change in fluorescence intensity was monitored for up to 8000 s. The final concentrations of reagents, following the addition of the 10× polymerization buffer, were 12.5 mm KCl, 0.5 mm MgCl2, and 0.25 mm ATP. We discovered that the impact of βCaMKII on the polymerization of actin was dependent on these reaction conditions. If full-strength polymerization buffer was used (final concentration of reagents was 50 mm KCl, 2 mm MgCl2, and 1 mm ATP), the impact of βCaMKII on polymerization was only modest, as reported previously (10). We borrowed the suggestion from the Cytoskeleton Inc. manual to vary the amount of 10× polymerization buffer used previously to show the impact of cofilin on actin polymerization.
Actin bundles, prepared as described in the F-actin sedimentation assay, were diluted 1:10 in actin polymerization buffer, and 4 μl of the reaction mix was placed onto a glow-discharged carbon-coated copper grid (200 mesh). After 30 s, excess sample was wicked from the grid and then stained twice with 2% uranyl acetate. Excess stain was wicked away, and the sample was allowed to dry before imaging in a JEOL 1200 electron microscope (running at 120 kV). Images were collected on a 1000 × 1000 pixel Gatan CCD camera.
To produce cryoelectron tomograms, a similar procedure was used to prepare actin/CaMKII bundles, only the ratio of βCaMKII to actin was doubled. A 5-μl sample was then applied to a freshly glow-discharged Quantifoil grid (EMS R2/2) and plunge-frozen in liquid ethane maintained at –170 °C. Frozen specimens were imaged at liquid nitrogen temperatures using a Polara electron microscope (FEI Co.) equipped with a 4000 × 4000 pixel CCD camera. The microscope was operated at 300 kV and a magnification of ×39,000, resulting in an effective pixel size of 4.6 Å after 2 × 2 binning. Low-dose single-axis tilt series were collected at a defocus of –6 μm, and the cumulative dose was ∼100 e-/Å2 from 131 images in the range of ±65°. Tilt series were initially aligned with fiducial markers using IMOD (26) and then further refined by using projection matching as implemented in the package Protomo (27). After refinement, three-dimensional cryoelectron tomograms were reconstructed using weighted-back projection. The data shown in Fig. 2B are representative of 30 tomographic reconstructions.
FIGURE 2.

Structural analysis of F-actin interactions with CaMKII. F-actin was formed as usual, and βCaMKII was added for 15 min at room temperature. A, a sample was negatively stained with uranyl acetate, and CCD images were collected on an electron microscope. The micrograph shows a representative actin bundle decorated with βCaMKII that were evident across the micrograph. A section of the micrograph was colorized (inset, top left) to aid in identifying CaMKII particles associated with the bundled actin filament. The actin filaments are colored in red and the βCaMKII in yellow. The scale bar on this panel is 100 nm. B, similar sample was prepared by applying an aliquot of the F-actin/βCaMKII mix to an EM grid followed by blotting and cryopreservation. A series of tilt images were collected at –170 °C under low electron dose conditions, and tomographic reconstructions were accomplished. A slice through the tomogram is shown where the βCaMKII holoenzymes can be seen clearly interspersed with and bundling the actin filaments. Arrows point to βCaMKII enzymes decorating the actin bundles. The scale bar on this panel is 100 nm.
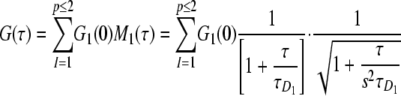
FCCS was achieved by using a pulsed titanium sapphire (Mira 900) pumped by a 5-watt Verdi laser. The wavelength was set at 830 nm with a pulse of 130 fs. The beam was coupled to an inverted microscope (Olympus IX-71) with adaptive optics to overfill the back aperture of a water immersion objective (Olympus UPlanApo/IR 60×/1.20W). On top of the objective a mixed solution of the sample was loaded into 25-μl assay chips (PerkinElmer Life Sciences) with flat-bottom glass No. 1. Details on the one-color setup can be found elsewhere (28, 29). The two-color detection system contains a dichroic mirror (Chroma, Inc, 600 DCXXR) that allows transmission of the “red” light with a band pass filter (Chroma, HQ 675/50) and reflection of the “green” light with a band pass filter (Chroma, HQ 525/50). Behind the bandpass filters are two fiber optics, each coupled to an avalanche photon detector (PerkinElmer Life Sciences, SPCM CD 3101). Data from 10 consecutive takes of 60 s each were collected via an external correlator board and further analyzed using an in-house fitting graphical user interface developed in MATLAB (The MathWorks, Natick, MA) with either a one- or two-component model of the autocorrelation function as follows.
 |
(Eq. 1) |
Gl(0) is the amplitude of correspondent diffusive fraction (l). Ml(τ) is the temporal decay of the correlation function describing the molecules diffusing through the same laser spot (30, 31). The characteristic time of diffusion (τD1) is related to the diffusion coefficient D, D1 = ωo2/8τD1, where ωo (ωo = 323 nm) is the waist of the detection volume. s, in this case s = 6 is the ratio of the axial axis over the radial axis of the detection volume assumed to be a three-dimensional Gaussian. These parameters were established with control dyes (green channel, Rhodamine 110; red channel, Alexa 647) for which the concentrations and diffusion coefficients were known. An additional calibration for cross-correlation was accomplished by taking a dye (Alexa 546) in which emission is collected in both channels simultaneously, searching for the best possible overlap between the correlation function of each channel with the cross-correlation. This procedure ensures that the detection volume (Veff = 0.4 fl) is the same for both channels.
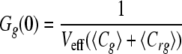
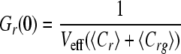
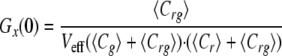
In the idealized case where there is a perfect spectral separation of the red and green signal, and assuming that the only molecular association is given by the union of the two different labeled molecules, the amplitudes of correlation functions, or the extrapolation of Gr,g,x when τ → 0, can be written as follows.
 |
(Eq. 2) |
 |
(Eq. 3) |
 |
(Eq. 4) |
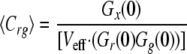
where Cr and Cg are the local concentrations of the unbound reactants and Crg of the bound complex (25). For a known calibrated volume (Veff), the concentration of double-labeled molecules can be derived without any diffusion analysis.
 |
(Eq. 5) |
In the simplest case of a 1:1 binding stoichiometry, the ratio of the amplitudes of the cross-correlation and autocorrelation of the ligand can be used to monitor ν, which represents the fraction of the green population bound to a red molecule. Mathematically this is expressed as
 |
(Eq. 6) |
When there is no binding, Gx(0) reduces to zero (when the cross-talk signal has been minimized, as was the attempt in our experiment).
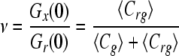
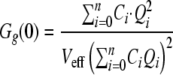
A general case for a distribution of binding with n binding sites was also developed by Kim et al. (25) and is summarized in the following equations using the amplitudes Gr,g,x(0).
 |
(Eq. 7) |
 |
(Eq. 8) |
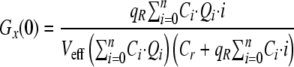 |
(Eq. 9) |
Cr is the concentration of free ligand and Ci the concentration of the different molecular complexes formed between green and red molecules. Ci can be expressed as
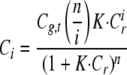 |
(Eq. 10) |
where Cg,t corresponds to the total concentration of green molecules (free and bound) and K is the binding constant in m–1.
The parameter Qi is the “green” quenching factor varying with i red molecules bound and can be expressed in terms of the quenching of the molecular brightness of the green molecule, qg = n′/n0, where n′ is the molecular brightness when there is ligand bound and η0 is in the absence of ligand, so that
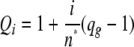 |
(Eq. 11) |
This equation holds as generalization for the case in which the number of effective binding sites, n*, is different from the maximum number of potential sites, n* ≠ n, because of steric hindrances; in this case we have assumed n* = n = 12.
The parameter qR is the quenching factor on the molecular brightness of the red molecule upon binding and can be obtained by finding the limit at which the saturation is obtained as the concentration of ligand goes to infinity,
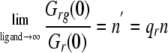 |
(Eq. 12) |
where n′ is the experimental number of sites that itself is a function of the true number of binding sites n. We used Mathematica 4.2 (Wolfram Research) to solve Equations 8, 9, 10, 11, 12 numerically when the amplitudes (Gr,g,rg(0)), the quench factors, and the effective volume were known. Then we could calculate the distribution of binding per site as
 |
(Eq. 13) |
To solve Equations 8, 9, 10, 11 numerically, one needs to make an assumption of the possible number of binding sites on the enzyme. This value can be extracted experimentally if we consider that the following binding polynomial holds between the concentration of green enzyme [g] and the concentration of red actin [r],
 |
(Eq. 14) |
where the binding polynomial O for n′ independent sites, assuming the same K for each site, is the nth product or (1 + K[r])n′. Then we can find the Langmuir equation that defines the reaction as
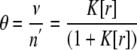 |
(Eq. 15) |
where ν represent the number of ligands bounds per enzyme. Equation 16 can be linearized as
 |
(Eq. 16) |
so that the number of binding sites corresponds to the inverse of the slope and the binding constant, K, is the inverse of the intersect divided by the number of binding sites.
One thing to remember is that the experimental n′ and true n are related by the quench factor, as in Equation 12, in the limit where there is an excess of ligand. Assuming n = 12 and obtaining n′ experimentally, we can extract the quenching factor on the red channel, qr, to minimize bias on the analysis.
RESULTS
F-actin binding can be assessed simply by forming actin filaments, adding the unknown protein, and sedimenting the actin filaments at moderate centrifugation speeds. Such a pulldown assay of F-actin was done in presence of the two main neuronal isoforms of CaMKII, α and β. If CaMKII is interacting, the protein is found in the pellet along with F-actin. After centrifugation, the pellet (p) and supernatant (s) fractions were collected and analyzed by SDS-PAGE (Fig. 1). On the gel we can see that in the presence of actin, the great majority of βCaMKII was found in the pellet (Fig. 1; see arrowhead), whereas the majority of αCaMKII remained in the supernatant. Controls with actin alone and the α- and βCaMKII alone were analyzed at the same time. Our observation was that, under these reaction conditions, a small fraction of βCaMKII was consistently found in the pellet (Fig. 1, +βCaMKII) in the absence of actin, and the proportion βCaMKII found in the pellet increased with the force of centrifugation (data not shown). This suggests that some aggregation of βCaMKII had occurred under these reaction conditions. αCaMKII did not exhibit this tendency (Fig. 1, +αCaMKII); however, a small amount of αCaMKII was consistently seen sedimenting with the F-actin (Fig. 1; +αCaMKII +actin). Whether it was trapped in the filaments, binding nonspecifically or binding to F-actin with weak affinity could not be determined from this assay. Overall, when F-actin was present, the great majority of βCaMKII was found in the pellet, indicating binding to the actin filaments. These results corroborate previous finding that βCaMKII interacts with F-actin (9, 10, 16).
βCaMKII Bundles Actin Filaments—Actin filaments were prepared in a similar fashion to that used in the pulldown assay, and then either α-or βCaMKII was added. An aliquot of the reactions was then applied to an EM grid and either negatively stained or directly frozen for cryoimaging. Fig. 2A shows an example of a densely packed bundle of actin filaments that was common in all samples in which βCaMKII was added to the filaments. Although difficult to see in these negatively stained preparations, βCaMKII holoenzymes can be identified interspersed within the actin filament bundle. In contrast, actin filaments by themselves or actin filaments with added αCaMKII never exhibited these long parallel bundles of filaments (data not shown). To facilitate identification, the inset (Fig. 2A) shows a blowup of the region indicated where the βCaMKII molecules are colored in yellow and the actin filaments in red. Such bundles have been described previously when βCaMKII interacts with F-actin (10); however, in past preparations it has been difficult to identify individual βCaMKII particles in the electron micrographs.
To confirm and further enhance the resolution of the interaction between βCaMKII and F-actin, similar samples were prepared and processed for cryoelectron tomography. This technique has the advantage of preserving the native structure of the molecular complexes by trapping them in a thin layer of vitreous ice, and complete three-dimensional reconstructions can be produced by processing a tilt series of images (See supplemental material for a complete video of the reconstruction). A slice through one such three-dimensional reconstruction is shown in Fig. 2B. From such an image, the βCaMKII holoenzymes can be easily identified and are seen bridging the individual actin filaments. Interestingly, in these cryopreserved specimens, one can appreciate better the rather uniform spacing produced between the actin filaments separated by the 20-nm-diameter βCaMKII holoenzymes. Also, under these reaction conditions, the great majority of βCaMKII holoenzymes were associated with the actin filaments, fully corroborating the actin pulldown experiments shown in Fig. 1.
To examine whether βCaMKII binding influences the formation of actin filaments, we utilized monitored fluorescence increases when pyrene-labeled G-actin underwent polymerization. Pyrene is an environmentally sensitive UV fluorophore that increases its quantum yield when actin monomers interact stably, as is the case when G-actin forms F-actin. Fig. 3 shows the time course of emitted fluorescence by the pyrene-actin as it polymerizes in the absence of CaMKII (squares). The rate of polymerization is influenced by the initial concentration of G-actin and the reaction conditions. For these experiments, the reaction conditions were adjusted to slow the rate of polymerization (to final concentrations of reagents of 12.5 mm KCl, 0.5 mm MgCl2, and 0.25 mm ATP) as discussed under “Experimental Procedures.” The relative polymerization rate can then be quantified by determining the slope of the curve over a window at the half-maximal value of each reaction; these results are described in fluorescence units/s. It is clear that when no CaMKII is present, actin polymerization follows a typical time course following the addition of the polymerization buffer. This is not the case when βCaMKII is added to pyrene-G-actin for 10 min before the addition of the polymerization buffer (Fig. 3, triangles). The β isoform reduced the rate of polymerization by almost 80% compared with the buffer-only controls. The rate of polymerization in the presence of βCaMKII was 18.3 ± 3.2 fluorescence units/s, with buffer alone being 82.3 ± 2.5 fluorescence units/s. Surprisingly, we also found that the addition of the αCaMKII holoenzyme produced a subtle, but statistically significant, decrease in the rate of actin polymerization (Fig. 3, circles) of 55.3 ± 4.3 fluorescence units/s. These results are distinct from those reported previously where neither α- nor βCaMKII was reported as impacting the polymerization rate of actin (10). As noted under “Experimental Procedures,” increasing the amount of 10× polymerization buffer added to the reactions (to final concentrations of 50 mm KCl, 2 mm MgCl2, and 1 mm ATP) diminished the impact that βCaMKII had on the rate of polymerization to <5% (data not shown), consistent with that reported previously (10). It was not possible from these experiments to determine whether βCaMKII inhibited the growth of actin filaments once nucleation had occurred or inhibited the nucleation process by decreasing the concentration of available G-actin. Because βCaMKII had not previously been examined for its capacity to bind to G-actin, we assessed this possibility using FCS and FCCS.
FIGURE 3.

Pyrene-actin polymerization assay. Increased fluorescence from pyrene-labeled G-actin was monitored at room temperature in a PTI fluorimeter to determine the rate of actin polymerization. Excitation was at 350 nm, and emission was monitored at 405 nm with slit widths of 1 and 10 nm, respectively. After a brief base line was collected, αCaMKII (circles), βCaMKII (triangles), or a control sample of the enzyme storage buffer (squares) was added to the quartz cuvette and incubated for 10 min. A small aliquot of actin polymerization inducer was then added, and fluorescence was monitored intermittently over the next 120 min. The slope of the line at the half-maximal was determined and showed that βCaMKII slowed actin polymerization by 78% compared with the 33% due to αCaMKII.
We had previously described the production and use of purified eGFP-αCaMKII to assess its diffusion and binding interactions with Ca2+/CaM using FCS and FCCS (24, 25). To gain additional insights into the interaction of actin and CaMKII, we employed a similar approach in the present study. FCS has the ability to extract diffusion coefficients and the concentrations of the labeled molecules. Binding of eGFP-CaMKII to G-actin or F-actin should slow its diffusion, which would be evident in a rightward shift of the autocorrelation curve. In Fig. 4A, the normalized autocorrelation function of eGFP-αCaMKII diffusing in buffer (D = 21 μm2/s), in solutions of G-actin or F-actin is shown (D = 13 μm2/s and D = 14 μm2/s, respectively). The presence of G-actin has only a minimal impact on the diffusion of eGFP-αCaMKII relative to buffer alone, as observed by the modest rightward shift in the autocorrelation curve (increased τD; decreased diffusion coefficient). In the presence of F-actin, there was a similar minimal increase in τD. Apparently, the F-actin network formed at this concentration of actin does not form a significant physical barrier to the diffusion of eGFP-αCaMKII even though the calculated mass of the molecule is 960 kDa. It is also important to recognize that fluctuation analysis, such as employed in the present FCS and FCCS analyses, requires that the molecules move in and out of the focal volume. If CaMKII interacts with the relatively immobile actin filament network, we will detect only added background counts, which will photobleach over time. Basically, this would mask the immobile fraction present in the samples and would not reveal CaMKII bound to an immobile actin network. We concluded from these data that eGFP-αCaMKII binds poorly to G- or F-actin.
FIGURE 4.

FCS analysis of interactions between CaMKII and G- or F-actin. FCS was accomplished at room temperature using a custom-built system described under “Experimental Procedures.” Normalized autocorrelation curves of eGFP-αCaMKII and eGFP-βCaMKII diffusing through solutions of F- and G-actin are shown in A and B, respectively. eGFP-αCaMKII (0.4 μm subunit concentration) does not show any significant difference in diffusion between monomeric actin or filamentous actin, with both at 21 μm. In B, the correlation curve of the eGFP-βCaMKII (0.4 μm subunit concentration) shows a significant rightward shift in the presence of G-actin, indicating interaction with the monomers that slowed diffusion. Slowed diffusion through F-actin was not evident for reasons discussed under “Results.”
On the other hand, when eGFP-βCaMKII was mixed with G-actin, a clear difference was evident in its diffusion (Fig. 4B). The rightward shift in the autocorrelation curve relative to buffer alone indicates that G-actin is interacting with eGFP-βCaMKII. The D for eGFP-βCaMKII in buffer was 11 μm2/s and in the presence of G-actin was reduced to 6 μm2/s. In the presence of F-actin, eGFP-βCaMKII shifted rightward only minimally, indicating a modest slowing of diffusion. This indicates that the F-actin network, formed at these actin concentrations, did not produce a significant barrier to diffusion. However, we know from the pulldown and EM studies that βCaMKII interacts with F-actin. We conclude that this is an example in which the immobile fraction is masked by the fluctuation analysis. Regardless of the interpretation of the data in F-actin, clearly the slowing of eGFP-βCaMKII diffusion in the presence of G-actin indicates that the enzyme is interacting with actin monomers.
A more direct assessment of interactions between βCaMKII and G-actin can be achieved by the use of a dual color system and cross-correlating the signal to quantify interactions between the two labeled molecules. The concept behind FCCS is shown diagrammatically in Fig. 5A, which illustrates molecules traversing the focal volume in either the bound or unbound state. Note that if each subunit of CaMKII in the 12-mer holoenzyme binds to an actin molecule, the ratio of CaMKII to actin could be as high as 1:12. The signals in the green and red channels are given by the eGFP-βCaMKII and Alexa 647-actin, respectively; when the molecules are bound they diffuse as one, producing fluctuations in the green and red signals that coincide in both channels. This cross-correlated signal can be used to obtain the concentration of the interacting fraction and their diffusive properties as described under “Experimental Procedures.” A representative example of the autocorrelation curves produced in a mixture of eGFP-βCaMKII (0.4 μm subunit concentration; green trace) and Alexa 647-actin (0.63 μm; red trace) is shown in Fig. 5B. Note that the y axis intercept of the autocorrelation curve is inversely proportional to the number of molecules in the focal volume. Knowing the focal volume, we can calculate molecular concentrations. Also shown in Fig. 5B is the cross-correlation curve (blue trace), which is better visualized in the expanded version shown in panel C along with the fits. First, the fit for the cross-correlation, Gr,g(τ), with one component allows us to find the diffusive component of the bound complex; this τDr,g was then fixed to fit the autocorrelation on the green and red channels independently with the two-component model using Equation 1. Note that the cross-correlation exhibits a longer τD than the autocorrelation curve of Alexa 647-actin, consistent with the diffusion of the bound molecules being dominated by the much larger eGFP-βCaMKII. It is also clear that the actin and the cross-correlation curves (Fig. 5, B and C) have lower amplitudes than that for the eGFP-CaMKII (shown only in panel B). In this experiment, the concentrations of eGFP-βCaMKII and Alexa 647-actin were adjusted to approximate the simplest case of a 1:1 binding ratio. In the case of a single binding site, the amplitude of the cross-correlation reaches a maximum value at the amplitude of the “ligand,” in this case the actin (32). Analysis of the data from Fig. 5 shows that ∼ 80% of the eGFP-βCaMKII holoenzymes interact with at least one actin monomer, as computed with Equation 7. These data show clearly that G-actin binds to βCaMKII.
FIGURE 5.

FCCS used to directly assess CaMKII binding to G-actin. A, schematic representation of FCCS where actin in shown in red and CaMKII in green. As molecules diffuse through the illuminated volume (light orange ellipse) in either the unbound or bound form, they are excited and emit photons. If the two molecules are bound, the red and green signals will cross-correlate. B, raw (not normalized) autocorrelation and cross-correlation of a mixture of monomeric Alexa 647-actin and eGFP-βCaMKII. Fits of the data were performed with Equations 2, 3, 4, 5 (see “Experimental Procedures”). Note that the values on the y axis are inversely proportional to the number of molecules in the focal volume. In this case, the green curve represents the autocorrelation of eGFP-βCaMKII, and the red curve represents the autocorrelation of Alexa 647-actin. The cross-correlation of both colors is represented by the blue data and their corresponding fit. Note that the τD of the cross-correlation signal is determined by the diffusion of eGFP-βCaMKII, whereas the signal (Gx) is determined by the concentration of the ligand. In this particular case, concentrations of the two reactants were adjusted to produce an approximate 1:1 binding. C, zoomed-in version of the autocorrelation of Alexa 647-actin and the cross-correlation of Alexa 647-actin and eGFP-βCaMKII presented in B. When the cross-correlation reaches the amplitude of the ligand (Alexa 647-actin in this case) the cross-correlation function is representative of a 1:1 binding.
Analysis using 1:n Stoichiometry—When the stoichiometry of binding involves situations in which more than one ligand can be bound to a target enzyme, the cross-correlation amplitude will exhibit an inverse relationship with the ligand concentration. In Fig. 6A, we present a titration of Alexa 647-actin plotted as a linear form of the Langmuir equation described by Equation 16. The inverse of the slope corresponds to the number of binding sites on the enzyme and the fit gives n′= 13, and the intercept gives a binding affinity of K = 1.0 × 10⁵ m–1. By using a 1:n binding model, in this case n = 12 for CaMKII, we can extract the distribution of binding into each holoenzyme as explained under “Experimental Procedures.” However, to do this, certain additional parameters are needed such as the quenching factor for the red channel. This can be determined using the results of Fig. 6A fitted with Equation 12 to obtain qr = 1.08, fixing the number of binding sites, n, at 12. Twelve binding sites are reasonable based on the dodecameric structure of CaMKII and from the fact that fits from the data in Fig. 6A provided an n′ of 13, quite close to the expected value. Using steady-state fluorescence, Alexa 647-actin binding to eGFP-βCaMKII did not produce significant changes in the emission profile of the Alexa 647-actin, which indicates that significant fluorescence energy transfer did not occur through the binding interaction (data not shown). The final parameter required for solving Equations 8, 9, 10, 11 is the quenching factor for the green channel or qg. This was obtained within each experiment by measuring the molecular brightness of eGFP-βCaMKII in the green channel with and without Alexa 647-actin; it ranged from 0.52 to 0.63, depending on the concentration of the reactants.
FIGURE 6.

Binding stoichiometry of Alexa 647-actin with eGFP-βCaMKII. A, shows the titration of actin labeled with Alexa 647 divided by the number of actin monomers bound to an enzyme (ν), as obtained by Equation 7. This ratio is plotted against the concentration of actin to fit it with the linearized form of the Langmuir relationship (Equation 16). The titration of actin goes from 0.3 to 10 μm. The data correspond to the mean value of two independent measurements ± S.D., each as described under “Experimental Procedures.” B and C, show the distribution of actin monomers per sites on the enzyme and occupancy number (Ci/Ctg) at the extremes of the titration experiment (0.3 and 10 μm), respectively. These results were obtained numerically by simultaneously solving Equations 8, 9, 10, 11. At 0.3 μm most of the enzyme (> 60%) is not bound to actin, whereas at 10 μm each enzyme has an average of 8–9 monomers of actin bound. The assumption is that no steric hindrances restrict the ability to bind up to 12 actin monomers to the enzyme and that higher order complexes are not formed.
With the needed parameters established, Equations 8, 9, 10, 11 were solved for each of the reaction conditions that produced the data points in Fig. 6A. The K calculated, using this methodology, for each of these points was not significantly different, so the values were averaged to provide a binding constant of K = 2.4 ± 0.4 × 10⁵ m–1. In addition to the binding constant, these FCCS results have the unique capability of permitting a computation of the occupancy number defined as the number of actin monomers bound per CaMKII holoenzyme (Ci/Cg,t). The distribution of this occupancy for the two extremes of the titration of actin (0.3 and for 10 μm) is shown in Fig. 6, B and C, respectively, maintaining eGFP-βCaMKII at 0.4 μm. At 0.3 μm actin, about 65% of the CaMKII molecules were in the unbound state, about 25% had one actin monomer bound, and about 5% had two actins bound. In contrast, at 10 μm actin, all of the eGFP-βCaMKII molecules were bound with actin, and a normal distribution was evident centered on 8–9 actin monomers bound/holoenzyme. We could not reach full binding (12:1) in these experiments because of saturation of the red detector channel by an overabundance of the Alexa 647-actin. Addition of unlabeled actin to dilute the Alexa 647-actin signal would significantly complicate the subsequent analysis and was therefore not pursued.
Ca2+/CaM Decreases Actin Binding to βCaMKII—The interaction of βCaMKII with F-actin was reported previously to be decreased by the binding of Ca2+/CaM (10, 16, 20). Using FCCS, we examined whether the interaction between monomeric actin and βCaMKII was also influenced by Ca2+/CaM. In Fig. 7A, cross-correlation data are presented showing that the amplitude of Gx(τ)/Gr(0) decreases when Ca2+-saturated CaM was added to the mix. This represents a reduction in the percentage of bound βCaMKII to actin monomers; quantification of these data is shown in Fig. 7B. The addition of CaM in the presence of the Ca2+ chelator EGTA showed a subtle increase of 20% of bound Alexa 647-actin to eGFP-βCaMKII enzymes, whereas the addition of Ca2+/CaM decreased the amount of bound complexes by 44% relative to the basal condition.
FIGURE 7.

Ca2+/CaM modulation of CaMKII binding to monomeric actin. FCCS was accomplished as described in the legend for Fig. 6. A, normalized data are presented showing the cross-correlation of Alexa 647-actin and eGFP-βCaMKII without (black line) or with Ca2+/CaM (gray line) added to the reaction. Note that the addition of Ca2+/CaM significantly decreases the cross-correlation amplitude indicative of less binding between CaMKII and actin. B, quantified data from three experiments ± S.D. The percentage of bound eGFP-CaMKII with actin monomers under basal conditions, when EGTA (Ca2+ chelator) is added and when Ca2+/CaM is added to the reaction, are shown. These results show that the binding of eGFP-CaMKII is decreased by Ca2+/CaM.
DISCUSSION
We have shown in this report that βCaMKII interacts with both F- and G-actin. F-actin interactions were shown earlier using biochemical assays and EM analysis (10, 20), but previous EM studies were focused on the large scale bundling of F-actin and did not reveal interactions between the enzyme and actin filaments. These earlier EM studies also used negatively stained preparations, which could obscure and/or distort some of the details of these interactions. Using cryoelectron tomography, we were able to clearly show βCaMKII interacting with multiple F-actin filaments in well organized molecular assemblies. This clearly identifies βCaMKII as a molecular scaffolding protein bridging actin filaments together with a spacing of about 15–20 nm, the approximate diameter of a CaMKII holoenzyme. The multivalent nature of each CaMKII holoenzyme provides numerous possibilities for forming elaborate and stable contacts with the actin cytoskeleton. We are presently employing various image analysis strategies to determine higher resolution structures of CaMKII molecules bound to the actin filament to identify the region of the molecule that interacts with the actin filament.
A previous study indicated that βCaMKII does not significantly impact the polymerization of actin filaments (10), although on close inspection of those data, the presence of βCaMKII shows a trend toward inhibition. Using the same pyrene-actin-based fluorescence assay, we discovered that βCaMKII produced a significant decrease in the rate of actin polymerization but that a decrease in the concentration of reagents that induce polymerization was necessary to reveal this important effect. If we use standard reaction conditions like those reported in Okamoto et al. (10), we see the same modest (<5%) inhibition of actin polymerization by βCaMKII. Thus, βCaMKII not only interacts with F-actin to bundle filaments, but it also interacts with actin to prevent its polymerization. Two mechanistic ways that βCaMKII could impact the polymerization in this assay are (a) serving as a capping protein to limit the extension of filaments; or (b) reducing the probability of actin nucleation by reducing the number of available actin monomers through direct binding (33). Our EM analysis did not reveal evidence of βCaMKII binding preferentially to the ends of filaments to cap their growth, and we favor the latter possibility of binding to G-actin to explain the decreased rate of polymerization.
To investigate directly the binding of βCaMKII with monomeric actin, we employed FCS and FCCS. Using these techniques we showed that βCaMKII indeed bound to monomeric actin and that the binding constant was ∼ 2.4 ± 0.4 × 10⁵ m–1 when each experiment was considered independently. However, we obtained a binding constant of 1.0 × 10⁵ m–1 (Fig. 6A). We credit the slightly more than 2-fold difference to a possible experimental offset on the y axis of the experimental data fitted with the linearized Langmuir equation. This would screen the true binding constant. Another consideration is that in using Equations 7, 8, 9, 10, each experiment could be considered independent, increasing the statistical confidence of the linear regression shown in Fig. 6A. This leads to a Kd for βCaMKII binding to G-actin in the 4–10 μm range, which is slightly weaker than or equal to other actin-binding proteins. For example, the β-thymosins, profilin and talin, bind to G-actin with affinities in the 0.1 to 1 μm range, whereas proteins such as α-actinin and spectrin bind to F-actin in the 1 to 25 μm range (1). It is noteworthy that βCaMKII concentrations are estimated to be between 10 and 40 μm in neurons and the concentration of actin is ∼80–100 μm (∼ 4 mg/ml), with half as G-actin and half as F-actin (2). For argument, if we assume a Kd of 4 μm with βCaMKII at 20 μm and G-actin at 40 μm, ∼85% of the G-actin would be bound at steady state, creating a significant impact on the pool of available G-actin. The interaction of βCaMKII with F-actin was reported to be much tighter, in the tens of nm range (16). This would be anticipated because of the multivalent nature of βCaMKII, providing the possibility that multiple subunits within one holoenzyme can interact with multiple actin molecules within or between filaments. The higher affinity for F-actin could also explain why βCaMKII would help stabilize actin bundles. From the stoichiometric analysis, it was also possible to conclude that as many as 12 actin monomers could bind to each βCaMKII holoenzyme and that the occupancy number of actin binding per site on the enzyme could be calculated under conditions of increasing amounts of monomeric actin.
It was shown previously that the binding interaction of βCaMKII with F-actin is diminished by the presence of Ca2+/CaM (10, 16, 20, 34). A model was proposed whereby influx of Ca2+ and activation and binding of CaM to βCaMKII would cause its dissociation from F-actin, permitting local reorganization of the actin cytoskeleton (10). Using FCCS, we also showed that Ca2+/CaM binding reduced the interactions of βCaMKII with monomeric actin. So, increased intracellular Ca2+ would not only lead to βCaMKII release from and unbundling of actin filaments, but it would also lead to the local release of monomeric actin that would then be available for additional growth of the actin cytoskeleton. Interestingly, Okamoto et al., (10) reported that βCaMKII slows fluorescence recovery of eGFP-actin after photobleaching but had with an indirect explanation for this effect. As we have shown that βCaMKII can bind to monomeric actin, it seems probable that this direct interaction is responsible for at least part of the slowed diffusion in their experiments. The additional discovery that βCaMKII can bind to monomeric actin and impact polymerization places CaMKII in an even more central role in the process of structural remodeling involving the actin cytoskeleton. Using live cell imaging techniques, several groups have identified that βCaMKII co-localizes with the actin cytoskeleton and that a stretch of amino acids following the CaM-binding domain and preceding the association domain is responsible for actin binding (10, 18, 20, 34). Given our present understanding of the three-dimensional structure of CaMKII (11, 35), this domain likely resides in the stalk-like region between the core of the association domains and the catalytic domains at the end of the stalks. From a functional perspective, βCaMKII has been shown to impact neurite extension and synapse formation (10, 34) and the formation of actin rich “microspikes” in cultured cortical neurons (18). Interestingly, catalytically inactive mutants and mutants lacking their catalytic domains were competent to cause these functional changes, whereas the monomeric and active forms of βCaMKII were not. Clearly, the oligomeric structure of βCaMKII is essential to fulfill this important role of bundling actin filaments, leading to the morphogenic changes in dendritic and synaptic growth. What is clear from other work in neurons is that both actin and CaMKII are responsible for regulating the structure of dendrites and spines (19, 36).
CaMKII in neurons is composed of two main isoforms, α and β, that can assemble into mixed holoenzymes. Although αCaMKII binds poorly to the actin cytoskeleton, when β-subunits are included with α-subunits the mixed holoenzyme will target to the actin cytoskeleton (19). αCaMKII is also known to be recruited to synapses in an activity-dependent fashion where it has the potential to interact with a variety of other proteins that associate with the actin cytoskeleton or the post-synaptic density (for reviews see Refs. 37 and 38). One of the most recent models put forward (10) suggests that CaMKII bundles actin filaments at rest (through β-subunit interactions with actin), maintaining the basic structure of the spine. When spines are activated through intracellular Ca2+ increases, CaMKII is released from the actin filaments and additional CaMKII is recruited into the spine. When the Ca2+ signal is terminated, the increased amount of CaMKII reforms associations with the actin cytoskeleton that establish an enlarged synapse. This enlarged synaptic structure correlates with an increase in synaptic strength. Our present data extend the role of CaMKII in this model to include the important regulation of actin polymerization, which ultimately controls the density of filaments that form the cytoskeleton. So, not only does CaMKII stabilize the actin cytoskeleton through bundling, but it also regulates the density of actin filaments by controlling their polymerization.
Although the analysis of CaMKII and actin dynamics in neurons has taken center stage, CaMKII isoforms exist in all cells, and these isoforms might play similar roles in the regulation of actin dynamics. For example, splice variants of the β isoform of CaMKII are found in pancreatic islet cells and skeletal muscle, which also interact with the actin cytoskeleton (20). The widely expressed δ isoform of CaMKII has also been reported to interact with the actin cytoskeleton (39). Future studies will necessarily examine whether these other isoforms have similar or unique effects on bundling actin filaments and/or binding to G-actin to impact polymerization.
Supplementary Material
Acknowledgments
We thank Dr. Katrin Heinze for guidance in setting up the FCCS and for providing the Mathematica script for FCCS data analysis. The Polara electron microscope was supported, in part, through the Structural Biology Center at the University of Texas Health Science Center-Houston.
This work was supported, in whole or in part, by National Institutes of Health Grant R01 NS26086 from NINDS (to M. N. W.).
The on-line version of this article (available at http://www.jbc.org) contains supplemental Fig. S1 and a video.
Footnotes
The abbreviations used are: CaMKII, Ca2+/calmodulin-dependent protein kinase II; CaM, calmodulin; αCaMKII, the α isoform of Ca2+/calmodulin-dependent protein kinase II; βCaMKII, the β isoform of Ca2+/calmodulin-dependent protein kinase II; eGFP, enhanced green fluorescent protein; G-actin, globular actin; F-actin, filamentous actin; FCS, fluorescence correlation spectroscopy; FCCS, fluorescence cross-correlation spectroscopy; EM, electron microscopy; CCD, charge-coupled device.
References
- 1.Kreis, T., and Vale, R. (1999) Guidebook to the Cytoskeletal and Motor Proteins, pp. 3–14, Oxford University Press, Oxford
- 2.Bean, A. (2007) Protein Trafficking in Neurons, pp. 3–27, Elsevier/Academic Press, Amsterdam
- 3.Matus, A. (2000) Science 290 754–758 [DOI] [PubMed] [Google Scholar]
- 4.Matus, A., Brinkhaus, H., and Wagner, U. (2000) Hippocampus 10 555–560 [DOI] [PubMed] [Google Scholar]
- 5.Colicos, M. A., Collins, B. E., Sailor, M. J., and Goda, Y. (2001) Cell 107 605–616 [DOI] [PubMed] [Google Scholar]
- 6.Chi, P., Greengard, P., and Ryan, T. A. (2001) Nat. Neurosci. 4 1187–1193 [DOI] [PubMed] [Google Scholar]
- 7.Halpain, S. (2003) Nat. Neurosci. 6 101–102 [DOI] [PubMed] [Google Scholar]
- 8.Fukazawa, Y., Saitoh, Y., Ozawa, F., Ohta, Y., Mizuno, K., and Inokuchi, K. (2003) Neuron 38 447–460 [DOI] [PubMed] [Google Scholar]
- 9.Honkura, N., Matsuzaki, M., Noguchi, J., Ellis-Davies, G. C., and Kasai, H. (2008) Neuron 57 719–729 [DOI] [PubMed] [Google Scholar]
- 10.Okamoto, K., Narayanan, R., Lee, S. H., Murata, K., and Hayashi, Y. (2007) Proc. Natl. Acad. Sci. U. S. A. 104 6418–6423 [DOI] [PMC free article] [PubMed] [Google Scholar]
- 11.Kolodziej, S. J., Hudmon, A., Waxham, M. N., and Stoops, J. K. (2000) J. Biol. Chem. 275 14354–14359 [DOI] [PubMed] [Google Scholar]
- 12.Kennedy, M. B. (2000) Science 290 750–754 [DOI] [PubMed] [Google Scholar]
- 13.Swulius, M. T., and Waxham, M. N. (2008) Cell Mol. Life Sci. 65 2637–2657 [DOI] [PMC free article] [PubMed] [Google Scholar]
- 14.Gaertner, T. R., Kolodziej, S. J., Wang, D., Kobayashi, R., Koomen, J. M., Stoops, J. K., and Waxham, M. N. (2004) J. Biol. Chem. 279 12484–12494 [DOI] [PubMed] [Google Scholar]
- 15.Erondu, N. E., and Kennedy, M. B. (1985) J. Neurosci. 5 3270–3277 [DOI] [PMC free article] [PubMed] [Google Scholar]
- 16.Ohta, Y., Nishida, E., and Sakai, H. (1986) FEBS Lett. 208 423–426 [DOI] [PubMed] [Google Scholar]
- 17.Shen, K., Teruel, M. N., Subramanian, K., and Meyer, T. (1998) Neuron 21 593–606 [DOI] [PubMed] [Google Scholar]
- 18.Lin, Y. C., and Redmond, L. (2008) Proc. Natl. Acad. Sci. U. S. A. 105 15791–15796 [DOI] [PMC free article] [PubMed] [Google Scholar]
- 19.Fink, C. C., Bayer, K. U., Myers, J. W., Ferrell, J. E. Jr., Schulman, H., and Meyer, T. (2003) Neuron 39 283–297 [DOI] [PubMed] [Google Scholar]
- 20.O'Leary, H., Lasda, E., and Bayer, K. U. (2006) Mol. Biol. Cell 17 4656–4665 [DOI] [PMC free article] [PubMed] [Google Scholar]
- 21.Deleted in proof
- 22.Feuer, G., Molnar, F., Pettko, E., and Straub, F. B. (1948) Hung. Acta Physiol. 1 150–163 [PubMed] [Google Scholar]
- 23.Putkey, J. A., and Waxham, M. N. (1996) J. Biol. Chem. 271 29619–29623 [DOI] [PubMed] [Google Scholar]
- 24.Kim, S. A., Heinze, K. G., Waxham, M. N., and Schwille, P. (2004) Proc. Natl. Acad. Sci. U. S. A. 101 105–110 [DOI] [PMC free article] [PubMed] [Google Scholar]
- 25.Kim, S. A., Heinze, K. G., Bacia, K., Waxham, M. N., and Schwille, P. (2005) Biophys. J. 88 4319–4336 [DOI] [PMC free article] [PubMed] [Google Scholar]
- 26.Kremer, J. R., Mastronarde, D. N., and McIntosh, J. R. (1996) J. Struct. Biol. 116 71–76 [DOI] [PubMed] [Google Scholar]
- 27.Winkler, H., and Taylor, K. A. (2006) Ultramicroscopy 106 240–254 [DOI] [PubMed] [Google Scholar]
- 28.Iyer, V., Rossow, M., and Waxham, M. N. (2006) J. Opt. Soc. Am. B 23 1420–1433 [Google Scholar]
- 29.Sanabria, H., Kubota, Y., and Waxham, M. N. (2007) Biophys. J. 92 313–322 [DOI] [PMC free article] [PubMed] [Google Scholar]
- 30.Schwille, P., Meyer-Almes, F. J., and Rigler, R. (1997) Biophys. J. 72 1878–1886 [DOI] [PMC free article] [PubMed] [Google Scholar]
- 31.Schwille, P., and Heinze, K. G. (2001) Chemphyschem 2 269–272 [DOI] [PubMed] [Google Scholar]
- 32.Kohl, T., Heinze, K. G., Kuhlemann, R., Koltermann, A., and Schwille, P. (2002) Proc. Natl. Acad. Sci. U. S. A. 99 12161–12166 [DOI] [PMC free article] [PubMed] [Google Scholar]
- 33.Harris, E. S., and Higgs, H. N. (2006) Methods Enzymol. 406 190–214 [DOI] [PubMed] [Google Scholar]
- 34.Fink, C. C., and Meyer, T. (2002) Curr. Opin. Neurobiol. 12 293–299 [DOI] [PubMed] [Google Scholar]
- 35.Rosenberg, O. S., Deindl, S., Sung, R. J., Nairn, A. C., and Kuriyan, J. (2005) Cell 123 849–860 [DOI] [PubMed] [Google Scholar]
- 36.Kaech, S., Parmar, H., Roelandse, M., Bornmann, C., and Matus, A. (2001) Proc. Natl. Acad. Sci. U. S. A. 98 7086–7092 [DOI] [PMC free article] [PubMed] [Google Scholar]
- 37.Okabe, S. (2007) Mol. Cell Neurosci. 34 503–518 [DOI] [PubMed] [Google Scholar]
- 38.Sheng, M., and Hoogenraad, C. C. (2007) Annu. Rev. Biochem. 76 823–847 [DOI] [PubMed] [Google Scholar]
- 39.Caran, N., Johnson, L. D., Jenkins, K. J., and Tombes, R. M. (2001) J. Biol. Chem. 276 42514–42519 [DOI] [PubMed] [Google Scholar]
Associated Data
This section collects any data citations, data availability statements, or supplementary materials included in this article.