Abstract
AIM: To evaluate the effect of intrahepatic trans-plantation of hepatic oval cells (HOC) on fulminant hepatic failure (FHF) in rats.
METHODS: HOC obtained from rats were labeled with green fluocescent protein (GFP) or 5, 6-carboxyfluorescein diacetate succinmidyl ester (CFDA-SE). Cell fluorescence was observed under fluorescent microscope at 6, 24, 48 and 72 h after labeling. CFDA-SE labeled HOC (5 × 10⁶ cells each rat) were injected into livers of rats with FHF induced by D-galactosamine. Serum albumin (ALB), alanine aminotransferase (ALT), aspartate aminotransferase (AST) and total bilirubin (TBil) levels were measured at different time points. Liver function of rats was examined on days 3, 7, 14 and 21 after HOC transplantation.
RESULTS: The positive rate of GFP and CFDA-SE labeled HOC was 10% and 90%, respectively, with no significant change in cell viabilities. The survival rate was higher in HOC transplantation group than in control group, especially 48 (9/15 vs 6/15) and 72 h (9/15 vs 4/15) after HOC transplantation. The serum ALT, AST and TBil levels were decreased while the serum Alb level was increased after HOC transplantation. Fluorescence became faded and diffused in liver tissues, suggesting that proliferation and differentiation occur in transplanted HOC.
CONCLUSION: CFDA-SE is superior to GFP in labeling HOC, although fluorescence intensity is decreased progressively with cell division. HOC transplantation can improve the liver function and increase the survival rate of recipients.
Keywords: Liver, Stem cells, Hepatic oval cells, Fluorescence labeling, Transplantation, Fulminant hepatic failure
INTRODUCTION
Hepatic oval cells (HOC) are liver stem cells with a self-renewal capacity and a high proliferation potential[1]. Transplantation of HOC cultured in vitro can restore damaged liver function, thus providing more opportunities for patients with terminal-stage liver diseases[2,3]. In this study, we established a rat HOC proliferation model by feeding 2-acetylaminofluorie (2-AAF) and resecting 2/3 liver. HOC were isolated, purified and labeled with 5, 6-carboxyfluorescein diacetate succinmidyl ester (CFDA-SE), a fluorescence agent, before they were transplanted into the rats with fulminant hepatic failure (FHF). Then, we detected the fluorescence distribution in the recepient liver and a few laboratory indexes, trying to find the effect of HOC transplantation on FHF.
MATERIALS AND METHODS
Animals and reagents
Wistar rats were provided by the Animal Experimental Center of the Radiation Institute, Chinese Academy of Sciences (Beijing, China). 2-AAF was purchased from Sigma and D-galactosamine (D-GalN) was provided by Chongqing Medical University (Chongqing, China). E. coli strain harboring plasmids carrying the GFP gene, Pmax-GFP, was produced by Amaxa. Fugene HD transfection regent was from Rocheand. CFDA-SE was from Molecular Probes.
Establishment of a rat HOC proliferation model
Twenty healthy Wistar rats, weighing 180-220 g, received intra-gastric 2-AAF, 15 mg/kg per day, for 4 d. On day 5, the rats were anesthetized with 1% sodium pentobarbital and their left and middle liver lobes (about 2/3 of the liver volume) were resected. From day 6, the rats were given 2-AAF, 15 mg/kg per day, for additional 10 d to induce a rat HOC proliferation.
Isolation, cultivation and identification of HOC
Hepatic cells were separated from the rat model by the improved in situ perfusion of Seglen collagenase[4]. HOC were purified from the separated hepatic cells by Percoll density gradient centrifugation and inoculated in a DMEM/F12 culture medium at a concentration of 1 × 10⁶/mL. The cells were cultured at 37°C in an atmosphere containing 50 mL/L CO2, and half of the medium was changed every two days. Cell morphology and expansion were regularly observed under an inverted microscope. The cells were passaged when necessary and observed under an electronic microscope. OV-6, AFP, ABL and PCNA, expressed on cells were tested by immunohistochemical assay.
Fugene HD-mediated transfection of HOC with the GFP gene
HOC were transfected with Fugene HD transfection regent following its manufacturer’s instructions. Briefly, HOC at passage 1 were seeded onto 12-well plates at a density of 2 × 10⁵/mL. One day later, transfection compounds at different ratios [transfection agent (μL): plasmid (μg) = 3:2, 4:2, 5:2, 6:2, 7:2 and 8:2] were added to the culture medium and shaken for 30 s at a low speed to ensure a homogeneous mixture. Then, the cells were incubated at 37°C in a humidified atmosphere containing 50 mL/L CO2. After 6, 12, 24, 48 and 72 h, samples were taken from three random sections in each well and observed under an inverted confocal microscope and 100 cells were counted. GFP expression in these cells was observed under a fluorescence microscope with the excitation wavelength at 488 nm and the emission wavelength at 507 nm. The transfection rate was calculated according to the following equation: transfection rate (%) = number of green fluorescent cells in dark field/number of cells in bright field. The cell proliferation was determined by 3-(4,5-dimethylthiazolzyl)-2,5-diphenyltetrazolium bromide (MTT) colorimetry and growth curves were plotted.
HOC labeling by fluorochrome CFDA-SE
Passage 1 HOC, reaching an approximate confluence of 80%, were adjusted to 1 × 10⁶/mL in serum-free PBS with 5 μmol/L CFDA-SE and incubated at 37°C for 10 min. After the same volume of complete medium was added to terminate the staining, cells were separated by centrifugation and the staining was repeated three times before incubation. After 0, 6, 24 and 72 h, the cells were observed under a fluorescence microscope at 488 nm. Cell growth activity was also determined by MTT colorimetry and growth curves were plotted.
HOC transplantation for FHF in rats
Thirty Wistar rats were intra-peritoneally injected with a 10% D-GalN solution at a dose of 1400 mg/kg to induce FHF. One day after FHF induction, rats were divided into transplantation group (n = 15) and control group (n = 15). Rats in HOC proliferation model were anaesthetized at the supine position, and a 1.5 cm incision was made at the middle of the upper abdomen to expose the liver. The number of fluorescence labeled HOC was adjusted to 1 × 10⁷/mL for transplantation. Rats in the transplant group were injected with 0.5 mL CFDA-SE labeled HOC suspension in the left lobe of liver, while rats in the control group were given the same volume of culture medium. After 1, 2, 3, 5 and 7 d of transplantation, blood sample was taken from the rat tail and liver function was determined with an automatic biochemical analyzer. Albumin (ALB), alanine aminotransferase (ALT), aspartate aminotransferase (AST) and total bilirubin (TBil) levels were measured. After 3, 7, 14 and 21 d, the animals were killed and their livers were removed for pathological examination. Frozen liver tissue around the injected site was cut into sections to observe the distribution of fluorescence labeled cells in the liver tissue under a fluorescent microscope.
Statistical methods
All data were analyzed by SPSS 13.0. Two sets of sample means (mean ± SD) were compared by t-test and the percentages were compared by χ2-test. P < 0.05 was considered statistically significant.
RESULTS
HOC incubation
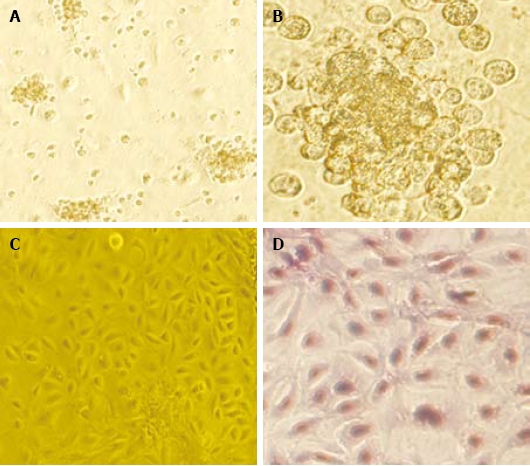
The freshly separated rat HOC adhered to the wall after 12 h of incubation were spindle or polygonal in shape. After about 7 d, the cells grew into colonies. The HOC, 10 d after passage, grew into a single-layer flagstone which did not change 14 d after passage (Figure 1).
Figure 1.

HE stained HOC 10 h (A, × 100), 7 (B, × 400), 10 (C, × 100), and 14 d (D, × 200) after incubation.
Morphological and phenotypic identification of the cells
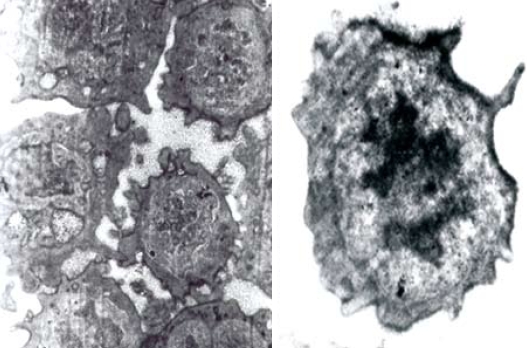
The expression of OV-6, AFP and ALB in HOC was detected by immunohistochemistry. Positive staining of OV-6 and AFP was detected in isolated HOC while no ALB expression was found in HOC. Electron microscopy showed short and tiny microvilli-like protuberances on the surface of HOC. The cell nuclei were oval with dispersed and homogenous nuclear chromatin, small nucleoli, little cytoplasm, great nucleus-cytoplasm ratio and underdeveloped endoplasmic reticulum, mitochondria and ribosome (Figure 2), indicating that incubated HOC are primitive, naive and undifferentiated.
Figure 2.

Ultra-structure of rat HOC under electron microscope (× 4000).
HOC labeling
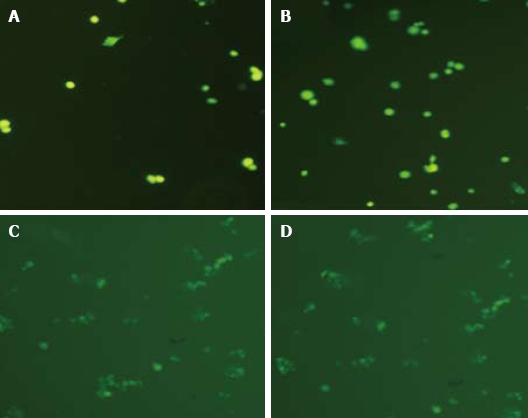
Six hours after transfection with the GFP gene, a low GFP expression level in some HOC could be observed under a fluorescent microscope. The GFP gene was expressed both in nuclei and in cytoplasm. Its expression increased significantly after 24 h, reached its peak at 48 h and maintained till 72 h. A higher transfection efficiency (about 10.0%) could be achieved at a transfection reagent-plasmid ratio of 5:2. The fluorescent intensity of transfected cells was gradually reduced and disappeared after 5-7 generations. Green fluorescence could be observed immediately after CFDA-SE labeling, with a labeling rate of 90%. The fluorescence intensity decreased slightly after 6 h and significantly after 24 h. However, the fluorescence intensity was almost the same at 72 h and 24 h (Figure 3).
Figure 3.

CFDA-SE stained HOC at 0 h (A, × 200), 6 h (B, × 200), 24 h (C, × 100), and 72 h (D, × 100).
Liver functions and survival of FHF rats after HOC transplantation
The rats in HOC transplantation group slightly restored their general conditions, food taking and movements 48 h after transplantation. On the contrary, the conditions of most rats in control group were further exacerbated. The serum ALB, AST, ALT and TBiL levels in rats of both groups are listed in Table 1. Death occurred in rats of both groups around 6 h after transplantation. However, no rat died in transplantation group 72 h after transplantation. The survival rate for rats in transplantation group and control group was 60% (9/15) and 26.7% (4/15), respectively.
Table 1.
Changes of ALB, ALT, AST and TBilL levels in rat liver tissue after HOC transplantation (mean ± SD)
| Groups (survival) | ALB (g/L) | ALT (U/L) | AST (U/L) | TBilL (μmol/L) | |
| Transplantation 0 d | Control (15) | 14.6 ± 1.9 | 757.3 ± 47.2 | 348.0 ± 66.5 | 55.4 ± 7.1 |
| Transplantation (15) | 15.2 ± 2.4 | 736.3 ± 58.1 | 357.4 ± 42.3 | 50.6 ± 4.6 | |
| 1 d after transplantation | Control (10) | 13.4 ± 2.5 | 789.6 ± 27.5 | 384.6 ± 73.3 | 56.6 ± 7.1 |
| Transplantation (10) | 14.2 ± 1.8a | 803.3 ± 62.4a | 375.3 ± 49.2a | 61.6 ± 19.2a | |
| 2 d after transplantation | Control (6) | 11.6 ± 1.6 | 873.5 ± 43.2 | 409.0 ± 31.8 | 60.3 ± 6.5 |
| Transplantation (9) | 20.3 ± 1.3b | 649.0 ± 90.3b | 263.3 ± 28.2b | 53.0 ± 4.2a | |
| 3 d after transplantation | Control (4) | 9.8 ± 0.6 | 896.6 ± 44.8 | 434.3 ± 25.4 | 46.3 ± 3.7 |
| Transplantation (9) | 26.3 ± 0.9b | 430.0 ± 28.3b | 124.6 ± 21.6b | 23.7 ± 6.9b | |
| 5 d after transplantation | Control (3) | 13.5 ± 1.2 | 774.6 ± 26.7 | 326.6 ± 15.5 | 45.8 ± 4.3 |
| Transplantation (8) | 27.8 ± 2.6b | 377.3 ± 29.4b | 106.0 ± 15.3b | 19.5 ± 5.2b | |
| 7 d after transplantation | Control (3) | 19.7 ± 1.6 | 564.2 ± 43.2 | 246.3 ± 26.7 | 32.3 ± 5.0 |
| Transplantation (8) | 31.5 ± 2.6b | 333.3 ± 36.4b | 89.3 ± 13.2b | 6.9 ± 1.8b |
aP < 0.05, bP < 0.01 vs control group.
Fluorescent microscopy after HOC transplantation
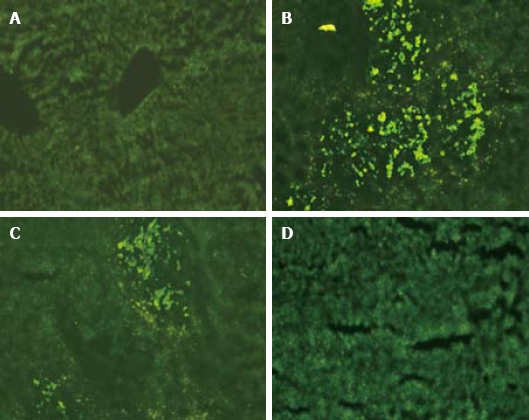
Green fluorescent cell colonies ccould be seen in sections of frozen rat liver tissue three days after transplantation. Most fluorescent colonies were located at the injection site with a strong fluorescent intensity. The fluorescent intensity decreased seven days after transplantation but the number of colonies increased with a wider distribution. No fluorescent cell was detected in the liver sample 14 d after HOC transplantation and afterwards (Figure 4).
Figure 4.

Fluorescent microscopy showing colonies in control group (A), and 3 (B), 7 (C) and 14 d (D) after HOC transplantation (× 100).
DISCUSSION
The Solt-Farber model[4] is the most commonly used model for HOC proliferation, and has been used in studying the relationship between local disease and liver cancer or between nodules and liver cancer. Collagenase perfusion, proposed by Howard et al[5] and improved by Berry and Seglen et al[6,7], is often used in detection of HOC separation. In this study, Solt-Farber model was used to detect HOC proliferation, and a large amount of small proliferation focuses were found in portal area. The HOC were oval or oblong in shape, and their size was much smaller than that of hepatic cells (about 1/6-1/3 of the normal size). Moreover, immunohistochemical staining showed positive OV-6 and AFP expression, consistent with the traits of HOC. The positive PCNA staining showed that HOC were at their proliferating stage and that HOC proliferation in liver of adult rats could be induced by 2-AAF injection and 2/3 liver resection. After the proliferation model was established, suspended hepatic cells were prepared by two-step collagenase perfusion. The cells were purified by density gradient centrifugation and observed under an electron microscope. The purified cells were primitive, naive and undifferentiated. Immunohistochemical staining of OV-6 and AFP in the freshly separated cells was similar to that of proliferated cells in the model. The cells showed a certain proliferation capacity in culture and were heterogenous as previously reported[8–10].
The therapeutic effect of HOC transplantation on FHF has been proved both in animal models and in clinical trials[11,12]. Matsusaka et al[13] transplanted hepatic cells with a large number of HOC into the spleen of rats, and found that hepatic cells can significantly proliferate compared to those without HOC. Yasui et al[14] transplanted HOC into the liver of Nagase rats (a family of rats with inherited serum albumin deficiency), and showed that the serum albumin level maintained high in these rats for 10 wk, indicating that HOC have differentiated into mature and functional hepatic cells. In this study, the rat FHF model was induced by D-GalN, into which rat HOC were transplanted. Biochemical assay showed the liver functions and pathological lesions of rats were slightly improved 48 h after transplantation. Moreover, the ALB and ALT levels were decreased in the following days, indicating that the transplanted HOC can survive in rats with FHF, and proliferate and differentiate to replace the damaged hepatic cells. The effect of HOC transplantation on FHF is related to the strong proliferation and differentiation of HOC into mature hepatic cells and biliary epithelial cells, which consequently benefit rat survival. In addition, liver failure elicits liver regeneration and up regulation of hepatocyte growth factors. These cytokines, forming a suitable microenvironment, are necessory for the survival, growth and proliferation of transplanted HOC. Thus, newly regenerated hepatocytes compensate the damaged liver function, their robust activity may interact with adjacent cells and rescue some damaged liver cells with reversible pathologic lesions.
It is essential to appropriately label the transplanted cells to track their location and function in receptor. Both GFP and CFDAS-SE are fluorescent labels for in vivo cell transplantation, but CFDA-SE showed superior properties in this study. CFDA-SE, a fluorescent dye, has been applied in various fields of immunology due to its stability and long duration. When cells divide, CFDA-SE is equally divided into two daughter cells, leading to an exponential decrease in fluorescence intensity with cell proliferation and division[15]. In this study, CFDA-SE labeled HOC were transplanted in rats with FHF. Seventy-two hours after transplantation, green fluorescent colonies could be observed in sections of frozen liver tissue. The fluorescence intensity was strong but the colonies were only found near the injection site. On day 7, the fluorescence intensity of the transplanted cells decreased but transplanted cells were widely distributed, indicating that HOC have proliferated and differentiated into hepatic cells. Therefore, multiple green fluorescent colonies could be observed.
In conclusion, labeled HOC transplantation exerts its effects on FHF by improving the serum levels of ALT, AST, and TBil. However, since fluorescence intensity of CFDA-SE decreases with cell division, it is still not the ideal label for cell transplantation. Further study is needed on the location and distribution of transplanted HOC.
COMMENTS
Background
Fulminant hepatic failure is a serious clinical disease and may threaten the life of patients. However, because of the damage of mass liver cells, the organ function is often irreversible due to the liver cell degeneration, swelling, or apoptosis. Thus, to supply new sources of functional liver cells is a valuable choice for these patients.
Innovations and breakthroughs
The cultured hepatic oval cells (HOC) can provide cells for liver cell transplantation and even for biological artificial liver, thus solving the problem of liver donor shortage. In this study, a rat HOC proliferation model was established and the HOC were isolated, purified, labeled with CFDA-SE (a fluorescence agent), and transplanted into rats with fulminant hepatic failure (FHF). Then the authors detected the fluorescence distribution in the receptor liver to observe the role of HOC transplantation in FHF treatment.
Applications
The study indicated that transplantation of hepatic oval cells was a potential therapeutic strategy for the treatment of fulminant hepatic failure.
Terminology
HOC: liver stem cells with a self-renewal capacity and a high proliferative potential. FHF is usually defined as the severe impairment of hepatic functions in the absence of preexisting liver disease. 5,6-carboxyfluorescein diacetate succinimidyl ester (CFDA-SE): a fluorescence agent
Peer review
The manuscript reports a therapeutic potential of transplantation of hepatic oval cells for fulminant hepatitis. Although liver transplantation is the most effective therapy for fulminant hepatitis at present, cell-based therapy could be an alternative treatment modality. The data presented are encouraging and promising.
Supported by Tianjin Science Committee, Grant No. 05SYSYJC02600 and Tianjin Health Bureau, Grant No. 05KYR01
Peer reviewers: Ezio Laconi, MD, PhD, Professor of General Pathology, Department of Sciences and Biomedical Technologies, Unit of Experimental Pathology, University of Cagliari, Via Porcell, 4-IV Piano, 09125-Cagliari, Italy; Dr. Yukihiro Shimizu, Kyoto Katsura Hospital, 17 Yamada-Hirao, Nishikyo, Kyoto 615-8256, Japan
S- Editor Li LF L- Editor Wang XL E- Editor Ma WH
References
- 1.Braun KM, Thompson AW, Sandgren EP. Hepatic microenvironment affects oval cell localization in albumin-urokinase-type plasminogen activator transgenic mice. Am J Pathol. 2003;162:195–202. doi: 10.1016/S0002-9440(10)63810-2. [DOI] [PMC free article] [PubMed] [Google Scholar]
- 2.Forbes S, Vig P, Poulsom R, Thomas H, Alison M. Hepatic stem cells. J Pathol. 2002;197:510–518. doi: 10.1002/path.1163. [DOI] [PubMed] [Google Scholar]
- 3.Stieger B, Peters R, Sidler MA, Meier PJ. Hepatocyte transplantation: potential of hepatocyte progenitor cells and bone marrow derived stem cells. Swiss Med Wkly. 2006;136:552–556. doi: 10.4414/smw.2006.11419. [DOI] [PubMed] [Google Scholar]
- 4.Menthena A, Deb N, Oertel M, Grozdanov PN, Sandhu J, Shah S, Guha C, Shafritz DA, Dabeva MD. Bone marrow progenitors are not the source of expanding oval cells in injured liver. Stem Cells. 2004;22:1049–1061. doi: 10.1634/stemcells.22-6-1049. [DOI] [PubMed] [Google Scholar]
- 5.Howard BJ, Pohorecki R, Becker GL, Landers DF. Energy status in anoxic rat hepatocytes: effects of isoflurane, solution composition, and hypothermia. Liver Transpl Surg. 1995;1:220–224. doi: 10.1002/lt.500010404. [DOI] [PubMed] [Google Scholar]
- 6.Berry MN, Halls HJ, Grivell MB. Techniques for pharmacological and toxicological studies with isolated hepatocyte suspensions. Life Sci. 1992;51:1–16. doi: 10.1016/0024-3205(92)90212-8. [DOI] [PubMed] [Google Scholar]
- 7.Seglen PO. Preparation of isolated rat liver cells. Methods Cell Biol. 1976;13:29–83. doi: 10.1016/s0091-679x(08)61797-5. [DOI] [PubMed] [Google Scholar]
- 8.Tirnitz-Parker JE, Tonkin JN, Knight B, Olynyk JK, Yeoh GC. Isolation, culture and immortalisation of hepatic oval cells from adult mice fed a choline-deficient, ethionine-supplemented diet. Int J Biochem Cell Biol. 2007;39:2226–2239. doi: 10.1016/j.biocel.2007.06.008. [DOI] [PubMed] [Google Scholar]
- 9.Fausto N, Campbell JS. The role of hepatocytes and oval cells in liver regeneration and repopulation. Mech Dev. 2003;120:117–130. doi: 10.1016/s0925-4773(02)00338-6. [DOI] [PubMed] [Google Scholar]
- 10.He ZP, Tan WQ, Tang YF, Zhang HJ, Feng MF. Activation, isolation, identification and in vitro proliferation of oval cells from adult rat livers. Cell Prolif. 2004;37:177–187. doi: 10.1111/j.1365-2184.2004.00293.x. [DOI] [PMC free article] [PubMed] [Google Scholar]
- 11.Cantz T, Manns MP, Ott M. Stem cells in liver regeneration and therapy. Cell Tissue Res. 2008;331:271–282. doi: 10.1007/s00441-007-0483-6. [DOI] [PMC free article] [PubMed] [Google Scholar]
- 12.Forbes SJ. Stem cell therapy for chronic liver disease--choosing the right tools for the job. Gut. 2008;57:153–155. doi: 10.1136/gut.2007.134247. [DOI] [PubMed] [Google Scholar]
- 13.Matsusaka S, Tsujimura T, Toyosaka A, Nakasho K, Sugihara A, Okamoto E, Uematsu K, Terada N. Role of c-kit receptor tyrosine kinase in development of oval cells in the rat 2-acetylaminofluorene/partial hepatectomy model. Hepatology. 1999;29:670–676. doi: 10.1002/hep.510290304. [DOI] [PubMed] [Google Scholar]
- 14.Yasui O, Miura N, Terada K, Kawarada Y, Koyama K, Sugiyama T. Isolation of oval cells from Long-Evans Cinnamon rats and their transformation into hepatocytes in vivo in the rat liver. Hepatology. 1997;25:329–334. doi: 10.1053/jhep.1997.v25.pm0009021943. [DOI] [PubMed] [Google Scholar]
- 15.Dumitriu IE, Mohr W, Kolowos W, Kern P, Kalden JR, Herrmann M. 5,6-carboxyfluorescein diacetate succinimidyl ester-labeled apoptotic and necrotic as well as detergent-treated cells can be traced in composite cell samples. Anal Biochem. 2001;299:247–252. doi: 10.1006/abio.2001.5415. [DOI] [PubMed] [Google Scholar]


