

Abstract
Summary
We have created a program that searches densely genotyped regions for associated non-contiguous haplotypes using a standard family based haplotype association test. This program was designed to expand upon the ‘sliding window’ methodologies commonly used for haplotype construction by allowing the association of subsets of single nucleotide polymorphisms (SNPs) to drive the construction of the haplotype. This strategy permits HaploBuild to construct more biologically relevant haplotypes that are not constrained by arbitrary length and contiguous orientation.
1 INTRODUCTION
Haplotypes play key roles in deciphering the genetic basis of complex diseases. They provide information on ancestral chromosome segments that may harbor alleles that influence disease phenotypes. Mutations can arise by single nucleotide changes, deletions/insertions or structural alterations that lead to new alleles that are initially associated to anonymous genetic variants in the immediate chromosomal vicinity of the mutation. Subsequent mutations and recombination events erode this association, creating haplotypes that are no longer continuous ‘blocks’ and exist as interrupted segments along the chromosome.
Currently the most widely used approach for selecting single nucleotide polymorphisms (SNPs) to build haplotypes in association testing for quantitative or qualitative disease outcomes is a fixed-sized sliding window (Lin et al., 2004). The fixed-sized sliding window is used to group consecutive SNPs into haplotypes. A disadvantage of this approach is that it may not capture the haplotype diversity within regions of strong linkage disequilibrium (LD) among SNPs and dense SNP genotyping. When adjacent SNPs are in strong LD, they provide redundant information making the sliding window no more informative than a single SNP.
Several statistical genetics programs have implemented methods for testing haplotypes for outcomes in either family based or an unrelated samples, but previous methods do not address the selection of SNPs. The commonly used family based association testing (FBAT) software efficiently constructs haplotypes using an EM algorithm and the distribution of offspring genotype configurations conditioned on the parent’s genotypes, and evaluates association using a Z-score statistic (Horvath et al., 2001, 2004). The methods implemented in haplo.stats construct user defined haplotypes in unrelated samples and evaluate outcomes with regression based (haplo.glm) or score based (haplo.score) tests (Schaid et al., 2002). For both programs, the user selects the SNPs to be used in the construction of a haplotype. Finally, Bayesian graphical model methodology has been developed where SNP selection is automated but the genotype data is restricted to unrelated individuals (Thomas, 2005; Thomas and Camp, 2004; Verzilli et al., 2006).
In this, we present an algorithm that exploits the FBAT methods implemented in haploFBAT (HBAT; Horvath et al., 2004) by initially testing all combinations of two-SNP haplotypes, then expanding to longer haplotypes within a defined region. Our algorithm constructs and tests haplotypes that are not necessarily contiguous, without requiring user SNP selection. Furthermore, the number of SNPs contained in the haplotype is not restricted, thereby permitting the evaluation of complex haplotype structures including those haplotypes tested in the fixed sliding window, same LD block, and different LD block methodology. Finally, the novelty of our algorithm is its ability to analyze family based genetic studies that can contain missing data for quantitative or dichotomous traits within or outside of an area of genetic linkage.
2 ALGORITHM
The HaploBuild algorithm defines a heuristic for choosing SNPs that are combined as a haplotype and tests these for association with a disease phenotype. Given a set of genotyped SNPs our algorithm works in three steps.
The first step tests, using HBAT (Horvath et al., 2004), the association between a disease phenotype and all two-SNP haplotypes, such as the type SNP1—SNP2, in which the SNPs in the haplotype are within a user defined physical distance d from each other (typically 50 kb). If the P-value for association of any of these two-SNP haplotypes is less than a specified significance level, the pair of SNPs is retained for further analysis in Step 2.
The second step constructs a graph creating a source node from each of the two-SNP haplotypes that attained a user defined level of significance in Step 1. The goal of graph construction is to iteratively add individual SNPs to the haplotype that improve the global haplotype association P-value. In this scenario, the parent nodes represent the base haplotype and each of its children corresponds to a successful addition of a SNP that increases the haplotype length from n to n+1 SNPs. Consequently, the sink nodes of a completed graph represents the maximum number of SNPs that can construct a haplotype for which no genotyped SNP within the distance d of the haplotype SNPs strengthens the P-value of the association test. The maximum possible physical distance of a haplotype built in this manner is given by:
| (1) |
Where d equals the user defined specified physical distance between a pair of evaluated SNPs (from Step 1) and n is equal to the total number of SNPs in the haplotype. Thus a d defined at 50 kb would generate a Dmax of 50 kb in a two SNP haplotype, but could expand to 100, 150 or 200 kb, respectively for three-, four- and five-SNP haplotypes.
HaploBuild allows the significance level used in Step 1 of the algorithm to be user defined. Additionally, HaploBuild can be restricted to test only those SNP pairs that are in LD by a user defined, D’ or r2, threshold using LD estimated from Haploview (Barrett et al., 2005). Finally, for each haplotype reported an associated q-value is calculated from a distribution of P-values from the total number of association tests ran using the R package q-value (Storey and Tibshirani, 2003).
3 RESULTS
To evaluate the performance of HaploBuild, we created two simulated phenotypes based on real genotype data from the Family Heart Study’s Body Mass Index (BMI) fine-mapping study. The dataset consisted of 100 genotyped SNPs in 1137 individuals in 225 nuclear families across a 650 kb region. The software program SOLAR (Almasy and Blangero, 1998) was used to generate a standardized random normal phenotype (μ = 0, SD = 1) that contained residual polygenic variance (residual correlation) between relatives. This random normal phenotype of individual j in family i was then adjusted to incorporate the genotyping from the causative SNP by:
| (2) |
where μ is phenotypic mean, X is an additive SNP coding (i.e. -1=rare homozygous, 0=heterozygous, 1=common homozygous), G is the random phenotype calculated in SOLAR and α is calculated as:
where QTLperc is the percent of phenotypic variation explained by the QTL and σ2 is the variance of the phenotype.
HaploBuild was run on 1000 simulated replicates using a QTLperc of 0.01 or a QTLperc of 0.1, σ2 of 1, μ of 0, test distance (d) of 50 kb and a significance level of 0.05. Figure 1 displays the frequency, by position, of the top five associated haplotypes (total=5000 haplotypes) for each simulation replication within bins of 20 kb. For a moderate effect size (QTLperc=0.1), the graphs that are built by HaploBuild converged to the=region of the causal SNP that is denoted by a black vertical line (Fig. 1b). Even for a weak effect size (QTLperc=0.01), the locus for the true signal is evident (Fig. 1a). In addition, HaploBuild was able to identify the LD block, denoted by a black horizontal line, containing the causal SNP. In fact, the decrease in haplotype density within the LD block reflects the lower pairwise LD (r2) those SNPs have with the causal SNP.
Fig. 1.
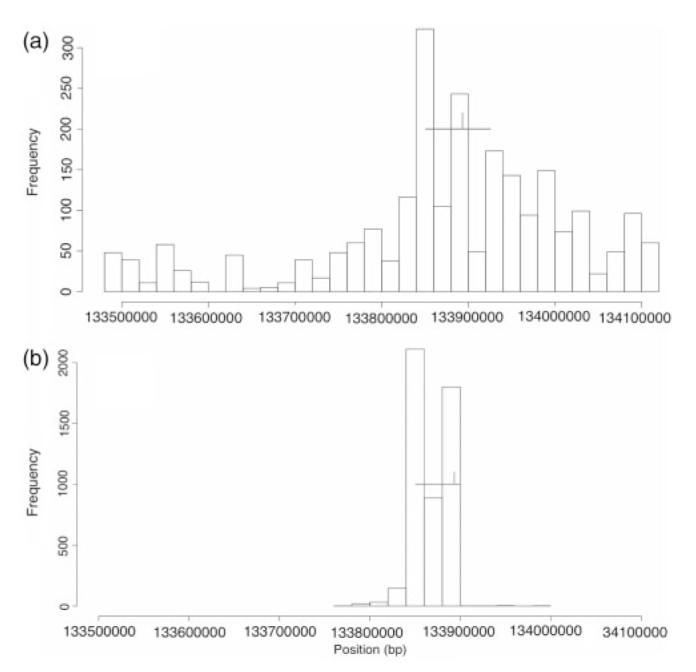
Histogram of the position of the top five (n=5000) significant haplotypes found using HaploBuild for a QTLperc of 0.01 (a) and 0.1 (b) for all simulation replications. The x-axis represents the physical location (bp) of the SNPs, and the y-axis indicated the frequency of the haplotypes found in each 20 kb bin. The vertical line corresponds to the position of the simulated causative SNP, which was removed from the dataset prior to analysis. The horizontal line represents the length of the LD block that contains the causative SNP.
4 CONCLUSION
To provide an alternative to the simple ‘sliding window’ methodology that most haplotype association studies employ, we have developed an algorithm that can, relatively quickly, construct associated non-contiguous haplotypes of variable length. Due to the stochastic nature of point mutations, the resulting haplotypes built by HaploBuild are more biologically appropriate than those constructed using linear constraints. Furthermore, HaploBuild constructed haplotypes are not restricted to ‘user-defined’ length, but instead permit the haplotype length to be determined by the strength of association to a phenotype. As evidenced from the simulations, to achieve a very clear signal of association the marginal effects of a mutation will have to be powerful. Though, even with a weak effect true signal was still evident. Finally, caution should be taken when interpreting the q-values produced from HaploBuild as they are not determined under the assumption of independence.
HaploBuild can be run using all of the available HBAT options, such as empirical variance estimation, phenotype offset, including testing all genetic models (i.e. additive, dominative or recessive). In addition to haplotype analysis, HaploBuild can test marker—marker interaction using the FBAT-LC and FBAT-MM tests where no distance constraint is required. Overall, HaploBuild represents an easy-to-use interface to automate haplotype construction and association in family based studies where dense fine mapping has been completed.
5 IMPLEMENTATION
HaploBuild was written in PERL to interface with FBAT and will run on Microsoft(r) Windows XP, Mac OS X and GNU/Linux systems.
ACKNOWLEDGEMENTS
Supported by National Heart, Lung and Blood Institute grants NHLBI RO-1 HL68891-05. The authors would like to thank Drs Kathryn Lunetta and Joseé Dupuis for their help in running the simulations.
Footnotes
Conflict of Interest: none declared.
Availability: http://snp.bumc.bu.edu
REFERENCES
- Almasy L, Blangero J. Multipoint quantitative-trait linkage analysis in general pedigrees. Am. J. Hum. Genet. 1998;62:1198–1211. doi: 10.1086/301844. [DOI] [PMC free article] [PubMed] [Google Scholar]
- Barrett JC, et al. Haploview: analysis and visualization of LD and haplotype maps. Bioinformatics. 2005;21:263–265. doi: 10.1093/bioinformatics/bth457. [DOI] [PubMed] [Google Scholar]
- Horvath S, et al. The family based association test method: strategies for studying general genotype — phenotype associations. Eur. J. Hum. Genet. 2001;9:301–306. doi: 10.1038/sj.ejhg.5200625. [DOI] [PubMed] [Google Scholar]
- Horvath S, et al. Family-based tests for associating haplotypes with general phenotype data: application to asthma genetics. Genet. Epidemiol. 2004;26:61–69. doi: 10.1002/gepi.10295. [DOI] [PubMed] [Google Scholar]
- Lin S, et al. Exhaustive allelic transmission disequilibrium tests as a new approach to genome-wide association studies. Nat. Genet. 2004;36:1181–1188. doi: 10.1038/ng1457. [DOI] [PubMed] [Google Scholar]
- Schaid DJ, et al. Score tests for association between traits and haplotypes when linkage phase is ambiguous. Am. J. Hum. Genet. 2002;70:425–434. doi: 10.1086/338688. [DOI] [PMC free article] [PubMed] [Google Scholar]
- Storey JD, Tibshirani R. Statistical significance for genomewide studies. Proc. Natl Acad. Sci. USA. 2003;100:9440–9445. doi: 10.1073/pnas.1530509100. [DOI] [PMC free article] [PubMed] [Google Scholar]
- Thomas A. Characterizing allelic associations from unphased diploid data by graphical modeling. Genet.Epidemiol. 2005;29:23–35. doi: 10.1002/gepi.20076. [DOI] [PubMed] [Google Scholar]
- Thomas A, Camp NJ. Graphical modeling of the joint distribution of alleles at associated loci. Am. J. Hum. Genet. 2004;74:1088–1101. doi: 10.1086/421249. [DOI] [PMC free article] [PubMed] [Google Scholar]
- Verzilli CJ, et al. Bayesian graphical models for genomewide association studies. Am. J. Hum. Genet. 2006;79:100–112. doi: 10.1086/505313. [DOI] [PMC free article] [PubMed] [Google Scholar]