Abstract
Here we review studies that provided important information about conformational properties of DNA using circular dichroic (CD) spectroscopy. The conformational properties include the B-family of structures, A-form, Z-form, guanine quadruplexes, cytosine quadruplexes, triplexes and other less characterized structures. CD spectroscopy is extremely sensitive and relatively inexpensive. This fast and simple method can be used at low- as well as high-DNA concentrations and with short- as well as long-DNA molecules. The samples can easily be titrated with various agents to cause conformational isomerizations of DNA. The course of detected CD spectral changes makes possible to distinguish between gradual changes within a single DNA conformation and cooperative isomerizations between discrete structural states. It enables measuring kinetics of the appearance of particular conformers and determination of their thermodynamic parameters. In careful hands, CD spectroscopy is a valuable tool for mapping conformational properties of particular DNA molecules. Due to its numerous advantages, CD spectroscopy significantly participated in all basic conformational findings on DNA.
INTRODUCTION
All known autonomous forms of life, starting from bacteria and ending with human, store their genetic information in molecules of double-stranded DNA. DNA is a giant molecule whose length is hundreds millions base pairs in man. The huge molecules of DNA are densely packed in the relatively tiny space of the cell nucleus in eukaryotes. The basic arrangement of DNA, discovered in 1953, is a right-handed double helix of the B-type. It was later found that DNA can adopt many other structures, including the right-handed A-type double helix typical of RNA, the left-handed Z-DNA, various kinds of hairpins and slipped structures, parallel-stranded double helices, various kinds of triplexes, guanine quadruplexes, intercalated cytosine tetraplexes and other less well characterized structures (1,2). It is likely that all of the structures occur within the cell where they are stabilized by supercoiling, various proteins and low water activity. The anomalous structures play a role in DNA functions and pathology (3).
CIRCULAR DICHROISM SPECTROSCOPY
Circular dichroism (CD) is a phenomenon originating from interactions of chiral molecules with circularly polarized electromagnetic rays [for more details, see (4,5)]. Spectral studies of DNA have employed far UV (6) as well as infrared (7) light, but most analyses use ultraviolet light within 180–300 nm range (8), where bases of DNA absorb light. Absorption of right- and left-handed circularly polarized light by chiral molecules differs and the difference is called CD. The quantity used to describe this phenomenon is called ellipticity, Θ, and is expressed in degrees. A more convenient characterization of CD is the difference in the molar extinction coefficients, Δε = εL − εR [M−1cm−1].
The theoretical (i.e. quantum chemical) description of CD spectra of molecules as large as DNA is very complex, so the method is not able to provide structural information on the molecules at atomic level. For this reason, CD spectroscopy is primarily used empirically in studies of DNA. CD spectroscopy, however, has many advantages over other methods of conformational analysis. First, it is extremely sensitive, permitting work with DNA amounts as low as 25 μg. The concentration of DNA can also be very low (20 μg/ml). This is advantageous in studies of samples of low solubility (e.g. long G-rich DNA fragments) or of those that tend to aggregate under extreme solvent conditions (e.g. high salt or organic solutions, which are used to mimic interactions with proteins or other molecules in cells). Changes in the path length can be used to effectively alter DNA concentration by more than three orders of magnitude. Second, the studied molecules can be not only short (oligonucleotides) but also long, which is especially important with DNA. Third, the samples can easily be titrated with various agents (like salts, alcohols or acids) that induce conformational isomerizations in DNA. This makes it possible to map the whole conformational space of the studied molecule, not just a single structure. Fourth, CD spectroscopy distinguishes two-state conformational isomerizations between distinct conformers from gradual changes within arrangements characterized by a single energetic minimum (9). Fifth, as CD can analyse not only solutions but also films, it can be used to make correlations between infrared spectroscopy and X-ray diffraction (10). Sixth, CD measurements are fast and relatively inexpensive, which allows comparative studies of related molecules of DNA under many conditions. This represents a further source of useful information. This everything are advantages of CD spectroscopy as compared with so-called absolute methods (X-ray diffraction of crystals and NMR spectroscopy), which need crystallization (which itself is a problem), large amount of material, or long accumulation, limited experimental conditions, a single discrete structure (as opposed to a mixture of isomerizing conformers) and short molecules. These advantages are the reasons why CD data participated in practically all of the key discoveries regarding secondary structures of DNA. Further information about CD spectroscopy of nucleic acids can be found in previous review articles (11,12).
THE B-FORM, DNA DENATURATION AND THE HAIRPIN
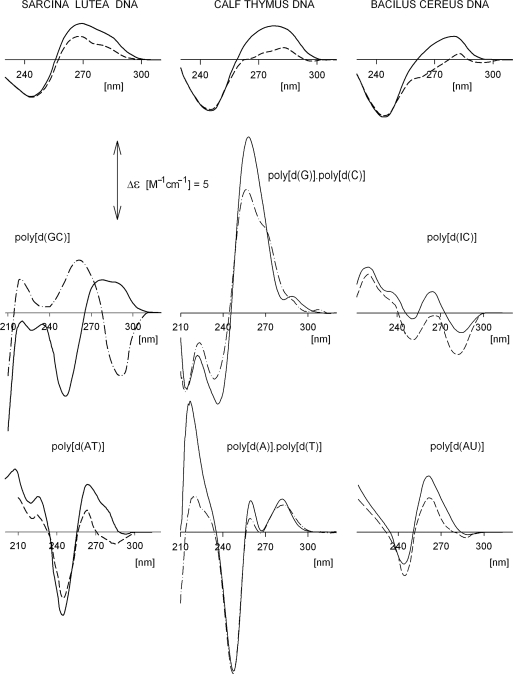
The B-form is the most frequently observed conformation of DNA. The long wavelength CD spectrum of the sequentially heterogeneous DNA is conservative (Figure 1). The base pairs in the B-form are perpendicular to the double-helix axis, which confers only a weak chirality on the molecule so that the peak intensities are relatively small (Figure 1). As (A + T) content increases, the negative band becomes deeper and conformational variability increases (compare spectra in Figure 1, the upper row). With increasing salt concentration, the long wavelength part of the CD spectrum gradually (non-cooperatively) decreases to give a continuum of CD spectra corresponding to variants of B-DNA structures differing in the number of base pairs per helix turn (13).
Figure 1.
Sequence-dependent CD spectra. Upper row: native DNAs from Sarcina lutea (71% G + C), calf thymus (42% G + C) and Bacillus cereus (33% G + C). Middle and bottom rows: synthetic polynucleotides. The spectra were measured in 10 mM sodium acetate, pH 7 (solid lines), 5 M NaCl (dashed lines) and 3.5 M NaCl (dash-dotted line). The spectrum of poly[d(GC)] in 3.5 M NaCl corresponds to Z-form. Salt was increased by directly adding a high concentration stock solution to cells containing DNA; the salt and DNA concentrations were corrected for the volume increase. Spectra of the natural DNAs were measured on a Roussel–Jouan dichrograph, Model CD 185. Spectra of the polynucleotides in this and in the following figures were measured on Jobin–Yvon dichrographs, Mark IV or Mark VI and, unless stated otherwise, in 1 cm cells (absorption ∼0.7) and at room temperature. CD in all figures is expressed as Δε (M−1cm−1) with molarity based on nucleoside residues in the DNA samples. The pH values were determined using a Sentron Red-Line electrode and a Sentron Titan pH meter.
The CD spectra of B-forms of synthetic polydeoxynucleotides depend on the primary sequence (Figure 1). These structures constitute a family of B-DNA forms with common global features. All of them (with the exception of poly[d(IC)] (14,15), which contains a non-canonical base) are characterized by a positive long wavelength band or bands at about 260–280 nm and a negative band around 245 nm. However, the position and amplitudes of the CD bands differ markedly with sequence not only because chromophores differ, but also because of different conformational properties. Poly[d(A)]·poly[d(T)] and poly[d(G)]·poly[d(C)] adopt unusual B-forms. The first adopts so called B′ heteronomous DNA-form (16,17) with a distinct geometry of dA and dT residues, the second has some distinctly A-like features (18).
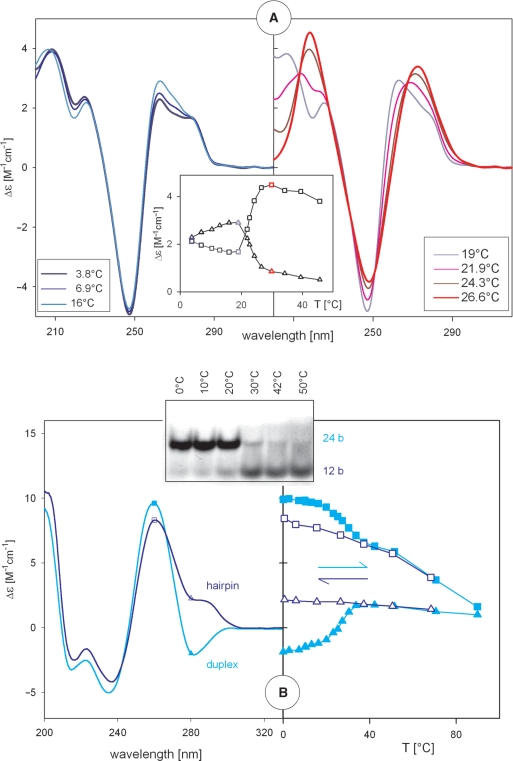
CD spectroscopy can be used to monitor denaturation of DNA. Figure 2A shows CD spectra of the self-complementary duplex poly[d(AT)] measured at various temperatures. The left panel reflects non-cooperative changes in poly[d(AT)] that precede thermal melting (19); spectra in the right panel correspond to thermal melting. Melting is a cooperative (Figure 2A, insert), two-state process, which is reflected by the presence of isodichroic points of the spectra (Figure 2A, right panel). The course of melting curves enables determination of thermodynamic parameters (ΔH, ΔG or ΔS) (20–22) of the studied structure.
Figure 2.
Temperature induced changes in CD spectra reflecting pre-melting and melting of DNA. (A) Spectra of poly[d(AT)] in 10 mM Na acetate, pH 7 at temperatures indicated. The left panel reflects changes within double-helical structure and the right panel shows a helix–coil transition. Insert: the changes in poly[d(AT)] monitored at 262 nm (triangles) and 220 nm (squares). (B) Irreversible duplex–hairpin transition of d(C6G6) in 1 mM Na phosphate, 0.3 mM EDTA, pH 7. Left: CD spectra measured at 0°C corresponding to duplex (cyan) before denaturation and hairpin (dark blue) after denaturation. Right: spectral changes induced by increasing (cyan) and decreasing (dark blue) temperatures monitored at 260 (squares) and 280 (triangles) nm. CD spectra were measured in 0.1 cm cells. Insert: polyacrylamide gel (20%) electrophoresis of the samples running in the same buffer at 2°C. The samples were exposed to the indicated temperatures prior to loading on the gel.
A hairpin is an intra-molecular variant of the B-form (3,23,24). Besides the double-helical stem it contains a single-stranded loop. Self-complementary oligonucleotides and also DNA fragments consisting of GC-rich trinucleotide repeats can adopt both a B-form duplex and a hairpin and transform between them depending on conditions. Hairpins and their sliding are considered to be a reason of the repeat expansions associated with various, mainly neurodegenerative, diseases (3,24). Because of the single-stranded loop, the duplex to hairpin transition is usually accompanied by CD amplitude reduction. Sensitivity of CD spectroscopy to the duplex–hairpin transition is dependent on the oligonucleotide primary structure. Here we show temperature-induced duplex–hairpin transition of C6G6 (Figure 2B). Electrophoretic migration (Figure 2B, insert) coincides with the CD changes.
A-FORM AND THE B–A TRANSITION
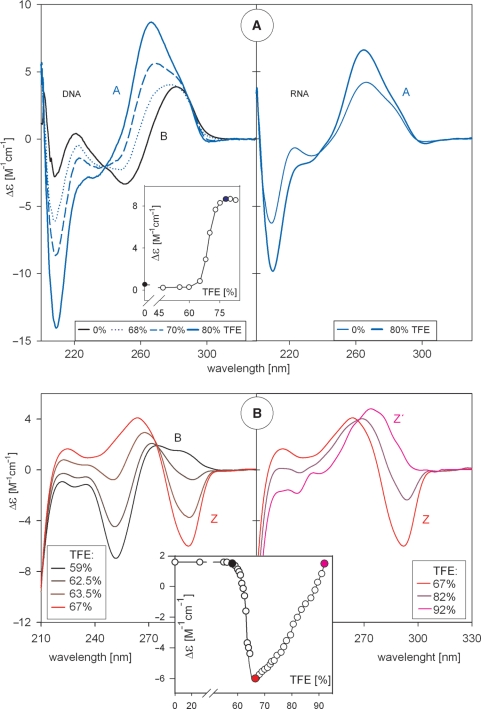
A-form is a constitutive conformation of RNA. DNA adopts the A-form in aqueous ethanol and other solutions (25). Some molecules of DNA (e.g. poly[d(A)]·poly[d(T)], Figure 1) do not adopt the A-form conformation at all. Others [e.g. (G + C) rich DNA fragments] (18,26) exhibit A-form features even in aqueous solution. The CD spectrum of poly[d(G)]·poly[d(C)] (Figure 1) is very similar to that of the true A-form DNA (Figure 3A). The CD spectrum of A-form DNA of heterogeneous primary structure is practically the same as that of the A-form of the corresponding RNA or RNA/DNA hybrid with the same primary structure. The spectrum is characterized by not only a dominant positive band at 260 nm but also a negative band at 210 nm (Figure 3A). The amplitude of the positive band is usually within 7–12 M−1cm−1 depending on the base sequence.
Figure 3.
B–A and B–Z transitions of DNA. (A) Left panel: CD spectra reflecting trifluorethanol-induced B–A transition of d(GCGGCGACTGGTGAGTACGC) duplex. Insert: the transition monitored at 266 nm. Right panel: CD spectra of RNA of the same sequence (U instead of T) duplexed with complementary DNA strand. (B) CD spectra reflecting trifluorethanol-induced B–Z (left panel) and Z–Z′ (right panel) transitions of poly[d(GC)] duplex. Insert: the transitions monitored at 291 nm. In this figure, TFE was added to the oligonucleotides dissolved in 1 mM Na phosphate, 0.3 mM EDTA, pH 7 and CD spectra were measured at 0°C.
The B–A transition is a fast, two-state, and highly cooperative process. This brings isodichroic points into the CD spectra and an S-shaped dependence of CD on the concentration of the inducing agent (Figure 3A, insert), which may be ethanol (25,27), trifluorethanol (TFE) (28–30) or even methanol in the case of (G + C) rich DNA (31). Since RNA constitutively adopts the A-form, the B–A transition of DNA may precede transcription and may be instrumental for its initiation.
THE Z-FORM AND THE B–Z TRANSITION
Many studies have been devoted to the left-handed Z-form of DNA and, in the same way as the classical B- and A-forms, the Z-form has entered into textbooks (32). The base pairs in the Z-DNA double helix have an opposite orientation with respect to the backbone than the B- and the A-forms. Its CD spectrum is nearly an inversion of the CD spectrum of the B-form; it contains (Figure 3B) a negative band at about 290 nm, a positive band around 260 nm and another characteristic, extremely deep negative band at short wavelength (∼205 nm) (33,34). Transitions between B-, A- and Z-forms followed by CD spectroscopy were nicely shown by Ivanov (34). As with the B-form, there are several variants of the Z-form. Their CD spectra are fairly different but transitions between them are non-cooperative (34–36) (Figure 3B, right and insert). In contrast to the B–A transition, the B–Z transition is slow. This is connected with the base pair flip that is required during the transition, which is a kinetically difficult process.
TRIPLEXES
Triplexes of DNA do not have a characteristic CD spectrum like the A-form, Z-form or tetraplexes. Triplexes formed by various sequences provide different CD spectra (37–39). Nevertheless, in combination with gel electrophoresis, it is very easy to identify CD spectrum characteristic of a studied triplex of a particular sequence; this spectrum is clearly distinct from those of its particular strands. CD spectroscopy is thus a suitable method for the study of triplex formation and for identification of triplex-forming oligonucleotides. These oligonucleotides can bind duplex DNA in a sequence-specific fashion and are thus attractive tools for manipulating gene sequence and expression (40,41).
GUANINE QUADRUPLEXES
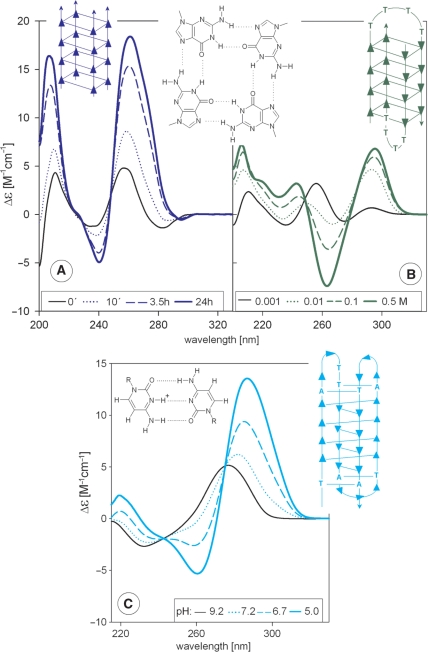
Guanine quadruplexes are of many types but all of them are based on guanine tetrads (Figure 4, upper panels). There are two basic types of the guanine quadruplexes. The spectra of parallel quadruplexes have a dominant positive band at 260 nm, whereas the spectra of anti-parallel quadruplexes have a negative band at 260 nm and positive band at 290 nm (Figure 4A and B, respectively) (12,42–45). Both quadruplex types display an additional characteristic positive peak at 210 nm. The different CD of the parallel and anti-parallel quadruplexes originates from different stacking interactions (12) of the guanosine residues distinctly oriented around their glycosidic bonds. Intermolecular guanine quadruplexes form slowly and also transitions between different quadruplex types are slow. Quadruplex formation is induced by physiologically relevant cations namely potassium, although ethanol is a still more effective inducer (46,47). The long-wavelength CD spectrum of a parallel quadruplex is similar to the CD spectrum of the A-form. This may suggest a similar base stacking in these two conformations (48,49). The quadruplex, however, has a positive band at 210 nm, whereas the A-form displays a deep negative one (compare Figures 4A and 3A).
Figure 4.
CD spectra of quadruplexes. Upper panels: CD spectra of guanine quadruplexes. (A) Time-dependent formation of a parallel-stranded quadruplex of d(G4) stabilized by 16 mM K+. (B) Na+-induced formation of an anti-parallel bimolecular quadruplex of d(G4T4G4). Both oligonucleotides were dissolved in 1 mM Na phosphate, 0.3 mM EDTA, pH 7 and thermally denatured (5 min at 90°C) and slowly cooled before starting measurements. The triangles in the sketches indicate guanines and point in the 5′–3′ direction. The G-tetrad is shown in the middle. Bottom panel: CD spectra reflecting the acid-induced transition of a DNA fragment d(TCCCCACCTTCCCCACCCTCCCCACCCTCCCCA) of a c-myc human oncogene into an intercalated cytosine quadruplex. The oligonucleotide was dissolved in Robinson–Britton buffer, pH 9.2 [24 mM (H3PO4 + H3BO3 + CH3COOH) + 82 mM NaOH]. The pH value was changed directly in the CD cell by addition of dilute HCl. The triangles in the sketch indicate cytosines and point in the 5′–3′ direction. The C+·C pair is shown in the insert.
CYTOSINE QUADRUPLEXES
DNA strands rich in cytosine also generate quadruplexes (50,51). These consist of two parallel homoduplexes connected through hemiprotonated C·C+ pairs. The two duplexes are mutually intercalated in an anti-parallel orientation (Figure 4C). Therefore, these structures are called intercalated or i-tetraplexes. The cytosine quadruplexes provide a characteristic CD spectrum with a dominant positive band at 290 nm (52,53) (Figure 4C). Formation of cytosine quadruplexes is promoted by slightly acid pH, which is needed for C·C+ pair hemiprotonation. Interestingly, the sequences that are prone to fold into cytosine quadruplexes bind the proton to form this structure even at pH values higher than 7 (53). Similar to guanine quadruplexes, intermolecular cytosine quadruplexes are formed with slow kinetics.
DNA FRAGMENTS RICH IN GUANINE AND ADENINE
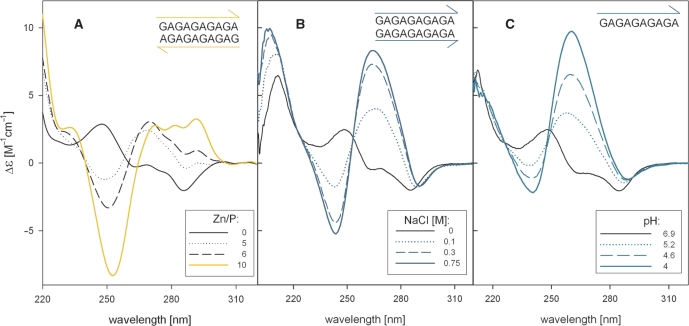
DNA fragments rich in guanine and adenine exhibit cooperatively melting conformers that differ from classical structures. Their molecular structures have not yet been solved in spite of several attempts. The first conformer is an anti-parallel homoduplex (54) containing G·A pairs. Its CD spectrum is B-like (55) (Figure 5A). This duplex is stabilized by divalent zinc cations. Low concentrations of the zinc cations induce various conformers so that the process is not of a two-state nature. This anti-parallel homoduplex is probably a part of a zinc-stabilized d(GA)n·d(GA)n·d(TC)n triplex (55).
Figure 5.
CD spectra of d(GA)20. (A) Spectra reflecting formation of the zinc-specific anti-parallel homoduplex. The spectra were measured in Tris–HCl buffer, pH 8.3. The yellow line corresponds to 0.7 mM ZnCl2. (B) CD spectra reflecting the NaCl-induced transition of d(GA)10 into the parallel homoduplex. To increase the salt concentration, 5 M NaCl was added to the oligonucleotide dissolved in 10 mM sodium phosphate, pH 7. (C) CD spectra of an ordered single-stranded conformer containing protonated adenine. The pH value was changed directly in the CD cell by addition of dilute HCl to the oligonucleotide in 1 mM sodium phosphate.
The second conformer of the alternating GA sequence is a parallel homoduplex (56) with G·G and A·A pairs; this conformer exhibits a CD spectrum similar to that of parallel guanine quadruplexes (Figure 5B, compare with Figure 4A) but with smaller positive amplitudes. The spectral similarity indicates the presence of guanine–guanine stacking so that the adenines probably extrude from the double helix (57,58).
The third conformer is an ordered single strand containing protonated adenine (59). Its CD spectrum (Figure 5C) is nearly identical to that of the parallel homoduplex. This single strand becomes a homoduplex at higher ionic strength (60,61). The process is non-cooperative and is reflected by a gradual deepening of the negative band (62). This indicates that the guanine–guanine stacking does not change significantly and that the duplex formation is mediated by interstrand adenine–adenine interactions. It is interesting that ethanol (62) and even dimethylsulphoxide (57), both DNA denaturing agents, stabilize the single-stranded ordered d(GA)n structure as does acid pH.
ALTERNATING SEQUENCE OF ADENINE AND THYMINE
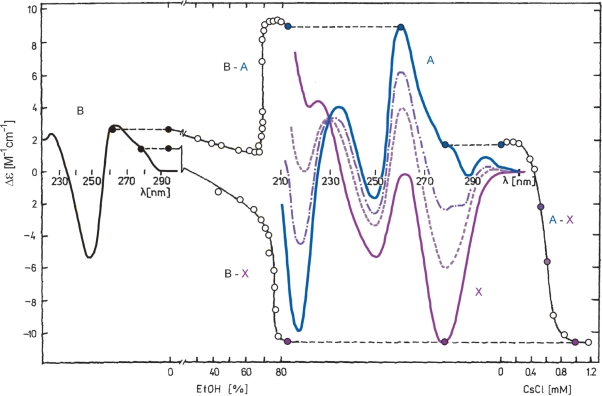
Poly[d(AT)] and e.g. d(TA)4 provide a remarkable CD spectrum at high concentrations of CsF (63) or in aqueous ethanol (64,65). In the presence of millimolar NaCl concentrations, poly[d(AT)] isomerizes into the A-form at high ethanol concentrations (27) (Figure 6). Replacement of NaCl by the same amount of CsCl results in the appearance of a spectrum with a large negative band at 280 nm and a positive one at 210 nm (Figure 6). All the spectral changes proceed with a fast kinetics. The structure in the presence of CsCl in ethanol or in CsF in aqueous solution was called X-DNA. It provides two well-separated signals in the 31P NMR spectrum like the Z-form (63). But X-DNA is not Z-DNA as the 31P signal assignments for the purine–pyrimidine and pyrimidine–purine are opposite for the two structures (63). Cooperativity of the B–X and A–X transitions (Figure 6) also excludes the possibility that X-DNA is a member of the B- or A-DNA conformational families. A structure has recently been crystallized (66) that may correspond to the anomalous X-DNA CD spectrum. It contains Hoogsteen base pairs.
Figure 6.
B–A, B–X and A–X transitions of poly[d(AT)]. From the left to the right: CD spectrum of the B-form measured in 1 mM sodium phosphate, 0.25 mM EDTA, pH 7 (black); ethanol-induced B–A transition measured at 10°C and monitored by Δε at 262 nm (96% ethanol was added to the poly[d(AT)] sample). CD spectrum of the A-form in the presence of 0.2 mM sodium phosphate and 0.05 mM EDTA and 80% ethanol (blue); ethanol induced B–X transition measured in the presence of 1.3 mM CsCl at 4°C and monitored by Δε at 278 nm (1.3 mM CsCl was also present in ethanol). CD spectrum of the X-form in 0.15 mM sodium phosphate, 0.04 mM EDTA, 1.3 mM CsCl and 82% ethanol (violet). CD spectra reflecting the A–X transition induced by addition of CsCl (0, 0.53, 0.59 and 1.3 mM) to the A-form at 4°C and the course of the transition monitored by Δε at 278 nm. This figure was adapted from Vorlickova M. et al. (J. Biomol. Struct. Dyn. 1991, 9, 571–578) with permission.
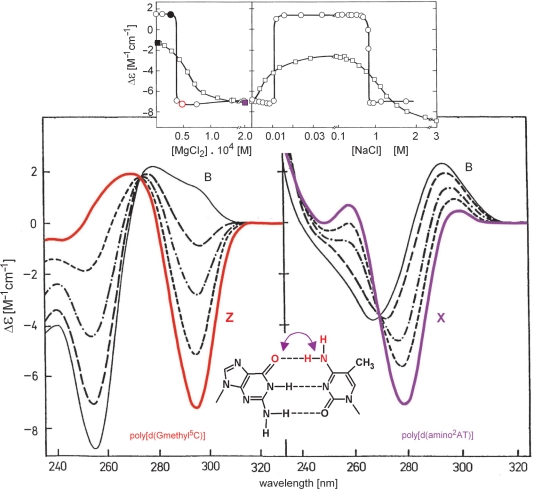
Poly[d(AT)] can also adopt the left-handed Z-form (67,68). Interestingly, despite different chromophores, its CD spectrum is very similar to the CD spectrum of the Z-form of poly[d(GC)] (69). Methylation of cytosine at position 5 in poly[d(GC)] shifts the B–Z transition to low salt concentrations (70). As shown in Figure 7, poly[d(amino2AT)] also undergoes a salt-induced conformational transition at low salt concentrations (71). The resulting conformer has X-form characteristics and exhibits some features of A-form (72,73). Poly[d(Gmethyl5C)] and poly[d(amino2AT)] differ in the placement of the amino and keto groups in the major groove (Figure 7, bottom insert). This difference causes the two polydeoxynucleotides to undergo distinct conformational transitions under identical conditions (Figure 7, upper insert): the first polynucleotide transforms highly cooperatively to Z-form and the second, in a less cooperative manner, to X-form.
Figure 7.
MgCl2-induced B–Z and B–X transitions of poly[d(Gmethyl5C)] and poly[d(amino2AT)], respectively. Both polynucleotides were dissolved in 0.6 mM potassium phosphate buffer and 0.03 mM EDTA, pH 6.8. Left panel: the B–Z transition of poly[d(Gmethyl5C)] in 0.03 mM MgCl2 (thin line); spectra measured 1, 4, 17 and 88 min after increasing MgCl2 concentration to 0.05 mM (from dashed to full red line). Right panel: the B–X transition of poly[d(amino2AT)] in 0, 0.028, 0.056, 0.070 and 0.190 mM MgCl2 (from thin to the full violet line). Insert: the transitions of poly[d(Gmethyl5C)] (circles, Δε295) and poly[d(amino2AT)] (squares, Δε280). The left panel shows the MgCl2-induced B–Z and B–X transitions; on the right is the NaCl-induced reversion of the transitions and re-entry of the Z- and X-forms at high NaCl concentrations. It was necessary to wait hours to attain an equilibrium in the case of poly[d(Gmethyl5C)], whereas the equilibrium spectra of poly[d(amino2AT)] could be measured immediately after changing the solvent conditions. The sketch in the middle bottom indicates the difference in chemical structures of the two base pairs.
DNA CONDENSATION
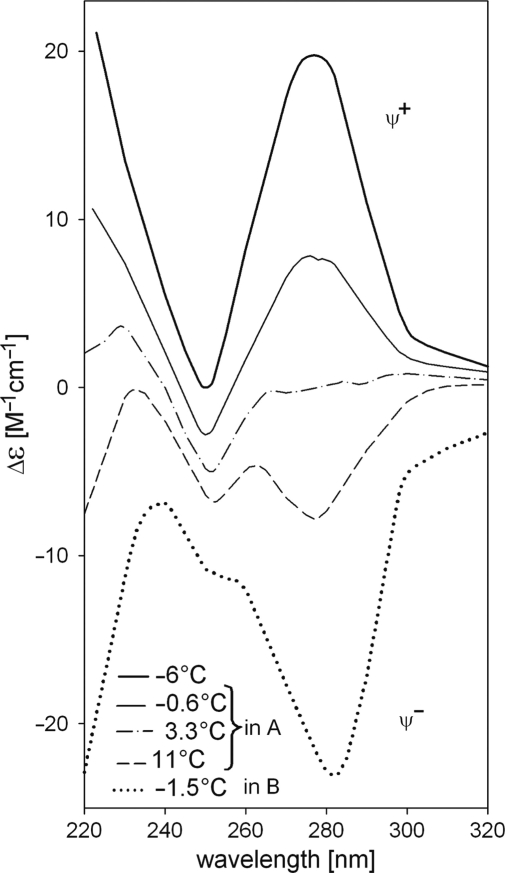
DNA containing natural bases does not absorb light above 300 nm. Detection of a signal above 300 nm indicates that the DNA is condensed into particles that scatter light. This region of the spectrum must be monitored, as when this type of signal is observed, the CD changes can no longer be interpreted in terms of changes in DNA secondary structure. However, species of regularly packed, condensed DNA can be studied by CD (74,75). Infrared CD spectroscopy in combination with atomic force microscopy has proven very powerful for these analyses (76). The associates are called psi-forms or DNA wires (77,78). The psi-forms are chromosome analogues with a regular tertiary folding. These forms are characterized by either positive or negative CD signals with extremely large amplitudes (Figure 8) that are caused by chiral condensates possessing large-scale helicity. The condensation can be caused by a number of factors like high ionic strength polyethylene glycol (PEG) or other alcohols or basic proteins. These factors induce formation of short non-B (depending on nucleotide sequence) DNA segments that propagate as a perturbation along the DNA double helix and result in cooperative condensation. Condensation and decondensation processes may take place in vivo due to DNA-binding proteins such as histones and protamines, which control and modulate ionic strength and hydrophobic environment in the close vicinity of DNA molecules.
Figure 8.
CD spectra reflecting the temperature-controlled psi-type condensation of poly[d(AT)] in ethanol-NaClO4 solutions. Solution A was 34% ethanol, 0.6 M NaClO4; solution B was 30% ethanol, 2.0 M NaClO4.
Guanine-rich DNA molecules are known to self-associate and form ordered multi-stranded arrangements, which are useful in supramolecular chemistry and nanotechnology (79). Combinations of DNA sequences that can isomerize between distinct arrangements represent one of the most promising nanomaterials (78). CD spectroscopy distinguishes ordered condensation from chaotic aggregation. The aggregates also scatter light but the signals in the region of DNA base chromophores absorption are low.
RELATIONSHIPS BETWEEN SOLUTION AND CRYSTAL CONFORMATIONS OF DNA
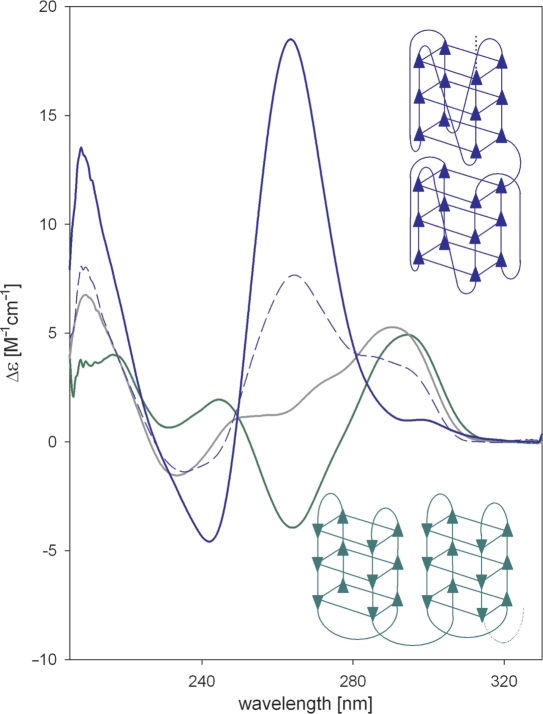
Conformations of DNA in aqueous solutions and crystals differ. CD spectroscopy contributed to the elucidation of the relationship between DNA conformations in these two environments. It was shown that the DNA structures observed in crystals are adopted in aqueous ethanol or trifluorethanol solutions (Figure 9) (30). This observation has been made for DNA duplexes and also guanine quadruplexes (44,46,80).
Figure 9.
CD spectra and sketches of distinct quadruplex arrangements of a human telomere fragment G3(TTAG3)7. In green is the spectrum in 150 mM NaCl and the oligonucleotide adopts the antiparallel basket type quadruplex (92); in grey is the spectrum in 150 mM KCl; in blue dashes is the spectrum in 10 mM KCl, 57% ethanol measured 24 h after ethanol addition; and in blue is the spectrum of the same sample measured after denaturation and slow cooling to room temperature. The final spectrum corresponds to parallel quadruplex observed in the crystal (93).
DISCUSSION
The purpose of this short review was to summarize the characteristics of CD spectra of important conformations of DNA and to demonstrate that CD spectroscopy is an extremely useful method to study the wide range of DNA conformational properties. CD is complementary to NMR and X-ray crystallographic studies as it can reveal aspects inaccessible to these absolute methods: unlike the latter methods, CD can be used to study long DNA molecules, which DNA, in reality, is. It can be used to efficiently and rapidly evaluate the effect of changing environment on DNA behaviour and to follow conformational transitions. DNA isomerizations between various conformers and the conditions controlling these isomerizations are important as they probably serve as the basis for regulation of gene expressions (3).
CD spectroscopy is a powerful method for studying DNA-conformational properties but the structural conclusions must be extracted with caution. For an accurate interpretation of spectral changes, it is important to trace the whole spectral region. Following only a single band (e.g. the band at 260 nm) and ignoring the remaining regions of the spectrum can lead to incorrect conclusions. One must study CD changes induced by solution conditions (temperature, pH, salts) that give rise to particular DNA arrangement rather than make structural interpretations based on a single spectrum taken under one condition. Following the course of appearance and denaturation of a structure aids in its characterization. These thorough CD spectroscopy procedures have been critical in discover of important properties of DNA. Historically, CD has been a pioneering method in the study of novel DNA structures. For example, CD spectroscopy was used to show that various arrangements found in DNA fibres (B, C, D, T) all belong into the wide B-family of structures (13). Left-handed Z-DNA was detected by CD spectroscopy (33) almost a decade before it was identified by X-ray crystallography (81). CD spectroscopy was used to find the unusual X-form (63) whose molecular structure is still a matter of debate. The method is useful for mapping and analysis of anomalous arrangements in selected regions of genomic DNA known to be important from a biological or medical point of view. CD, and other techniques for structural analysis reveal secondary and tertiary DNA structures in the linear primary genomic sequence; these structures are proving to be critical to the normal and pathological functioning of genomic DNA.
Many recent structure–function DNA studies have been devoted to quadruplexes. Particular genomic regions, especially in gene promoters, have a potential to form quadruplexes (82,83), which are believed to form in vivo and affect cellular processes (79). CD spectroscopy is one of the most suitable methods to study quadruplex formation in various DNA motifs. Quadruplex formation in telomeric DNA is thought to be related to senescence and cancer. Thus, the telomeric G-quadruplex is an attractive target for cancer therapy (84–86). An understanding of the quadruplex structure and the ability to monitor formation or dissociation of this structure is important for the rational drug design. In this respect, CD spectroscopy has contributed significantly (44,45,87–91) to demonstration of the polymorhism (85,92–95) of the human telomere DNA structure (Figure 9). CD spectroscopy was one of the first methods used to show (44) that the parallel quadruplex of the human telomere DNA fragments observed in crystals (93) is not formed in vitro in K+-containing aqueous solution. CD was employed to demonstrate that the topology of the quadruplex folding depends on the number of human telomere DNA repeats and proposed the so-called (3 + 1) quadruplex structure (44) that was subsequently demonstrated by NMR (94,95). CD spectroscopy also provided the basis for the suggestion that a long telomeric sequence has a structure of beads on a string, like nucleosomes (44). This concept, which may contribute to the explanation of the gradual shortening of telomeric DNA, has generally been accepted (86,89,96) though it has not yet been confirmed by another method.
Last but not least, an important task of CD spectroscopy is the search for specific ligands that recognize DNA sequences and structures with high selectivity (97). These compounds may be used to target and regulate functional elements important in gene expression, including viral genes and oncogenes. The ability to selectively modulate the activity of genes is a long-standing goal in molecular medicine.
FUNDING
Internal Grant Agency of the Ministry of Health of the Czech Republic (grant NR9147-3/2007); Grant Agency of the Czech Republic (grant 204/07/0057); Academy of Sciences of the Czech Republic (grants IAA 100040701, AVOZ50040507 and AVOZ50040702). Funding for open access charge: Internal Grant Agency of the Ministry of Health of the Czech Republic (grant NR9147-3/2007).
Conflict of interest statement. None declared.
ACKNOWLEDGEMENTS
The authors are indebted to Prof. Janos Sagi for careful reading the article and valuable comments.
REFERENCES
- 1.Neidle S. Nucleic Acid Structure. New York: Oxford University Press Inc.; 1999. [Google Scholar]
- 2.Mirkin SM. Discovery of alternative DNA structures: a heroic decade (1979-1989) Front. Biosci. 2008;13:1064–1071. doi: 10.2741/2744. [DOI] [PubMed] [Google Scholar]
- 3.Wells RD. Non-B DNA conformations, mutagenesis and disease. Trends Biochem. Sci. 2007;32:271–278. doi: 10.1016/j.tibs.2007.04.003. [DOI] [PubMed] [Google Scholar]
- 4.Nakanishi K, Berova N, Woody RW. Circular Dichroism Principles and Applications. New York: VCH Publishers Inc.; 1991. [Google Scholar]
- 5.Woody RW. Circular dichroism. Methods Enzymol. 1995;246:34–71. doi: 10.1016/0076-6879(95)46006-3. [DOI] [PubMed] [Google Scholar]
- 6.Lewis DG, Johnson WC. Circular dichroism of DNA in the vacuum ultraviolet. J. Mol. Biol. 1974;86:91–96. doi: 10.1016/s0022-2836(74)80009-4. [DOI] [PubMed] [Google Scholar]
- 7.Keiderling TA, Pančoška P. Structural studies of biological macromolecules using vibrational circular dichroism. In: Clark RJH, Hester RE, editors. Biomolecular Spectroscopy,. Vol. 21. New York: John Wiley & Sons; 1993. pp. 267–315. [Google Scholar]
- 8.Johnson WC. Determination of the Conformation of Nucleic Acids by Electronic CD. New York: Plenum Press; 1996. [Google Scholar]
- 9.Kypr J, Vorlickova M. Graphical analysis of circular dichroic spectra distinguishes between two-state and gradual alterations in DNA conformation. Gen. Physiol. Biophys. 1986;5:415–422. [PubMed] [Google Scholar]
- 10.Maestre MF. Circular dichroism of DNA films: reversibility studies. J. Mol. Biol. 1970;52:543–556. doi: 10.1016/0022-2836(70)90418-3. [DOI] [PubMed] [Google Scholar]
- 11.Gray DM, Ratliff RL, Vaughan MR. Circular dichroism spectroscopy of DNA. Methods Enzymol. 1992;211:389–406. doi: 10.1016/0076-6879(92)11021-a. [DOI] [PubMed] [Google Scholar]
- 12.Gray DM, Wen JD, Gray CW, Repges R, Repges C, Raabe G, Fleischhauer J. Measured and calculated CD spectra of G-quartets stacked with the same or opposite polarities. Chirality. 2008;20:431–440. doi: 10.1002/chir.20455. [DOI] [PubMed] [Google Scholar]
- 13.Ivanov VI, Minchenkova LE, Schyolkina AK, Poletayev AI. Different conformations of double-stranded nucleic acid in solution as revealed by circular dichroism. Biopolymers. 1973;12:89–110. doi: 10.1002/bip.1973.360120109. [DOI] [PubMed] [Google Scholar]
- 14.Mitsui Y, Langridge R, Shortle BE, Cantor CR, Grant RC, Kodama M, Wells RD. Physical and enzymatic studies on poly d(I-C)-poly d(I-C), an unusual double-helical DNA. Nature. 1970;228:1166–1169. doi: 10.1038/2281166a0. [DOI] [PubMed] [Google Scholar]
- 15.Vorlickova M, Sagi J. Transitions of poly(dI-dC), poly(dI-methyl5dC) and poly(dI-bromo5dC) among and within the B-, Z-, A- and X-DNA families of conformations. Nucleic Acids Res. 1991;19:2343–2347. doi: 10.1093/nar/19.9.2343. [DOI] [PMC free article] [PubMed] [Google Scholar]
- 16.Nelson HCM, Finch JT, Luisi BF, Klug A. The structure of an oligo(dA)·oligo(dT) tract and its biological implications. Nature. 1987;330:221–226. doi: 10.1038/330221a0. [DOI] [PubMed] [Google Scholar]
- 17.Alexeev DG, Lipanov AA, Skuratovskii IY. Poly(dA).poly(dT) is a B-type double helix with a distinctively narrow minor groove. Nature. 1987;325:821–823. doi: 10.1038/325821a0. [DOI] [PubMed] [Google Scholar]
- 18.Trantirek L, Stefl R, Vorlickova M, Koca J, Sklenar V, Kypr J. An A-type double helix of DNA having B-type puckering of the deoxyribose rings. J. Mol. Biol. 2000;297:907–922. doi: 10.1006/jmbi.2000.3592. [DOI] [PubMed] [Google Scholar]
- 19.Studdert DS, Patroni M, Davis RC. Circular dichroism of DNA: temperature and salt dependence. Biopolymers. 1972;11:761–779. doi: 10.1002/bip.1972.360110404. [DOI] [PubMed] [Google Scholar]
- 20.Marky LA, Breslauer KJ. Calculating thermodynamic data for transitions of any molecularity from equilibrium melting curves. Biopolymers. 1987;26:1601–1620. doi: 10.1002/bip.360260911. [DOI] [PubMed] [Google Scholar]
- 21.Mergny JL, Lacroix L. Analysis of thermal melting curves. Oligonucleotides. 2003;13:515–537. doi: 10.1089/154545703322860825. [DOI] [PubMed] [Google Scholar]
- 22.Lane AN, Chaires JB, Gray RD, Trent JO. Stability and kinetics of G-quadruplex structures. Nucleic Acids Res. 2008;36:5482–5515. doi: 10.1093/nar/gkn517. [DOI] [PMC free article] [PubMed] [Google Scholar]
- 23.Pearson CE, Tam M, Wang YH, Montgomery SE, Dar AC, Cleary JD, Nichol K. Slipped-strand DNAs formed by long (CAG).(CTG) repeats: slipped-out repeats and slip-out junctions. Nucleic Acids Res. 2002;30:4534–4547. doi: 10.1093/nar/gkf572. [DOI] [PMC free article] [PubMed] [Google Scholar]
- 24.Pearson CE, Edamura KN, Cleary JD. Repeat instability: mechanisms of dynamic mutations. Nat. Rev. Genet. 2005;6:729–742. doi: 10.1038/nrg1689. [DOI] [PubMed] [Google Scholar]
- 25.Ivanov VI, Minchenkova LE, Minyat EE, Frank-Kamenetskii MD, Schyolkina AK. The B to A transition of DNA in solution. J. Mol. Biol. 1974;87:817–833. doi: 10.1016/0022-2836(74)90086-2. [DOI] [PubMed] [Google Scholar]
- 26.Stefl R, Trantirek L, Vorlickova M, Koca J, Sklenar V, Kypr J. A-like guanine-guanine stacking in the aqueous DNA duplex of d(GGGGCCCC) J. Mol. Biol. 2001;307:513–524. doi: 10.1006/jmbi.2001.4484. [DOI] [PubMed] [Google Scholar]
- 27.Vorlickova M, Sedlacek P, Kypr J, Sponar J. Conformational transitions of poly(dA-dT)·poly(dA-dT) in ethanolic solutions. Nucleic Acids Res. 1982;10:6969–6979. doi: 10.1093/nar/10.21.6969. [DOI] [PMC free article] [PubMed] [Google Scholar]
- 28.Ivanov VI, Krylov DY, Minyat EE. Three-state diagram for DNA. J. Biomol. Struct. Dyn. 1985;3:43–55. doi: 10.1080/07391102.1985.10508397. [DOI] [PubMed] [Google Scholar]
- 29.Vorlickova M, Subirana JA, Chladkova J, Tejralova I, HuynhDinh T, Arnold L, Kypr J. Comparison of the solution and crystal conformations of (G+C)-rich fragments of DNA. Biophysical J. 1996;71:1530–1538. doi: 10.1016/S0006-3495(96)79355-4. [DOI] [PMC free article] [PubMed] [Google Scholar]
- 30.Kypr J, Chladkova J, Zimulova M, Vorlickova M. Aqueous trifluorethanol solutions simulate the environment of DNA in the crystalline state. Nucleic Acids Res. 1999;27:3466–3473. doi: 10.1093/nar/27.17.3466. [DOI] [PMC free article] [PubMed] [Google Scholar]
- 31.Vorlickova M, Minyat EE, Kypr J. Cooperative changes in the chiroptical properties of DNA induced by methanol. Biopolymers. 1984;23:1–4. doi: 10.1002/bip.360230102. [DOI] [PubMed] [Google Scholar]
- 32.van Holde KE, Johnson WC, Ho PS. Principles of Physical Biochemistry. 3rd. Upper Saddle River, NJ: Pearson/Prentice Hall; 1998. [Google Scholar]
- 33.Pohl FM, Jovin TM. Salt-induced cooperative conformational change of a synthetic DNA: equilibrium and kinetic studies with poly(dG-dC) J. Mol. Biol. 1972;67:375–396. doi: 10.1016/0022-2836(72)90457-3. [DOI] [PubMed] [Google Scholar]
- 34.Ivanov VI, Minyat EE. The transitions between left- and right-handed forms of poly(dG-dC) Nucleic Acids Res. 1981;9:4783–4798. doi: 10.1093/nar/9.18.4783. [DOI] [PMC free article] [PubMed] [Google Scholar]
- 35.Hall KB, Maestre MF. Temperature-dependent reversible transition of poly(dCdG).poly(dCdG) in ethanolic and methanolic solutions. Biopolymers. 1984;23:2127–2139. doi: 10.1002/bip.360231103. [DOI] [PubMed] [Google Scholar]
- 36.Harder ME, Johnson WC. Stabilization of the Z' form of poly(dGdC):poly(dGdC) in solution by multivalent ions relates to the ZII form in crystals. Nucleic Acids Res. 1990;18:2141–2148. doi: 10.1093/nar/18.8.2141. [DOI] [PMC free article] [PubMed] [Google Scholar]
- 37.Gray DM, Hung SH, Johnson KH. Absorption and circular dichroism spectroscopy of nucleic acid duplexes and triplexes. Methods Enzymol. 1995;246:19–34. doi: 10.1016/0076-6879(95)46005-5. [DOI] [PubMed] [Google Scholar]
- 38.Xodo LE, Manzini G, Quadrifoglio F. Spectroscopic and calorimetric investigation on the DNA triplex formed by d(CTCTTCTTTCTTTTCTTTCTTCTC) and d(GAGAAGAAAGA) at acidic pH. Nucleic Acids Res. 1990;18:3557–3564. doi: 10.1093/nar/18.12.3557. [DOI] [PMC free article] [PubMed] [Google Scholar]
- 39.Khomyakova EB, Gousset H, Liquier J, Huynh-Dinh T, Gouyette C, Takahashi M, Florentiev VL, Taillandier E. Parallel intramolecular DNA triple helix with G and T bases in the third strand stabilized by Zn2+ ions. Nucleic Acids Res. 2000;28:3511–3516. doi: 10.1093/nar/28.18.3511. [DOI] [PMC free article] [PubMed] [Google Scholar]
- 40.Simon P, Cannata F, Concordet JP, Giovannangeli C. Targeting DNA with triplex-forming oligonucleotides to modify gene sequence. Biochimie. 2008;90:1109–1116. doi: 10.1016/j.biochi.2008.04.004. [DOI] [PubMed] [Google Scholar]
- 41.Jain A, Wang G, Vasquez KM. DNA triple helices: biological consequences and therapeutic potential. Biochimie. 2008;90:1117–1130. doi: 10.1016/j.biochi.2008.02.011. [DOI] [PMC free article] [PubMed] [Google Scholar]
- 42.Balagurumoorthy P, Brahmachari SK, Mohanty D, Bansal M, Sasisekharan V. Hairpin and parallel quartet structures for telomeric sequences. Nucleic Acids Res. 1992;20:4061–4067. doi: 10.1093/nar/20.15.4061. [DOI] [PMC free article] [PubMed] [Google Scholar]
- 43.Dapic V, Abdomerovic V, Marrington R, Peberdy J, Rodger A, Trent JO, Bates PJ. Biophysical and biological properties of quadruplex oligodeoxyribonucleotides. Nucleic Acids Res. 2003;31:2097–2107. doi: 10.1093/nar/gkg316. [DOI] [PMC free article] [PubMed] [Google Scholar]
- 44.Vorlickova M, Chladkova J, Kejnovska I, Fialova M, Kypr J. Guanine tetraplex topology of human telomere DNA is governed by the number of (TTAGGG) repeats. Nucleic Acids Res. 2005;33:5851–5860. doi: 10.1093/nar/gki898. [DOI] [PMC free article] [PubMed] [Google Scholar]
- 45.Paramasivan S, Rujan I, Bolton PH. Circular dichroism of quadruplex DNAs: applications to structure, cation effects and ligand binding. Methods. 2007;43:324–331. doi: 10.1016/j.ymeth.2007.02.009. [DOI] [PubMed] [Google Scholar]
- 46.Vorlickova M, Bednarova K, Kypr J. Ethanol is a better inducer of DNA guanine tetraplexes than potassium cations. Biopolymers. 2006;82:253–260. doi: 10.1002/bip.20488. [DOI] [PubMed] [Google Scholar]
- 47.Vorlickova M, Bednarova K, Kejnovska I, Kypr J. Intramolecular and intermolecular guanine quadruplexes of DNA in aqueous salt and ethanol solutions. Biopolymers. 2007;86:1–10. doi: 10.1002/bip.20672. [DOI] [PubMed] [Google Scholar]
- 48.Kypr J, Fialova M, Chladkova J, Tumova M, Vorlickova M. Conserved guanine-guanine stacking in tetraplex and duplex DNA. Eur. Biophys. J. 2001;30:555–558. doi: 10.1007/s002490100174. [DOI] [PubMed] [Google Scholar]
- 49.Kypr J, Vorlickova M. Circular dichroism spectroscopy reveals invariant conformation of guanine runs in DNA. Biopolymers. 2002;67:275–277. doi: 10.1002/bip.10112. [DOI] [PubMed] [Google Scholar]
- 50.Mergny JL, Lacroix L, Han XG, Leroy JL, Helene C. Intramolecular folding of pyrimidine oligodeoxynucleotides into a I-DNA motif. J. Am. Chem. Soc. 1995;117:8887–8898. [Google Scholar]
- 51.Gueron M, Leroy JL. The i-motif in nucleic acids. Curr. Opin. Struct. Biol. 2000;10:326–331. doi: 10.1016/s0959-440x(00)00091-9. [DOI] [PubMed] [Google Scholar]
- 52.Manzini G, Yathindra N, Xodo LE. Evidence for intramolecularly folded i-DNA structures in biologically relevant CCC-repeat sequences. Nucleic Acids Res. 1994;22:4634–4640. doi: 10.1093/nar/22.22.4634. [DOI] [PMC free article] [PubMed] [Google Scholar]
- 53.Simonsson T, Pribylova M, Vorlickova M. A nuclease hypersensitive element in the human c-myc promoter adopts several distinct i-tetraplex structures. Biochem. Biophys. Res. Commun. 2000;278:158–166. doi: 10.1006/bbrc.2000.3783. [DOI] [PubMed] [Google Scholar]
- 54.Casasnovas JM, Huertas D, Ortiz-Lombardia M, Kypr J, Azorin F. Structural polymorphism of d(GA.TC)n DNA sequences. Intramolecular and intermolecular associations of the individual strands. J. Mol. Biol. 1993;233:671–681. doi: 10.1006/jmbi.1993.1544. [DOI] [PubMed] [Google Scholar]
- 55.Ortiz-Lombardia M, Eritja R, Azorin F, Kypr J, Tejralova I, Vorlickova M. Divalent zinc cations induce the formation of two distinct homoduplexes of a d(GA)20 DNA sequence. Biochemistry. 1995;34:14408–14415. doi: 10.1021/bi00044a018. [DOI] [PubMed] [Google Scholar]
- 56.Rippe K, Fritsch V, Westhof E, Jovin TM. Alternating d(G-A) sequences form a parallel-stranded DNA homoduplex. EMBO J. 1992;11:3777–3786. doi: 10.1002/j.1460-2075.1992.tb05463.x. [DOI] [PMC free article] [PubMed] [Google Scholar]
- 57.Kypr J, Vorlickova M. Dimethylsulfoxide-stabilized conformer of guanine-adenine repeat strand of DNA. Biopolymers. 2001;62:81–84. doi: 10.1002/bip.1000. [DOI] [PubMed] [Google Scholar]
- 58.Kejnovska I, Kypr J, Vondruskova J, Vorlickova M. Towards a better understanding of the unusual conformations of the alternating guanine-adenine repeat strands of DNA. Biopolymers. 2007;85:19–27. doi: 10.1002/bip.20597. [DOI] [PubMed] [Google Scholar]
- 59.Dolinnaya NG, Fresco JR. Single-stranded nucleic acid helical secondary structure stabilized by ionic bonds: d(A+-G)10. Proc. Natl Acad. Sci. USA. 1992;89:9242–9246. doi: 10.1073/pnas.89.19.9242. [DOI] [PMC free article] [PubMed] [Google Scholar]
- 60.Dolinnaya NG, Ulku A, Fresco JR. Parallel-stranded linear homoduplexes of d(A+-G)n>10 and d(A-G)n>10 manifesting the contrasting ionic strength sensitivities of poly(A+·A+) and DNA. Nucleic Acids Res. 1997;25:1100–1107. doi: 10.1093/nar/25.6.1100. [DOI] [PMC free article] [PubMed] [Google Scholar]
- 61.Dolinnaya NG, Fresco JR. Conformational polymorphism of d(A-G)n and related oligonucleotide sequences. Prog. Nucleic. Acid. Res. 2003;75:321–347. doi: 10.1016/s0079-6603(03)75009-0. [DOI] [PubMed] [Google Scholar]
- 62.Vorlickova M, Kejnovska I, Kovanda J, Kypr J. Dimerization of the guanine-adenine repeat strands of DNA. Nucleic Acids Res. 1999;27:581–586. doi: 10.1093/nar/27.2.581. [DOI] [PMC free article] [PubMed] [Google Scholar]
- 63.Vorlickova M, Kypr J, Sklenar V. Salt-induced conformational transition of poly[d(A-T)]·poly[d(A-T)] J. Mol. Biol. 1983;166:85–92. doi: 10.1016/s0022-2836(83)80052-7. [DOI] [PubMed] [Google Scholar]
- 64.Vorlickova M, Kypr J. Conformational variability of poly(dA-dT).poly(dA-dT) and some other deoxyribonucleic acids includes a novel type of double helix. J. Biomol. Struct. Dyn. 1985;3:67–83. doi: 10.1080/07391102.1985.10508399. [DOI] [PubMed] [Google Scholar]
- 65.Kypr J, Chladkova J, Arnold L, Sagi J, Szemzo A, Vorlickova M. The unusual X-form DNA in oligodeoxynucleotides: dependence of stability on the base sequence and length. J. Biomol. Struct. Dyn. 1996;13:999–1006. doi: 10.1080/07391102.1996.10508914. [DOI] [PubMed] [Google Scholar]
- 66.Abrescia NGA, Thompson A, Huynh-Dinh T, Subirana JA. Crystal structure of an antiparallel DNA fragment with Hoogsteen base pairing. Proc. Natl Acad. Sci. USA. 2002;99:2806–2811. doi: 10.1073/pnas.052675499. [DOI] [PMC free article] [PubMed] [Google Scholar]
- 67.Bourtayre P, Liquier J, Pizzorni L, Taillandier E. Z form of poly d(A-T).poly d(A-T) in solution studied by CD and UV spectroscopies. J. Biomol. Struct. Dyn. 1987;5:97–104. doi: 10.1080/07391102.1987.10506378. [DOI] [PubMed] [Google Scholar]
- 68.Ridoux JP, Liquier J, Taillandier E. Raman spectroscopy of Z-form poly[d(A-T)].poly[d(A-T)] Biochemistry. 1988;27:3874–3878. doi: 10.1021/bi00410a052. [DOI] [PubMed] [Google Scholar]
- 69.Vorlickova M, Chladkova J, Kypr J. Conformational transitions of poly(dA-bromo5dU) and poly(dA-iodo5dU) in solution. Nucleic Acids Res. 1992;20:1109–1112. doi: 10.1093/nar/20.5.1109. [DOI] [PMC free article] [PubMed] [Google Scholar]
- 70.Behe M, Felsenfeld G. Effects of methylation on a synthetic polynucleotide: the B-Z transition in poly(dG-m5dC).poly(dG-m5dC) Proc. Natl Acad. Sci. USA. 1981;78:1619–1623. doi: 10.1073/pnas.78.3.1619. [DOI] [PMC free article] [PubMed] [Google Scholar]
- 71.Vorlickova M, Sagi J, Szabolcs A, Szemzo A, Otvos L, Kypr J. Poly(amino2dA-dT) isomerizes into the unusual X-DNA double helix at physiological conditions inducing Z-DNA in poly (dG-methyl5dC) J. Biomol. Struct. Dyn. 1988;6:503–510. doi: 10.1080/07391102.1988.10506503. [DOI] [PubMed] [Google Scholar]
- 72.Borah B, Cohen JS, Howard FB, Miles HT. Poly(d2NH2A-dT): two-dimensional NMR shows a B to A conversion in high salt. Biochemistry. 1985;24:7456–7462. doi: 10.1021/bi00346a064. [DOI] [PubMed] [Google Scholar]
- 73.Vorlickova M, Sagi J, Szabolcs A, Szemzo A, Otvos L, Kypr J. Conformation of the synthetic DNA poly(amino2dA-dT) duplex in high-salt and aqueous alcohol solutions. Nucleic Acids Res. 1988;16:279–289. doi: 10.1093/nar/16.1.279. [DOI] [PMC free article] [PubMed] [Google Scholar]
- 74.Tinoco I, Mickols W, Maestre MF, Bustamante C. Absorption, scattering, and imaging of biomolecular structures by polarized-light. Ann. Rev. Biophys. Biophys. Chem. 1987;16:319–349. doi: 10.1146/annurev.bb.16.060187.001535. [DOI] [PubMed] [Google Scholar]
- 75.Jordan CF, Lerman LS, Venable JH. Structure and circular dichroism of DNA in concentrated polymer solutions. Nat. New Biol. 1972;236:67–70. doi: 10.1038/newbio236067a0. [DOI] [PubMed] [Google Scholar]
- 76.Andrushchenko V, Leonenko Z, Cramb D, van de Sande JH, Wieser H. Vibrational CD (VCD) and atomic force microscopy (AFM) study of DNA interaction with Cr3+ ions: VCD and AFM evidence of DNA condensation. Biopolymers. 2001;61:243–260. doi: 10.1002/bip.10159. [DOI] [PubMed] [Google Scholar]
- 77.Protozanova E, MacGregor RB. Circular dichroism of DNA frayed wires. Biophys. J. 1998;75:982–989. doi: 10.1016/S0006-3495(98)77586-1. [DOI] [PMC free article] [PubMed] [Google Scholar]
- 78.Ito Y, Fukusaki E. DNA as a ‘nanomaterial’. J. Mol. Catal. B-Enzym. 2004;28:155–166. [Google Scholar]
- 79.Neidle S, Balasubramanian S, editors. Quadruplex Nucleic Acids. London, Cambridge: Royal Society of Chemistry; 2006. [Google Scholar]
- 80.Li J, Correia JJ, Wang L, Trent JO, Chaires JB. Not so crystal clear: the structure of the human telomere G-quadruplex in solution differs from that present in a crystal. Nucleic Acids Res. 2005;33:4649–4659. doi: 10.1093/nar/gki782. [DOI] [PMC free article] [PubMed] [Google Scholar]
- 81.Wang AHJ, Quigley GJ, Kolpak FJ, Crawford JL, van Boom JH, van der Marel G, Rich A. Molecular structure of a left-handed double helical DNA fragment at atomic resolution. Nature. 1979;282:680–686. doi: 10.1038/282680a0. [DOI] [PubMed] [Google Scholar]
- 82.Todd AK, Johnston M, Neidle S. Highly prevalent putative quadruplex sequence motifs in human DNA. Nucleic Acids Res. 2005;33:2901–2907. doi: 10.1093/nar/gki553. [DOI] [PMC free article] [PubMed] [Google Scholar]
- 83.Huppert JL, Balasubramanian S. Prevalence of quadruplexes in the human genome. Nucleic Acids Res. 2005;33:2908–2916. doi: 10.1093/nar/gki609. [DOI] [PMC free article] [PubMed] [Google Scholar]
- 84.Mergny JL, Lacroix L, Teulade-Fichou MP, Hounsou C, Guittat L, Hoarau M, Arimondo PB, Vigneron JP, Lehn JM, Riou JF, et al. Telomerase inhibitors based on quadruplex ligands selected by a fluorescence assay. Proc. Natl Acad. Sci. USA. 2001;98:3062–3067. doi: 10.1073/pnas.051620698. [DOI] [PMC free article] [PubMed] [Google Scholar]
- 85.Dai J, Carver M, Yang D. Polymorphism of human telomeric quadruplex structures. Biochimie. 2008;90:1172–1183. doi: 10.1016/j.biochi.2008.02.026. [DOI] [PMC free article] [PubMed] [Google Scholar]
- 86.De Cian A, Lacroix L, Douarre C, Temime-Smaali N, Trentesaux C, Riou JF, Mergny JL. Targeting telomeres and telomerase. Biochimie. 2008;90:131–155. doi: 10.1016/j.biochi.2007.07.011. [DOI] [PubMed] [Google Scholar]
- 87.Balagurumoorthy P, Brahmachari SK. Structure and stability of human telomeric sequence. J. Biol. Chem. 1994;269:21858–21869. [PubMed] [Google Scholar]
- 88.Rujan IN, Meleney JC, Bolton PH. Vertebrate telomere repeat DNAs favor external loop propeller quadruplex structures in the presence of high concentrations of potassium. Nucleic Acids Res. 2005;33:2022–2031. doi: 10.1093/nar/gki345. [DOI] [PMC free article] [PubMed] [Google Scholar]
- 89.Ambrus A, Chen D, Dai J, Bialis T, Jones RA, Yang D. Human telomeric sequence forms a hybrid-type intramolecular G-quadruplex structure with mixed parallel/antiparallel strands in potassium solution. Nucleic Acids Res. 2006;34:2723–2735. doi: 10.1093/nar/gkl348. [DOI] [PMC free article] [PubMed] [Google Scholar]
- 90.Kaushik M, Bansal A, Saxena S, Kukreti S. Possibility of an antiparallel (tetramer) quadruplex exhibited by the double repeat of the human telomere. Biochemistry. 2007;46:7119–7131. doi: 10.1021/bi0621009. [DOI] [PubMed] [Google Scholar]
- 91.Antonacci C, Chaires JB, Sheardy RD. Biophysical characterization of the human telomeric (TTAGGG)4 repeat in a potassium solution. Biochemistry. 2007;46:4654–4660. doi: 10.1021/bi602511p. [DOI] [PubMed] [Google Scholar]
- 92.Wang Y, Patel DJ. Solution structure of the human telomeric repeat d[AG3(T2AG3)3] G-tetraplex. Structure. 1993;1:263–282. doi: 10.1016/0969-2126(93)90015-9. [DOI] [PubMed] [Google Scholar]
- 93.Parkinson GN, Lee MPH, Neidle S. Crystal structure of parallel quadruplexes from human telomeric DNA. Nature. 2002;417:876–880. doi: 10.1038/nature755. [DOI] [PubMed] [Google Scholar]
- 94.Luu KN, Phan AT, Kuryavyi V, Lacroix L, Patel DJ. Structure of the human telomere in K+ solution: an intramolecular (3+1) G-quadruplex scaffold. J. Am. Chem. Soc. 2006;128:9963–9970. doi: 10.1021/ja062791w. [DOI] [PMC free article] [PubMed] [Google Scholar]
- 95.Phan AT, Luu KN, Patel DJ. Different loop arrangements of intramolecular human telomeric (3 + 1) G-quadruplexes in K+ solution. Nucleic Acids Res. 2006;34:5715–5719. doi: 10.1093/nar/gkl726. [DOI] [PMC free article] [PubMed] [Google Scholar]
- 96.Haider S, Parkinson GN, Neidle S. Molecular dynamics and principal components analysis of human telomeric quadruplex multimers. Biophysical J. 2008;95:296–311. doi: 10.1529/biophysj.107.120501. [DOI] [PMC free article] [PubMed] [Google Scholar]
- 97.Monchaud D, Allain C, Bertrand H, Smargiasso N, Rosu F, Gabelica V, De Cian A, Mergny JL, Teulade-Fichou MR. Ligands playing musical chairs with G-quadruplex DNA: a rapid and simple displacement assay for identifying selective G-quadruplex binders. Biochimie. 2008;90:1207–1223. doi: 10.1016/j.biochi.2008.02.019. [DOI] [PubMed] [Google Scholar]


