


Abstract
We have developed a new bioinformatics approach called ECMFinder (Evolutionary Conserved Motif Finder). This program searches for a given DNA motif within the entire genome of one species and uses the gene association information of a potential transcription factor-binding site (TFBS) to screen the homologous regions of a second and third species. If multiple species have this potential TFBS in homologous positions, this program recognizes the identified TFBS as an evolutionary conserved motif (ECM). This program outputs a list of ECMs, which can be uploaded as a Custom Track in the UCSC genome browser and can be visualized along with other available data. The feasibility of this approach was tested by searching the genomes of three mammals (human, mouse and cow) with the DNA-binding motifs of YY1 and CTCF. This program successfully identified many clustered YY1- and CTCF-binding sites that are conserved among these species but were previously undetected. In particular, this program identified CTCF-binding sites that are located close to the Dlk1, Magel2 and Cdkn1c imprinted genes. Individual ChIP experiments confirmed the in vivo binding of the YY1 and CTCF proteins to most of these newly discovered binding sites, demonstrating the feasibility and usefulness of ECMFinder.
INTRODUCTION
Identifying transcription factor-binding sites (TFBSs) within the raw genome sequences of higher eukaryotes is quite challenging using current knowledge and methods. The sequences and sizes of many known TFBSs are usually degenerate and very short (<15 bp in length) compared to the large sizes of the genomes. (100 Mb to several Gigabases) (1–4). Thus, the huge number of fortuitous false-positive TFBSs easily outnumber the functionally relevant TFBSs (5). To filter out this vast majority of false positives, several bioinformatics strategies focus on small fractions of genomes which have been prefiltered based on their evolutionary conservation (6–10). These evolutionary conserved regions (ECRs), which are defined as sequences at least 100 bp long with at least 70% identity, include most of the protein-coding exons as well as promoters, enhancers and repressors (11). Targeting these ECRs could be a logical, first step for finding TFBSs. However, recent large-scale genomic studies with chromatin immunoprecipitation (ChIP)-based ChIP-chip or ChIP-seq techniques indicate that many in vivo TFBSs are also found in genomic regions that are not evolutionarily conserved (12,13). Similarly, according to studies from the genomic imprinting field, the most critical regions for controlling imprinting, imprinting control regions (ICRs), exhibit no sequence conservation among different species. Instead, they tend to display high levels of sequence divergence, but harbor unusual tandem arrays of a single type of TFBSs, such as YY1- and CTCF-binding sites (14,15). These recent findings emphasize a need to implement different approaches to identify TFBSs.
As part of the effort of analyzing mammalian imprinted domains, we have developed a bioinformatics approach called Evolutionary Conserved Motif Finder (ECMFinder). ECMFinder searches through the genome of one species using a given DNA motif, and catalogs the gene association information of this potential TFBS, which is subsequently used for screening the homologous gene regions of the second and third species. If all compared species have the potential TFBS in homologous positions, this program recognizes the identified TFBS as an evolutionary conserved motif (ECM). In contrast to existing approaches, this new approach does not limit searchable regions from a given genome based on their evolutionary conservation levels. Instead, this program utilizes the positional information of a potential TFBS relative to its nearby gene and the conservation of its association with the neighbor gene as a filtering criterion. To demonstrate the feasibility of this new approach, we searched through the genomes of three mammals (human, mouse and cow) with the consensus DNA-binding motifs of YY1 and CTCF. ECMFinder successfully identified 31 YY1 candidate downstream genes which had YY1-binding sites near their promoter regions. In addition, this program also isolated 174 loci, each of which has more than three CTCF-binding sites. The in vivo binding to the YY1 and CTCF proteins of some of these newly discovered binding sites was further confirmed using ChIP experiments.
MATERIALS AND METHODS
Data sources and implementation
Human (hg18), mouse (mm9), cow (bosTau4) and chicken (galGal3) genome sequences were obtained from the UCSC Genome Bioinformatics site (data set by chromosome, ftp://hgdownload.cse.ucsc.edu). Annotated table data for all genes were collected using the Table Browser (group: Genes and Gene Prediction Tracks, track: RefSeq Genes, region: genome). Annotations of homologs were obtained from the HomoloGene database (ftp://ftp.ncbi.nih.gov/pub/HomoloGene/build62). The true binding site of E2F1 used in Table 1 was obtained from mouse embryonic stem cell ChIP-seq data (16) and converted to the mm9 version (NCBI Build 37) with the liftOver tool (http://genome.ucsc.edu/cgi-bin/hgLiftOver). The mouse and human CTCF ChIP-seq data used in Table 2 were obtained from the study of mouse ES cells (16) and human CD4+ T cells (http://dir.nhlbi.nih.gov/papers/lmi/epigenomes/hgTcell.html) (17). The human CTCF ChIP-chip data used in Figure 4 were obtained and converted to the hg18 version by using the liftOver tool (13).
Table 1.
Comparison to other methods using E2F1 ChIP-seq dataset
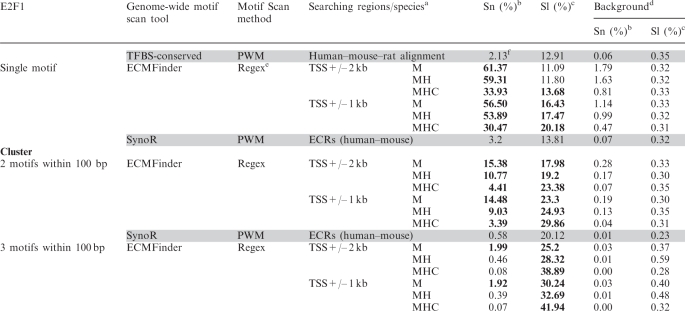 |
aM: mouse only, MH: mouse–human, MHC: mouse–human–cow.
bSn: sensitivity.
cSl: selectivity.
dBackground: random set (see ‘Materials and methods’ section).
eRegex: regular expressions.
fAlthough the values on the above table are presented in the four digits of significance, it is important to note that only the first two digits are statistically important.
The values in bold are significantly greater than those by the currently available methods (in gray).
Table 2.
Genome-wide CTCF ECMs identified by ECMFinder
| ChIP-seq data (total number) | Species comparison | ECMFinder (%) |
Background (%)a |
||
|---|---|---|---|---|---|
| Sensitivity | Selectivity | Sensitivity | Selectivity | ||
| Human (39 442) | Human only | 1.90b | 28.84 | 0.32 | 4.89 |
| Human and mouse | 0.68 | 38.1 | 0.10 | 5.50 | |
| Human–mouse–cow | 0.42 | 36.91 | 0.06 | 5.23 | |
| Mouse (36 835) | Mouse only | 0.36 | 22.84 | 0.09 | 5.95 |
| Mouse and human | 0.21 | 30.89 | 0.04 | 5.24 | |
| Mouse–human–cow | 0.13 | 33.8 | 0.02 | 6.27 | |
aBackground was calculated using random sets resulting from 10 iterations.
bThe values on the above table are presented in the four digits of significance, but only the first two digits are statistically important.
The values in bold are greater than those from the background.
Figure 4.


CTCF ECMs in the DLK1-DIO3 domain. (A) Custom Track View of human chromosome 14. The first track shows the density of genome-wide CTCF ChIP-seq data (17). The second track shows the log2 value of genome-wide CTCF ChIP-chip data (13). The third and fourth tracks indicate the CTCF ECMs and CTCF single binding motif detected by ECMFinder, respectively. The remaining tracks have been derived from the UCSC genome browser. The CTCF motifs are conserved although their flanking sequences have degenerated. Each sequence includes a CTCF motif (red) with its immediate surrounding regions (bottom left). The middle section shows the Dlk1-Dio3 domain in mouse chromosome 12. Maternally and paternally expressed genes are indicated by red and blue arrows, respectively. Sequence alignments of individual CTCF-binding sites and their flanking regions are also shown in the bottom left section. (B) ChIP confirmation of the three CTCF sites using mouse liver tissues. The Gtl2-DMR and H19-ICR were used as positive controls, and the Dlk1-3′ DMR was used as a negative control. Individual ChIP results from the three CTCF sites are shown below with their site numbers. (C) The first CTCF-binding site (#1) is well conserved among seven mammalian species (mouse, rat, human, orangutan, dog, horse and opossum). (D) PvuII enzyme digestion of CTCF ChIP–PCR product with an input control. PvuII digests only the paternal DNA (Mus spretus). The upper band is an undigested DNA (300 bp) and the lower band is a 241-bp fragment of DNA digested by PvuII. (E) Results of bisulfite sequencing of the 957-bp region surrounding the CTCF site #1. The closed and open circles indicate methylated and unmethylated CpGs, respectively. The red triangle represents the position of the CTCF site #1. The bisulfite sequencing results were further separated based on parental origin indicated by sex symbols and species names.
ECMFinder and its source code can be downloaded freely at the following website: http://jookimlab.lsu.edu/?q=node/73. Before using this tool, the genome sequences listed above must be downloaded (see ‘readme.txt’ for details).
Common gene annotation table (CGAT) database
We used the HomoloGene database (release 62) to define homologous regions among species. Coordinates and other information about homologous genes were extracted from the RefSeq database and merged with the HomoloGene database using Galaxy (http://galaxy.psu.edu/). We generated the CGAT database with this merged file, ‘X.cgat’ (X denotes species’ name), which contains all the information about homologous genes from ‘X’ species. ECMFinder uses the transcription start sites (TSSs) of genes to define their homologous regions. Thus, in the case of some genes with multiple TSSs, ECMFinder selects one of these TSSs. Using this approach, 15 CGAT files were constructed with different combinations of the four species (human, mouse, cow and chicken). As the number of species was increased, the size of the CGAT database shrank. For example, the CGAT database containing homologous genes from two species (human and mouse) has 15 567 genes, whereas the database with homologous genes from three species (human, mouse and cow) has only 7697 genes.
Data set construction for validation: E2F1 and CTCF
To determine the specificity of ECMs identified by ECMFinder and other methods, we used mouse E2F1 and CTCF ChIP-seq data sets from the literature (16,17). The flanking regions of the E2F1 and CTCF ChIP-seq tags, 500 bp and 400 bp in size, respectively, were defined as the true binding regions for these proteins based on the average sizes of ChIP–DNA fragments described (16,17). In the case of the human CTCF ChIP-seq data set, we have selected only the regions bound by at least five tags. In total 17629 E2F1 and 36835 CTCF-binding sites were defined as true binding sites for these proteins in the mouse, while 39442 CTCF-binding sites were defined as the true binding sites for this protein in the human. All raw data sets used for validation of the ECMFinder can be downloaded at: http://jookimlab.lsu.edu/?q=node/73.
Comparison of ECMFinder with other methods
The performance of ECMFinder was evaluated by comparing the predicted versus confirmed DNA-binding sites of the transcription factor (TF) E2F1. We used the available E2F1 ChIP-seq data set as a confirmed data set (16). The performance of ECMFinder was compared with that of two other programs, SynoR and the HMR conserved TFBSs (UCSC track). Both methods predict DNA-binding sites based on the position weight matrix (PWM) profiles of E2F1. SynoR only searches predefined regions called evolutionary conserved regions (ECRs) for clusters of DNA-binding sites (more than two motifs). The HMR conserved TFBSs contains a set of TF-binding sites that are conserved across the human–mouse–rat alignment above a certain threshold (default 2.33) for a given binding matrix (Transfac Matrix Database, v7.0). The following matrices were used in the HMR conserved TFBSs for the prediction of the E2F1 motif (PWMs: V$E2F_01, V$E2F_02 and V$E2F_03). SynoR prediction of clusters of E2F1-binding sites was performed using the following matrices (PWMs: E2F1_Q3, E2F1_Q4 and E2F1_Q6). Single and clustered E2F1-binding sites were also predicted with ECMFinder. The matrix patterns and regular expression used in this study are provided in Supplementary Table 6. The set of predicted binding sites obtained from each of the above three methods was compared with the true binding site set derived from the ChIP-seq data sets. We calculated two values, sensitivity and selectivity, through comparing the predicted versus confirmed data sets of E2F1 sites. The sensitivity of each method was derived from the ratio of total number of correctly predicted binding sites from a given method to the total number of the true binding sites. The selectivity of each method was calculated by dividing the total number of correctly predicted binding sites by the total number of predicted binding sites for a given method. Finally, the sensitivity and selectivity of the three predictions were compared to each other.
ChIP assay
Replicates of ChIP assays were performed more than three times according to the protocol provided by Upstate Biotechnology (Upstate Biotech) with minimal modifications as described previously (14). Briefly, we used mouse liver tissues from F1 hybrid mice (Mus musculus × Mus spretus) homogenized in 10 ml of PBS. Formaldehyde was added to the samples to a final concentration of 1% and the samples were incubated at 37°C for 10 min. The treated samples were sonicated to fractionate the DNA and immunoprecipitated with anti-YY1 polyclonal antibody (catalog no. sc-1703, Santa Cruz Biotechnology) or anti-CTCF polyclonal antibody (catalog no. 07-729, Millipore Corporation). The precipitated DNA and protein complexes were reverse cross-linked and purified through phenol/chloroform extraction. Purified DNA was used as templates for PCR amplification. The primer sequences used for this study are provided in Supplementary Table 2. PCR amplifications were carried out for 37 cycles using standard PCR conditions. The amplified PCR products were analyzed through electrophoresis on 2% agarose gels containing ethidium bromide.
DNA methylation analysis through the bisulphite sequencing method
Bisulfite modification of genomic DNA derived from F1 hybrid tissues (M. musculus × M. spretus) were performed using EZ DNA MethylationTM kit (Zymo Research). The bisulfite-modified DNA was amplified by a set of primers (Supplementary Table 2). PCR amplifications were carried out for 38 cycles using standard PCR conditions (annealing temperature was 58°C). The amplified PCR products were separated by agarose gel electrophoresis, and purified using the MEGA-spinTM Agarose Gel Extraction Kit (Intron). Purified DNA was cloned into the pGEM T-Easy Vector (Promega), plasmid DNAs were isolated using the DNA-spinTM Plasmid DNA Purification Kit (Intron) and finally sequenced using BigDye v3.1 (Applied Biosystems).
RESULTS
ECMFinder algorithm and requirements
ECMFinder incorporates the following principles into its algorithm. First, the motif search of ECMFinder is based on a text pattern-matching method within the Perl programming language. Although PWM approaches provide more quantitative information about the motif search, they are not suitable for many TFs that do not have reliable PWM profiles. This has been one of motivations for the use of text pattern-matching strategies in ECMFinder. Second, the homologous regions used in ECMFinder have been defined as the regions surrounding the TSSs of homologous genes in the HomoloGene database. This database contains a list of homologous gene groups that have been derived using protein alignments of multiple species. In detail, ECMFinder first scans one genomic region surrounding the TSS of a given gene with a user-defined motif. If at least one motif is identified in the region, ECMFinder further searches homologous regions from the other species using the HomoloGene database (Figure 1). If all species have at least one motif in a given homologous region, this motif is regarded as an ECM.
Figure 1.

Overall scheme of ECMFinder. ECMFinder uses the CGAT (Common Gene Annotation Table) database, which is the product of merging homologous gene annotations derived from HomoloGene (release 62) and the genome sequence of four species—human (hg18), mouse (mm9), cow (bosTau4) and chicken (galGal3). Users can define an input motif based on the ECMFinder syntax, which is briefly described in the Readme file of the program (Step 1). ECMFinder searches a user-defined homologous region (dark blue bar) around a gene's TSS for the motif (or motif cluster) in all species. If at least one motif (or motif cluster) exists in the homologous region of all species, they are identified as ECMs (Evolutionary Conserved Motifs, red oval) (Step 2). The output of ECMFinder is a GFF (General Feature Format) file that can be uploaded to the UCSC genome browser as a Custom Track and visualized along with other data sets (Step 3).
As a stand-alone program, the genome sequences must be downloaded and extracted as a chromosomal file format within a user's computer that contains the ECMFinder program (see ‘Materials and methods’ section) (Step 1 in Figure 1). To facilitate cross-species indexing of homologous regions, different table database sets from multiple species and the HomoloGene database were converted into a single common database, termed ‘CGAT’ (Step 1 in Figure 1). The merged CGAT database contains all the genes with their position information in multiple species. The current version of ECMFinder contains CGAT files embedded within its compiled program which have been generated through merging annotation tables for four different species: human, mouse, cow and chicken. It is important to use the same versions of genome sequences. The genome builds that are compatible with the embedded CGAT in the current version of ECMFinder are as follows: human (hg18), mouse (mm9), cow (bosTau4) and chicken (galGal3) genome sequences.
Performance test of ECMFinder
The performance of ECMFinder was compared with two genome-wide motif scan methods, SynoR and the HMR conserved TFBS method (Table 1, gray column). For this comparison, we used E2F1 ChIP-seq data as a set of true E2F1-binding sites (16). We compared this set of binding sites with several sets of E2F1-binding sites that were predicted with the above three methods (see ‘Materials and methods’ section). We estimated two indexes, sensitivity and selectivity, for the comparison of the three prediction methods. The sensitivity index is the ratio of the total number of binding sites correctly predicted by a given method to the total number of true binding sites. The selectivity index is the ratio of the total number of correctly predicted binding sites to the total number of binding sites predicted by a given method. This comparison analysis revealed the following conclusions. First, each of the three methods achieved much higher levels of sensitivity and selectivity than those from a background set that had been randomly selected from genomes. Second, for the prediction of single motifs (the first section in Table 1), ECMFinder outperformed the HMR conserved TFBS method (the first section in Table 1, bold). The sensitivity of ECMFinder ranged from 30.47% to 61.37% (5371 to 10819/17629), whereas the sensitivity of the HMR conserved TFBSs was 2.13% (376/17629). However, the selectivity of the two methods was within a similar range (11–20% for ECMFinder versus 12.91% for the HMR conserved TFBSs). Third, for the prediction of clustered motifs (two or three motifs within a 100-bp region), the sensitivity index of ECMFinder had overall higher values than SynoR (the second and third section in Table 1, bold) although the selectivity by the two methods was in a similar range (10–40%).
The above comparison also provided the following insights regarding the strengths of ECMFinder along with those of the two other methods. ECMFinder performed much better than the two other methods in terms of sensitivity although all three methods were similar in terms of selectivity. ECMFinder's superior performance may be due to the fact that ECMFinder mainly scanned the region surrounding TSSs. Although the true binding sites of E2F1 for this analysis were derived from a single set of ChIP experiments, the observed sensitivity (30–60%) by ECMFinder suggests that many in vivo binding sites for this TF are indeed localized in the regions adjacent to TSSs. Also, the two other prediction methods, the HMR conserved TFBSs and SynoR, appear to be unnecessarily stringent in predicting TF-binding sites without any dramatic increase in selectivity. Also, the limited number of regions searchable by SynoR may have missed many true in vivo binding sites for E2F1. Overall, ECMFinder performed much better than the two other methods in several categories, in particular the prediction of single and groups of two E2F1 motifs (within a 100-bp region) in the regions adjacent to TSSs.
Demonstration I: clustered YY1-binding sites
To demonstrate the feasibility of ECMFinder, we performed two series of motif searches. We chose to identify binding sites for two well-known TFs, YY1 and CTCF, in the genomes of three mammals: human, mouse and cow. The sequence and genome-wide location of the binding motifs of these two TFs have been well characterized through large-scale ChIP-chip or ChIP-seq experiments (13,17,18). YY1-binding sites tend to be located close to the promoter regions of mammalian genes whereas CTCF-binding sites are located in both intergenic and promoter regions. According to recent studies from genomic imprinted domains, clusters of binding sites for these two TFs coincide with the location of ICRs, but these ICRs show no sequence conservation among different species (15). These ICRs may represent a new type of regulatory region, and characterization of these regions is one of the motivations for the current study.
We have used the following criteria to perform a genome-wide search of clustered YY1-binding sites: the input motif for YY1-binding sites was ‘cgCCATntt’ with one allowable mismatch within the bases indicated in lowercase; one cluster was defined as the presence of three YY1 motifs in a 500-bp window; the search was performed within the genomic region spanning 5-kb upstream and downstream of each gene's TSS; and three species (human, mouse and cow) were used to test evolutionary conservation. With these criteria, ECMFinder identified a total of 31 candidate genes that have at least one ECM in all three species (Supplementary Table 1). These ECMs were uploaded to the UCSC Genome Browser as a Custom Track, and the Paternally Expressed Gene 3 (Peg3) locus is shown as a representative locus in Figure 2A (http://genome.ucsc.edu/cgi-bin/hgTracks?db=mm9&hgt.customText=http://jookimlab.lsu.edu/sites/default/files/yy1_data.txt). The 1st intron of mouse Peg3 is known to contain at least 10 YY1-binding sites (14), which were indeed successfully detected by ECMFinder. The thick black bars represent the YY1 ECMs identified within the Peg3's 1st intron (Figure 2A). Similar YY1 ECMs are also found within the 1st introns of human and cow PEG3. Yet, the 1st intron of mammalian Peg3 shows almost no sequence conservation as seen in the graphs derived from PhastCons analysis. This lack of sequence conservation reflects the fact that although each individual YY1 motif is conserved they differ in number and spacing between different mammals.
Figure 2.

Visualization and in vivo confirmation of the clustered YY1-binding sites predicted by ECMFinder. (A) Clusters of YY1-binding sites located within the 1st intron of Peg3 were visualized along with other data using the Custom Track. Each cluster of conserved YY1-binding sites detected by ECMFinder is indicated by a thick black line in the top track. The following tracks are provided from the UCSC genome browser (RefSeq for gene annotations, PhastCons for conservation, RepeatMasker for repeat elements, HMR conserved Transcription Factor Binding Sites for predicted TFBSs). In the human box, the HMR (human, mouse and rat) conserved TFBSs method using PWM matrix failed to predict the presence of the YY1-binding sites due to the low conservation level of this region. However, all three species have clustered YY1-binding sites within the 1st intron of Peg3. (B) YY1–ChIP results of candidate genes. This series of YY1–ChIP analysis were performed to confirm the in vivo binding of YY1 to each locus predicted by ECMFinder. The amplified PCR products from each locus are shown in the following order: the Input (lane 1), the IgG lane with rabbit normal serum (lane 2) and the YY1 Ab lane with YY1 antibody (lane 3). The two previously known YY1-binding sites were used as positive controls (Nr3c1 and Peg3, blue), whereas three YY1-unrelated loci were used as negative controls (H19-ICR, the promoter region of Rcor3, and the exon region of Ppil2, red). We tested seven randomly chosen loci out of the 31 predicted YY1 clustered regions, including Akt1s1, Fiz1, Prkcsh, Psmb5, Rsrc2, Sfrs10 and Sox4.
Besides the Peg3 locus, ECMFinder identified 30 additional loci containing clustered YY1-binding sites. Detailed analyses indicated that over half of these clustered YY1-binding sites are derived from genomic regions that lack any sequence conservation, but that they all have clusters of YY1-binding sites in homologous regions of the three species, as seen in the Peg3 locus. We randomly selected seven out of the 30 predicted loci and performed ChIP assays to confirm in vivo binding of these ECMs to the YY1 protein (Figure 2B). Mouse liver tissues were homogenized, treated with formaldehyde to cross-link and immunoprecipitated with anti-YY1 polyclonal antibodies. The precipitated DNA was amplified by PCR with primer sets targeting the seven chosen loci (primer sequences are available as Supplementary Table 2). Two loci, Peg3 and Nr3c1 (nuclear receptor subfamily 3, group C, member 1), were included as positive controls while one YY1-unrelated imprinted locus (H19-ICR) and two randomly selected regions (promoter region of Rcor3, and exon region of Ppil2) were included as negative controls (14). As expected, six loci (Akt1s1, Fiz1, Prkcsh, Psmb5, Rsrc2 and Sfrs10) showed high levels of enrichment by the YY1 antibody (Figure 2B), indicating that these regions are bound by YY1 in vivo. However, we could not confirm the in vivo binding of YY1 to the remaining locus (Sox4). We repeated analysis of this locus using two other tissues, brain and testis, but we could not detect any enrichment by the YY1-ChIP (Figure 2B). Thus, we concluded that this locus is either a false positive or a very developmental stage-specific binding site. In sum, ECMFinder identified 31 clustered YY1-binding sites that are conserved among mammals, and we show that most of the clustered sites are bona fide in vivo YY1-binding sites.
Demonstration II: clustered CTCF-binding sites
In contrast to YY1, a large fraction of CTCF-binding sites are known to be located in intergenic regions that are characterized by low levels of sequence conservation (13). Since existing programs target mainly ECRs, which tend to be located close to or within genes, we predict that these programs may miss many functionally relevant CTCF-binding sites, but that our new approach using ECMFinder may be more suitable for identifying this type of TFBS. Thus, we performed another series of motif searches with ECMFinder aiming to locate genome-wide clustered CTCF-binding sites.
We used the following criteria for this search: the input motif for CTCF was either ‘CCGCnnGGnGGCAG’ with one allowable mismatch or ‘CCGCnnGGnGG’ with no mismatches allowed; a cluster was defined as three CTCF-binding sites within a 5-kb window; the search area encompasses the –150 to + 150-kb region surrounding each gene's TSS; one to three species (human, mouse and cow) were used to test evolutionary conservation. With these criteria, ECMFinder identified a total of 2604, 706 and 447 CTCF-binding sites in the human and a total of 578, 246 and 142 CTCF-binding sites in the mouse with the conservation test using one species (human or mouse), two species (human–mouse) and three species (human–mouse–cow comparison), respectively. The sensitivity and selectivity by the ECMFinder prediction were above those of the background set in all of the three categories (Table 2, bold). However, the sensitivities of all three categories were very low (below 2%) due to the high level of stringency used for this prediction. On the other hand, much higher levels of selectivity, ranging from 28.84 to 38.10%, were achieved when we compared the predicted set with the CTCF ChIP-seq data sets (Table 2). The CTCF ECMs identified through comparison between two species (human–mouse) were further selected and uploaded to UCSC Custom Track along with the results of large-scale ChIP-chip and ChIP-seq studies for human (http://genome.ucsc.edu/cgi-bin/hgTracks?db=hg18&hgt.customText=http://jookimlab.lsu.edu/sites/default/files/ctcf_data.txt).
Initial inspection of the above uploaded CTCF sites resulted in the following conclusions. First, 38.10% (269/706) of the human and 30.89% (76/246) of the mouse CTCF ECMs identified by ECMFinder are indeed in vivo CTCF-binding sites based on the available ChIP-seq data. To test if the rest of the CTCF ECMs are false positives, we performed individual ChIP experiments on a set of seven randomly selected false-positive loci. Surprisingly, four out of these seven sites were confirmed to be true binding sites. This sample test further indicates that the selectivity (30.89% in the mouse) of the ECMFinder prediction is most likely underestimated. We believe that the actual selectivity value should be higher based on our independent estimate of an actual false-positive fraction in the predicted CTCF ECM set, 43% (three out of seven loci) (Supplementary Table 4). Second, ∼51% of the identified CTCF ECMs in human are indeed localized in the intergenic or intron regions of each gene, which are not conserved among mammalian species (Supplementary Table 3) (20). Third, a number of well-known imprinted loci appear to be associated with clustered CTCF-binding sites: IGF2/H19 domain and DLK1-DIO3 domain. As expected, ECMFinder successfully identified previously known CTCF-binding sites—H19-ICR in the IGF2/H19 domain and MEG3-DMR in the DLK1-DIO3 domain (Figure 3). We have also identified a new conserved cluster of CTCF-binding sites in the region ∼75 kb upstream of DLK1, and several single CTCF-binding sites that are located close to the following imprinted genes: MAGEL2, CDKN1C and GNAS. We have confirmed the in vivo binding of CTCF to DLK1, MAGEL2 and CDKN1C through individual ChIP (Supplementary Table 5).
Figure 3.

Distribution of the identified CTCF ECMs in the human genome. The density of the CTCF ECMs is represented on the UCSC genome graph. All ECMs shown here were confirmed using previously published genome-wide CTCF ChIP-seq data (17) and exact position of each ECM is available as Supplementary Table 3. The blue peak indicates the density of CTCF ECMs identified by ECMFinder. We identified 174 loci with clustered CTCF-binding sites that are conserved between two species (human and mouse). The two imprinted loci with the clustered CTCF-binding sites are indicated by red squares, IGF2/H19 in the chromosome 11 and DLK1-DIO3 in the chromosome 14. Detailed inspection of the clustered CTCF sites identified by ECMFinder is available by browsing the UCSC Custom Track (http://genome.ucsc.edu/cgi-bin/hgTracks?db=hg18&hgt.customText= http://jookimlab.lsu.edu/sites/default/files/ctcf_data.txt).
Among the clustered CTCF-binding sites identified by ECMFinder, we further analyzed one clustered CTCF-binding site that was identified from the DLK1-DIO3 domain in human chromosome 14 (Figures 3 and 4). This particular CTCF ECM, called DLK1-BE (Boundary Element), was highly conserved in terms of cluster size (∼4 kb), number of motifs (3–4), and relative position (69–75 kb upstream from the DLK1's TSS) among the three species tested (Figure 4A). In addition, genome-wide ChIP-seq and ChIP-chip data also confirmed in vivo binding of CTCF to the human region of this clustered CTCF sites (first and second tracks in Figure 4A). The lack of obvious spikes in the PhastCons mammal conservation graph shows that overall sequence conservation of this cluster of CTCF-binding sites is very low (bottom of Figure 4A). Consistently, sequence alignments of the regions surrounding three CTCF-binding sites also indicate no obvious cross-species conservation beyond the CTCF-binding sites (sequence alignment in Figure 4A). The human region of this cluster of CTCF-binding sites has an additional CTCF site in the 5′-side, named CTCF site #0. Interestingly, one particular CTCF site (CTCF site #1 in Figure 4C) displays unusually high levels of sequence conservation up to the marsupial lineage with only one base difference (A->C) in the following three species: mouse, rat and opossum.
To further characterize this clustered CTCF site, we performed another ChIP experiment using mouse liver tissues derived from hybrid mice obtained from the interspecific crossing of M. musculus and M. spretus. This hybrid system has been previously used to test allele-specific binding of YY1 to several imprinted domains. ChIP experiments targeting the three CTCF sites indeed confirmed in vivo binding of CTCF to sites #1 and #2, but not to site #3 (Figure 4B). We included two positive controls (Gtl2-DMR and H19-ICR) as well as one negative control (Dlk1-3′DMR) for this analysis. The enrichment levels at site #1 were much higher than those of site #2. We also tested whether the CTCF binding to the site #1 is allele specific by digesting the immunoprecipitated DNA with the restriction enzyme PvuII. In this scheme, only the paternal allele is digested by the PvuII enzyme due to the presence of a sequence polymorphism between two parental species. According to the results of our repeated ChIP trials, the CTCF binding to these two sites, in particular #1, is biallelic: in three out of four independent trials the CTCF antibody precipitated an equal amount of the two alleles’ DNA (Figure 4D). This suggests that CTCF binds to both alleles of this CTCF site. Within imprinted domains, CTCF is known to bind to CpG islands in an allele-specific manner, and DNA methylation usually blocks the binding of CTCF to its target sites (20,21). Therefore, we also tested the DNA methylation status of the 1-kb region surrounding CTCF site #1 (Figure 4E). According to the results from bisulfite sequencing, neither allele is methylated in this region, indicating that this region is not a differentially methylated region (DMR). This result is consistent with the initial observation that CTCF binds to both alleles of this region. Since this CTCF site is located outside of the Dlk1-Dio3 domain, and well conserved among all the species of mammals, we predict that this CTCF site may be a boundary element demarcating this imprinted domain. In conclusion, ECMFinder identified many clustered CTCF sites, and approximately half of these predicted sites are likely genuine in vivo binding sites for CTCF.
DISCUSSION
The current study presented a new bioinformatics tool (ECMFinder) that can be used to identify functionally relevant TFBSs. This approach is based on the assumption that any functionally relevant TFBS may have some level of flexibility in terms of its number, order and relative distance to nearby associated genes. To test this idea, ECMFinder has utilized gene association information to test the evolutionary conservation of potential TFBS. With this program, we successfully identified many YY1- and CTCF-binding sites, most of which were found to be genuine in vivo binding sites. The two demonstrations presented in this study suggest that ECMFinder will be a useful resource for studying regulatory biology in the near future.
ECMFinder has the following advantages compared to existing approaches. First, ECMFinder performs unrestricted searches for potential TFBSs. At the same time, ECMFinder utilizes gene association and evolutionary conservation information to filter out the vast majority of false-positive results. These two ideas have proven to be effective in identifying many functionally relevant TFBSs based on the results of YY1- and CTCF-binding site studies (Figures 2 and 3). As expected, a large fraction of the identified YY1 and CTCF sites are also found in nonconserved and/or intergenic regions of mammalian genomes, which are usually ignored by existing programs. Yet, many of these sites are actual in vivo binding sites for both proteins. Second, since ECMFinder uses gene association information, an identified TFBS is tied to its nearby gene(s). This feature of ECMFinder is very useful for merging its genome-wide TFBS prediction data sets with other existing genomic data, such as microarray-based expression, ChIP-chip and ChIP-seq data. For instance, as shown in Figure 4, the existing genome-wide ChIP-chip and ChIP-seq data of CTCF can be readily compared with the CTCF-binding site prediction results derived from ECMFinder. This will eventually allow a user to decide quickly if a potential TFBS is a genuine in vivo binding site. This has been one of motivations for using the Custom Track-compatible GFF format as the default output of ECMFinder.
Based on results from these two examples, ECMFinder also has the following problems that need to be improved in the future. First, ECMFinder uses gene association information as a main filtering tool. Thus, if one of the genome sequences used for ECMFinder is not well annotated, this could easily filter out many functionally relevant TFBSs from its original prediction set. Among the species we used for the current version (human, mouse and cow), the annotation of the cow genome sequence may not be as accurate and complete as the two others based on the number of annotated genes in the database (17861, 17782 and 8587 genes in human, mouse and cow, respectively). As such, we estimate that the real numbers of clusters of YY1- and CTCF-binding sites may be greater than the actual numbers presented in this study. Second, ECMFinder's search method is based on pattern matching rather than PWMs. Thus, TFBS search by ECMFinder is probably more rigid and stringent than other existing programs. On the other hand, only ∼15% TFs have reliable PWM profiles. Therefore, using ECMFinder with a pattern-matching approach may be a necessary compromise at the current stage of regulatory biology. Also, more annotated genome sequences, which are on the horizon, will add more filtering power to the evolutionary conservation test used in ECMFinder. In that situation, ECMFinder could lower the stringency of the pattern-matching criteria by allowing more leniency in its input motifs.
One of the identified CTCF sites displays unusual high levels of sequence conservation among different mammals, even in marsupials (CTCF site #1 in DLK1-BE, Figure 4C). This conservation predicts that this single CTCF-binding site should play a significant role for the nearby genes in the DLK1-DIO3 imprinted domain. Since CTCF is known to act as an enhancer-blocker (22,23), this CTCF-binding site might be a boundary for demarcating this imprinted domain from its neighboring regions. However, it is important to note that this CTCF site is also found in marsupials, where the DLK1-DIO3 domain is not imprinted (24). Thus, the enhancer-blocker activity associated with this CTCF site may not play a direct role in determining or maintaining the genomic imprinting of this domain. Nevertheless, it will be interesting to test this possibility in the future. Since we have already been working on imprinted domains at the beginning of this study, the identification of this particular CTCF site should not be regarded as an automatic discovery using ECMFinder, but as a serendipitous discovery involving manual inspections. Regardless, this represents the ideal situation where a single conserved TFBS could be identified with high levels of confidence and biological significance. Although similar analyses are not immediately possible with the current stage of bioinformatics, more available genome sequences will eventually help investigators identify similar TFBSs as demonstrated in this particular CTCF site (Figure 4C).
In summary, ECMFinder appears to provide several advantages to users. First, users can search any motif of interest on a genome-wide scale with improved sensitivity and selectivity over existing methods. Second, the results from ECMFinder can be visualized and analyzed alongside other data in the UCSC genome browser.
SUPPLEMENTARY DATA
Supplementary Data are available at NAR Online.
FUNDING
The BK21 fellowship from the Department of Education, South Korea (to K.K.); and National Institutes of Health R01 GM66225 (to J.K.). Funding for open access charge: National Institutes of Health R01 GM66225.
Conflict of interest statement. None declared.
Supplementary Material
ACKNOWLEDGEMENTS
We thank Dr Ivan Ovcharenko for critical reading of our manuscript. We also thank Jennifer Huang for her excellent editing.
REFERENCES
- 1.Ludwig MZ. Functional evolution of noncoding DNA. Curr. Opin. Genet. Dev. 2002;12:634–639. doi: 10.1016/s0959-437x(02)00355-6. [DOI] [PubMed] [Google Scholar]
- 2.Bulyk ML. Computational prediction of transcription-factor binding site locations. Genome Biol. 2003;5:201. doi: 10.1186/gb-2003-5-1-201. [DOI] [PMC free article] [PubMed] [Google Scholar]
- 3.GuhaThakurta D. Computational identification of transcriptional regulatory elements in DNA sequence. Nucleic Acids Res. 2006;34:3585–3598. doi: 10.1093/nar/gkl372. [DOI] [PMC free article] [PubMed] [Google Scholar]
- 4.Visel A, Bristow J, Pennacchio LA. Enhancer identification through comparative genomics. Semin. Cell Dev. Biol. 2007;18:140–152. doi: 10.1016/j.semcdb.2006.12.014. [DOI] [PMC free article] [PubMed] [Google Scholar]
- 5.Blanchette M, Bataille AR, Chen X, Poitras C, Laganière J, Lefèbvre C, Deblois G, Giguère V, Ferretti V, Bergeron D, et al. Genome-wide computational prediction of transcriptional regulatory modules reveals new insights into human gene expression. Genome Res. 2006;16:656–668. doi: 10.1101/gr.4866006. [DOI] [PMC free article] [PubMed] [Google Scholar]
- 6.Blanchette M, Tompa M. Discovery of regulatory elements by a computational method for phylogenetic footprinting. Genome Res. 2002;12:739–748. doi: 10.1101/gr.6902. [DOI] [PMC free article] [PubMed] [Google Scholar]
- 7.Boffelli D, Nobrega MA, Rubin EM. Comparative genomics at the vertebrate extremes. Nat. Rev. Genet. 2004;5:456–465. doi: 10.1038/nrg1350. [DOI] [PubMed] [Google Scholar]
- 8.Wasserman WW, Sandelin A. Applied bioinformatics for the identification of regulatory elements. Nat. Rev. Genet. 2004;5:276–287. doi: 10.1038/nrg1315. [DOI] [PubMed] [Google Scholar]
- 9.Ovcharenko I, Loots GG, Nobrega MA, Hardison RC, Miller W, Stubbs L. Evolution and functional classification of vertebrate gene deserts. Genome Res. 2005;15:137–145. doi: 10.1101/gr.3015505. [DOI] [PMC free article] [PubMed] [Google Scholar]
- 10.Prakash A, Tompa M. Discovery of regulatory elements in vertebrates through comparative genomics. Nat. Biotechnol. 2005;23:1249–1256. doi: 10.1038/nbt1140. [DOI] [PubMed] [Google Scholar]
- 11.Loots G, Ovcharenko I. ECRbase: database of evolutionary conserved regions, promoters, and transcription factor binding sites in vertebrate genomes. Bioinformatics. 2007;23:122–124. doi: 10.1093/bioinformatics/btl546. [DOI] [PubMed] [Google Scholar]
- 12.ENCODE Project Consortium. Identification and analysis of functional elements in 1% of the human genome by the ENCODE pilot project. Nature. 2007;447:799–816. doi: 10.1038/nature05874. [DOI] [PMC free article] [PubMed] [Google Scholar]
- 13.Kim TH, Abdullaev ZK, Smith AD, Ching KA, Loukinov DI, Green RD, Zhang MQ, Lobanenkov VV, Ren B. Analysis of the vertebrate insulator protein CTCF-binding sites in the human genome. Cell. 2007;128:1231–1245. doi: 10.1016/j.cell.2006.12.048. [DOI] [PMC free article] [PubMed] [Google Scholar]
- 14.Kim JD, Hinz AK, Bergmann A, Huang JM, Ovcharenko I, Stubbs L, Kim J. Identification of clustered YY1 binding sites in imprinting control regions. Genome Res. 2006;16:901–911. doi: 10.1101/gr.5091406. [DOI] [PMC free article] [PubMed] [Google Scholar]
- 15.Kim J. Multiple YY1 and CTCF binding sites in imprinting control regions. Epigenetics. 2008;3:115–118. doi: 10.4161/epi.3.3.6176. [DOI] [PubMed] [Google Scholar]
- 16.Chen X, Xu H, Yuan P, Fang F, Huss M, Vega VB, Wong E, Orlov YL, Zhang W, Jiang J, et al. Integration of external signaling pathways with the core transcriptional network in embryonic stem cells. Cell. 2008;133:1106–1117. doi: 10.1016/j.cell.2008.04.043. [DOI] [PubMed] [Google Scholar]
- 17.Barski A, Cuddapah S, Cui K, Roh TY, Schones DE, Wang Z, Wei G, Chepelev I, Zhao K. High-resolution profiling of histone methylations in the human genome. Cell. 2007;129:823–837. doi: 10.1016/j.cell.2007.05.009. [DOI] [PubMed] [Google Scholar]
- 18.Renda M, Baglivo I, Burgess-Beusse B, Esposito S, Fattorusso R, Felsenfeld G, Pedone PV. Critical DNA binding interactions of the insulator protein CTCF: a small number of zinc fingers mediate strong binding, and a single finger-DNA interaction controls binding at imprinted loci. J. Biol. Chem. 2007;282:33336–33345. doi: 10.1074/jbc.M706213200. [DOI] [PubMed] [Google Scholar]
- 19.Miller W, Rosenbloom K, Hardison RC, Hou M, Taylor J, Raney B, Burhans R, King DC, Baertsch R, Blankenberg D, et al. 28-way vertebrate alignment and conservation track in the UCSC Genome Browser. Genome Res. 2007;17:1797–1808. doi: 10.1101/gr.6761107. [DOI] [PMC free article] [PubMed] [Google Scholar]
- 20.Bell AC, Felsenfeld G. Methylation of a CTCF-dependent boundary controls imprinted expression of the Igf2 gene. Nature. 2000;405:482–485. doi: 10.1038/35013100. [DOI] [PubMed] [Google Scholar]
- 21.Hark AT, Schoenherr CJ, Katz DJ, Ingram RS, Levorse JM, Tilghman SM. CTCF mediates methylation-sensitive enhancer-blocking activity at the H19/Igf2 locus. Nature. 2000;405:486–489. doi: 10.1038/35013106. [DOI] [PubMed] [Google Scholar]
- 22.Bell AC, West AG, Felsenfeld G. The protein CTCF is required for the enhancer blocking activity of vertebrate insulators. Cell. 1999;98:387–396. doi: 10.1016/s0092-8674(00)81967-4. [DOI] [PubMed] [Google Scholar]
- 23.Farrell CM, West AG, Felsenfeld G. Conserved CTCF insulator elements flank the mouse and human beta-globin loci. Mol. Cell Biol. 2002;22:3820–3831. doi: 10.1128/MCB.22.11.3820-3831.2002. [DOI] [PMC free article] [PubMed] [Google Scholar]
- 24.Edwards CA, Mungall AJ, Matthews L, Ryder E, Gray DJ, Pask AJ, Shaw G, Graves JA, Rogers J, SAVOIR consortium et al. The evolution of the DLK1-DIO3 imprinted domain in mammals. PLoS Biol. 2008;6:e135. doi: 10.1371/journal.pbio.0060135. [DOI] [PMC free article] [PubMed] [Google Scholar]
Associated Data
This section collects any data citations, data availability statements, or supplementary materials included in this article.