

Abstract
FoxO1 plays an important role in mediating the effect of insulin on hepatic metabolism. Increased FoxO1 activity is associated with reduced ability of insulin to regulate hepatic glucose production. However, the underlying mechanism and physiology remain unknown. We studied the effect of FoxO1 on the ability of insulin to regulate hepatic metabolism in normal vs. insulin-resistant liver under fed and fasting conditions. FoxO1 gain of function, as a result of adenovirus-mediated or transgenic expression, augmented hepatic gluconeogenesis, accompanied by decreased glycogen content and increased fat deposition in liver. Mice with excessive FoxO1 activity exhibited impaired glucose tolerance. Conversely, FoxO1 loss of function, caused by hepatic production of its dominant-negative variant, suppressed hepatic gluconeogenesis, resulting in enhanced glucose disposal and improved insulin sensitivity in db/db mice. FoxO1 expression becomes deregulated, culminating in increased nuclear localization and accounting for its increased transcription activity in livers of both high fat-induced obese mice and diabetic db/db mice. Increased FoxO1 activity resulted in up-regulation of hepatic peroxisome proliferator-activated receptor-γ coactivator-1β, fatty acid synthase, and acetyl CoA carboxylase expression, accounting for increased hepatic fat infiltration. These data indicate that hepatic FoxO1 deregulation impairs the ability of insulin to regulate hepatic metabolism, contributing to the development of hepatic steatosis and abnormal metabolism in diabetes.
Hepatic insulin signaling plays a pivotal role in gluconeogenesis and glucose metabolism. In response to postprandial insulin secretion, hepatic gluconeogenic activity is suppressed to limit glucose production, whereas in response to reduced insulin action during fasting, hepatic gluconeogenesis is stimulated, resulting in increased glucose output from liver (1). Such a reciprocal mechanism of hepatic insulin action is crucial for rapid adaptation of liver to metabolic shift between fed and fasting states to maintain blood glucose levels within the physiological range. When hepatic insulin signaling goes awry, gluconeogenesis becomes unrestrained, resulting in excessive hepatic glucose production and contributing to fasting hyperglycemia in diabetes (2–4).
Forkhead box (Fox) O1, a forkhead transcript factor that is expressed abundantly in the liver, is thought to be a major target of insulin signaling. FoxO1 belongs to a nuclear protein subfamily that includes FoxO3a, FoxO4, FoxO6 in mammals and its ortholog DAF-16 in Caenorhabditis elegans (5–11). These proteins, characterized by a highly conserved central DNA binding domain and a carboxyl trans-activation domain, play important roles in mediating the effect of insulin or IGF on metabolism, growth, survival, and differentiation of cells (12). Nakae et al. (13) show that transgenic expression of a FoxO1 constitutively active allele is associated with glucose intolerance in mice. Functional inhibition of FoxO1, caused by hepatic expression of its dominant-negative allele, ameliorates fasting hyperglycemia in diabetic db/db mice (14). FoxO1 haploinsufficiency restores insulin sensitivity in insulin receptor substrate (IRS)-2-deficient diabetic mice (15). Hepatic FoxO1 expression along with its nuclear distribution is increased in insulin-resistant livers (14). Samuel et al. (16) show that antisense oligonucleotide-mediated inhibition of FoxO1 activity improves hepatic and peripheral insulin action in high-fat diet-induced obese mice. These data are indicative of an association between increased FoxO1 activity and impaired ability of insulin to regulate hepatic glucose metabolism, contributing to abnormal metabolism in diabetes. Nevertheless, the underlying mechanism and physiology is not fully understood.
To study the effect of FoxO1 on the ability of insulin to regulate hepatic metabolism, we used two independent but complementary approaches, gain vs. loss of function, to augment FoxO1 activity in normal liver and conversely to inhibit FoxO1 function in diabetic liver using adenoviral-mediated gene transfer and transgenic approaches. Elevated hepatic FoxO1 production resulted in augmented glucose production and impaired glucose tolerance, accompanied by decreased glycogen content and increased fat deposition in liver. Conversely, functional inhibition of FoxO1 in insulin-resistant liver resulted in enhanced glucose tolerance and improved insulin sensitivity, partly due to the reduction of hyperglycemia and hyperinsulinemia in db/db mice. Hepatic FoxO1 expression became deregulated, as manifested by increased nuclear localization in liver of high-fat-induced obese mice, coinciding with glucose intolerance and hyperinsulinemia. Furthermore, excessive FoxO1 activity resulted in up-regulation of peroxisome proliferator-activated receptor-γ coactivator (PGC)-1β, accounting in part for hepatic fat infiltration. These data reveal a potential link between FoxO1 deregulation and development of hepatic steatosis and impaired metabolism in diabetes. In normal mice, hepatic FoxO1 production and nuclear localization were also increased in response to fasting, accounting for its increased transcriptional activity in liver. This effect helps prime the liver for augmented glucose production to maintain blood glucose levels within the physiological range.
Materials and Methods
Adenoviral vectors
The recombinant adenoviral vectors used were as follows; Ad-CMV-FoxO1-wt expressing wild-type FoxO1 (1.2 × 10¹¹ pfu/ml), Ad-CMV-FoxO1-Δ256 expressing a dominant-negative FoxO1 mutant (1.6 × 10¹¹ pfu/ml), and Ad-RSV-LacZ expressing the control β-gal gene (1.9 × 10¹¹ pfu/ml), respectively (14, 17). All adenoviral vectors were produced in HEK293 cells and purified as described (14).
Animal studies
C57BL/6J, db/db, and heterozygous db/+ mice at 6 wk of age were purchased from the Jackson laboratory (Bar Harbor, ME). CD-1 mice were purchased from Charles River Laboratory (Wilmington, MA). Animals were fed standard rodent chow and water ad libitum in sterile cages with a 12-h light, 12-h dark cycle. To induce obesity in C57BL/6J mice, animals were fed a high-fat diet (fat content, > 60 kcal%, D12492; Research Diets, New Brunswick, NJ) for 2 months. For vector administration, animals were injected via tail vein with 200 μl of adenovirus diluted in PBS buffer as described (18). For glucose tolerance test, animals were fasted for 5 h and injected ip with 50% dextrose solution (Abbott Laboratories, Chicago, IL) at the dose of 3 g/kg body weight, as described (18). Blood glucose levels were measured using Glucometer Elite (Bayer, Indianapolis, IN). Area under the curve (AUC) was calculated using the KaleidaGraph software (Synergy Software, Reading, PA). For blood chemistry measurement, animals were fasted overnight (16 h), and blood was collected from tail vein into capillary tubes pre-coated with potassium-EDTA (Sarstedt, Nümbrecht, Germany) for plasma preparation. Fasting plasma insulin levels were determined using the ultrasensitive murine insulin ELISA kit (ALPCO, Windham, NH). To obtain liver tissue for protein and mRNA analysis, animals were killed after a 16-h fast. All procedures were approved by the Institutional Animal Care and Usage Committee of Children’s Hospital of Pittsburgh (protocol 41–04).
Insulin tolerance test
Mice were injected ip with regular human insulin (Novolin R; Novo Nordisk Pharmaceuticals Inc., Princeton, NJ) at the dose of 0.5 U/kg body weight. Blood glucose levels were measured before and at different times after insulin infusion. After normalizing to blood glucose levels before insulin injection, changes in blood glucose levels in different groups of mice were plotted as a function of time.
Aspartate aminotransferase (AST) and alanine aminotransferase (ALT) measurement
Aliquots (30 μl) of blood were collected from the tail vein of mice after a 16-h fast. Fasting plasma levels of AST and ALT were determined using the AST and ALT assay kits (Thermo Electron, Melbourne, Australia).
Hyperinsulinemic/euglycemic clamp studies
Hyperinsulinemic/euglycemic clamp studies were performed on mice after adenoviral-mediated FoxO1 expression in the liver. Male CD1 mice (Charles River Laboratory) at 15 wk of age were stratified by body weight and randomly assigned to three groups (mean body weight 33.7 ± 2.5 g), which were treated with 1.5 × 10¹¹ pfu/kg of FoxO1 vector, an equivalent dose of lacZ vector or PBS buffer as described above. Two days after vector administration, animals were anesthetized and cannulated by inserting a catheter into the right external jugular vein to the level of the right atrium of the heart. After 1 d of recovery, insulin (porcine insulin; Sigma, St. Louis, MO) at a constant rate (18 mU/kg·min) and 10% glucose solution at variable rates (adjusted to maintain euglycemia) was infused through the indwelling catheter into mice for 120 min while animals remained awake and unrestrained in isolated cages. Blood was collected from the tail vein at 10-min intervals for determination of blood glucose levels. To determine hepatic glucose flux, 3-[3H]glucose (specific activity 20 Ci/mmol; PerkinElmer Life Science, Boston, MA) was infused through the catheter at a fixed rate (0.1 μCi/ml, after an initial bolus injection of 10 μCi) during the clamping. Aliquots (40 μl) of blood were sampled from tail vein at 40, 60, 80, and 90 min for determination of plasma [3H]glucose and 3H2O concentrations, following the procedure described by Rossetti et al. (19). Under steady-state conditions, the rate of glucose disappearance is equivalent to that of glucose appearance, which is defined as the ratio between the 3-[3H]glucose infusion rate (dpm per milliliter) and plasma 3-[3H]glucose-specific activity (dpm per milligram). The difference between glucose appearance and glucose infusion rate (GIR) yields the rate of endogenous glucose production (19).
RNA isolation and real-time RT-PCR
RNA isolation from tissue was performed using the RNeasy minikit (QIAGEN, Valencia, CA). Real-time quantitative RT-PCR was used for quantifying mRNA concentrations using the Roche LightCycler-RNA amplification kit (Roche Diagnostics, Indianapolis, IN), as described (20). The primers used in real-time RT-PCR assay for phosphoenolpyruvate carboxykinase (PEPCK), glucose-6 phosphatase (G6Pase), and β-actin mRNA have been described (20). Other primers were as follows: mouse sterol regulatory element binding protein (SREBP)-1c forward, 5′-GACGAGCTGGCCTTCGGTGA-3′ (corresponding to SREBP1-c mRNA, 4–23 nt) and reverse reaction, 5′-GCTTCCAGAGAGGAGGCCAG-3′ (SREBP1-c mRNA, 229–248 nt); acetyl CoA carboxylase (ACC) forward, 5′-TGGACAACGCCTTCACGCCAC-3′ (ACC mRNA, 2957–2977 nt) and ACC reverse, 5′-GGGTGAACTCTCTGAACATA-3′ (ACC mRNA, 3210–3229 nt); fatty acid synthase (FAS) forward, 5′-TAGCCGGTATGTCGGGGAAG-3′ (FAS mRNA, 17–36 nt) and reverse, 5′-ACAATTGCTTCATAGCTGAC-3′ (FAS mRNA, 253–272 nt). All primers were obtained commercially from Integrated DNA Technologies, Inc. (Coralville, IA).
Quantification of hepatic glycogen content
Hepatic glycogen content was determined as previously described (14). Mice were killed after 16 h fasting. Aliquots (200 mg) of liver tissue were homogenized in 400 μl of 0.03 N HCl, followed by centrifugation at 12,000 rpm for 2 min. Aliquots (100 μl) of the supernatant were mixed with 400 μl of 1.25 N HCl and incubated at 95 C for 1 h for the determination of glycogen and residual glucose concentrations in the liver. Additional aliquots (100 μl) were mixed with 400 μl of 1.25 N HCl and incubated at room temperature for measurement of residual glucose levels. Glucose concentrations were determined using the glucose oxidase reagent (Sigma) and with the rabbit liver glycogen type III as the standard. After subtracting the residual levels of glucose in the liver, hepatic glycogen content was calculated as described (14).
Quantification of hepatic lipid content
Forty milligrams of liver tissue was homogenized in 800 μl of HPLC-grade acetone in 2-ml microtubes. After incubation with agitation at room temperature overnight, aliquots (50 μl) of acetone-extract lipid suspension were used for the determination of triglyceride concentrations using the Infinity triglyceride reagent (Thermo Electron). Hepatic lipid content was defined as mg of triglyceride per gram of total liver proteins.
Liver histology
Liver tissue from euthanized animals was fixed in 10% phosphate-buffered formalin and embedded in paraffin for hematoxylin and eosin (H&E) staining, or alternatively placed in Histoprep tissue embedding media and snap frozen for fat staining with Oil red O as described (21).
Immunohistochemistry
Liver tissue was embedded with Histoprep tissue embedding media (Fisher Scientific, Fair Lawn, NJ). Frozen sections were cut (8 μm) and subjected to immunohistochemistry using rabbit anti-Foxo1 antibody (dilution at 1:1500). The second antibody was Cy3-conjugated goat antirabbit IgG (dilution 1:500, Jackson ImmunoResearch Laboratories, West Grove, PA). The nuclei of hepatocytes were visualized by staining with TO-PRO-3 dye (Molecular Probes Inc., Eugene, OR). Specimens were examined under a laser-scanning confocal microscope (Nikon E800; Nikon Corp., Tokyo, Japan).
Western blot analysis
Aliquots (40 mg) of liver tissue were homogenized in 400 μl ice-cold CER-I solution (Pierce, Rockford, IL) supplemented with 40 μl of protease inhibitor cocktail (Pierce). Nuclear fractions were separated from cytoplasm and aliquots of 20 μg of nuclear or cytoplasmic proteins were resolved on 4–20% SDS-polyacrylamide gels and subjected to immunoblot analysis using antibody against FoxO1, SREBP-1c, PGC-1β, glucokinase (GK), and actin proteins as previously described (14). The intensity of protein bands was quantified by densitometry using the NIH Image software (National Institutes of Health, Bethesda, MD) as described (14). Polyclonal rabbit anti-FoxO1 antibody was developed in our laboratory by immunizing rabbits with the glutathione-S-transferase-tagged human FoxO1 protein (Genemed Synthesis Inc., San Francisco, CA). Rabbit anti-GK antibody was developed in our laboratory by immunizing rabbits with 6 × His-tagged rat GK protein (Rockland Immunochemicals, Boyertown, PA). Rabbit anti-PGC-1 β antibody was provided by the laboratory of Dr. Spiegelman. Antiactin antibody (catalog no. sc-1615) and anti-SREBP-1 antibody (catalog no. sc-8984) were from Santa Cruz Biotechnology (Santa Cruz, CA). This latter antibody cross-reacts with SREBP-1a.
Statistics
Statistical analyses of data were performed by ANOVA using Stat-View software (Abacus Concepts, Inc., Berkeley, CA). Pair-wise comparisons were performed to study the significance between different conditions. Data were expressed as the mean ± SEM. P < 0.05 was considered statistically significant.
Results
Effect of hepatic FoxO1 production on glucose metabolism in normal mice
To study the effect of elevated FoxO1 production on blood glucose metabolism, we delivered FoxO1 cDNA to liver of adult mice using adenoviral-mediated gene transfer. This approach has been shown to result in transgene expression predominantly in liver with little transduction of cells in extrahepatic tissue (22). In addition, we used a predefined moderate dose of FoxO1 vector to elevate hepatic FoxO1 production to levels that are normally detected in diabetic db/db mice as previously described (14). CD1 mice were stratified by body weight and randomly assigned to three groups (12 wk old; mean body weight 31.3 ± 1.4 g), which were respectively treated with 1.5 × 10¹¹ pfu/kg of FoxO1 vector, an equivalent dose of lacZ vector or vector buffer, as described (14). Blood glucose and plasma insulin levels were determined after a 16-h fast. When compared with mock- and control vector-treated mice, fasting blood glucose levels in FoxO1 vector-treated mice remained unchanged (Fig. 1A). In contrast, fasting plasma insulin levels were significantly elevated in FoxO1 vector-treated mice (Fig. 1B).
Fig. 1.

Effect of FoxO1 gain of function on glucose metabolism in normal mice. A, Fasting blood glucose levels. B, Fasting plasma insulin levels. C, Blood glucose profiles during GTT. D, AUC of blood glucose profiles during GTT. Blood glucose and plasma levels were determined after 16-h fasting on d 4 after vector administration. Data in C and D were obtained on d 5. *, P < 0.05 vs. controls. NS, Not significant.
To assess the impact of elevated hepatic FoxO1 production on whole-body glucose disposal rates, glucose tolerance tests were performed 4 d after vector administration. In response to ip glucose infusion (3 g/kg body weight), blood glucose levels were markedly elevated in different groups of mice, but elevated blood glucose levels in mock- and control vector-treated mice returned to normal within 90 min (Fig. 1C). In contrast, FoxO1 vector-treated mice displayed impaired glucose profiles, and their elevated blood glucose levels did not return to prechallenge levels, even after 2 h of glucose infusion. These results were corroborated by quantitative analysis of the AUC of blood glucose profiles during glucose tolerance tests. As shown in Fig. 1D, a 2-fold higher AUC value of blood glucose profiles was detected in FoxO1 vector-treated mice, in comparison with mock- and control vector-treated animals. Together these data indicate that FoxO1 gain of function in liver is associated with abnormal glucose metabolism in mice.
To define the molecular mechanism underlying FoxO1-mediated impairment in blood glucose metabolism, the relative levels of two gluconeogenic genes, PEPCK and G6Pase, were determined and compared between different groups of mice under fasting conditions. Elevated hepatic FoxO1 production resulted in significant induction in G6Pase (Fig. 2A) and PEPCK (Fig. 2B) expression, which correlated with increased FoxO1 expression in liver (Fig. 2C). In contrast, the relative expression levels of GK, an enzyme involved in glycolysis in the liver, remained unchanged in response to hepatic FoxO1 production (Fig. 2D). Similar results have been reported by Altomonte et al. (14), who show that hepatic production of FoxO1-Δ256, a FoxO1 dominant-negative allele, did not alter GK expression under fasting conditions in mice.
Fig. 2.

Effect of FoxO1 gain of function on hepatic gluconeogenic expression. Mice were killed after 16-h fasting 6 d after hepatic FoxO1 expression. Liver tissue was collected for preparation of total hepatic RNA. The relative hepatic mRNA levels of G6Pase (A) and PEPCK (B) were determined by real-time RT-PCR using β-actin mRNA as control. Hepatic nuclear proteins were subjected to immunoblot analysis using anti-FoxO1, anti-GK, and antiactin antibodies, respectively. The relative levels of hepatic FoxO1 protein were compared between FoxO1 vector- vs. control vector-treated mice (C). Representative immunoblots were shown in D. *, P < 0.05.
Impact of hepatic FoxO1 production on hepatic glycogen metabolism
To examine the effect of elevated FoxO1 production on hepatic glycogen metabolism, animals were killed after 1 wk of hepatic FoxO1 production for the determination of hepatic glycogen content. When compared with mock- or control vector-treated mice, relatively lower hepatic glycogen content was detected in FoxO1 vector-treated mice (Fig. 3A), which was inversely correlated with increased hepatic glucose production in response to elevated FoxO1 production in liver.
Fig. 3.
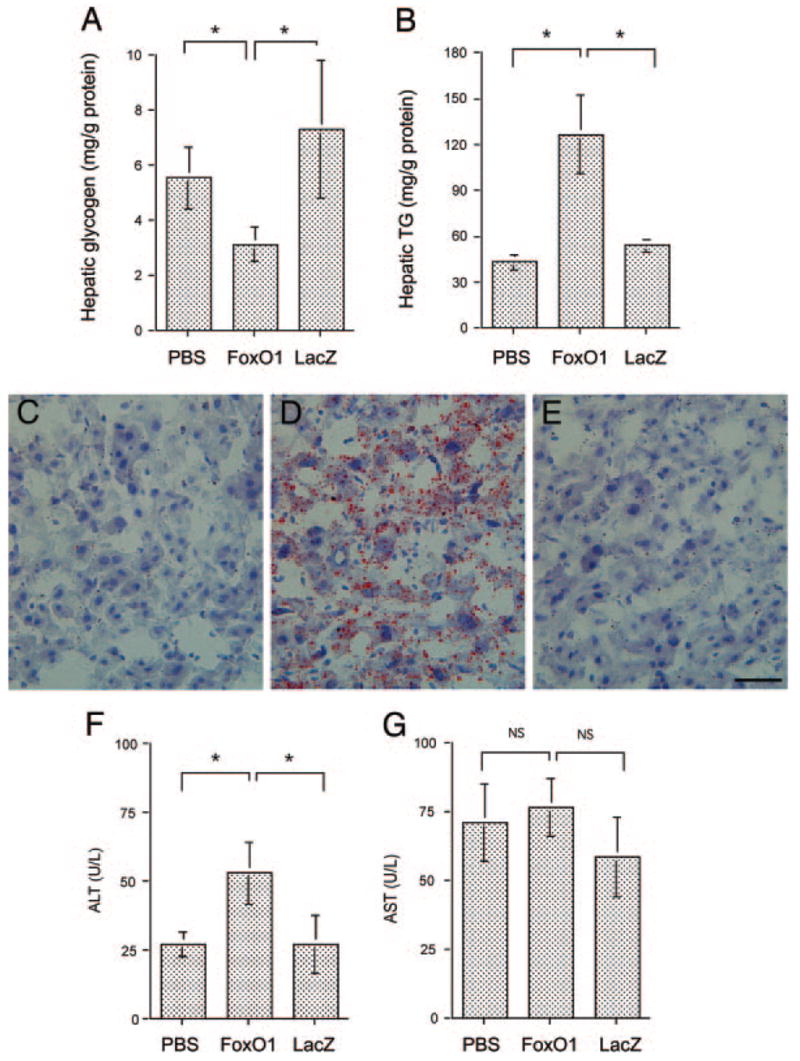
Hepatic glycogen and lipid content. Hepatic glycogen (A) and lipid (B) contents, defined as milligram of glycogen or triglyceride per gram of total liver protein, were determined as described in Materials and Methods. Sections of liver of mock- (C), FoxO1 vector- (D), and LacZ (E) vector-treated mice were examined histologically after Oil red O staining. Fasting plasma ALT (F) and AST (G) levels were determined at d 6 after vector administration. *, P < 0.01. Bar, 100 μm.
Effect of elevated hepatic FoxO1 production on hepatic fat content
To investigate the metabolic consequence associated with elevated hepatic FoxO1 production, liver tissue from animals that had been killed was used for the determination of hepatic lipid levels. Mice with elevated FoxO1 production exhibited significantly higher levels of intrahepatic TG content, when compared with controls (Fig. 3B). These results were confirmed by liver histology after staining with H&E and Oil red O, respectively. H&E staining did not reveal any morphological lesions in the liver of mice treated with FoxO1 or control vectors, which is consistent with our previous observations (14). However, staining with Oil red O revealed significantly higher levels of lipid droplets dispersed in the liver of FoxO1 vector-treated mice (Fig. 3, C–E).
To rule out the possibility that increased fat deposition in FoxO1 vector-treated mice was due to adenovirus-mediated hepatoxicity, we determined fasting plasma levels of AST and ALT 1 wk after vector administration. As shown in Fig. 3G, plasma AST levels in FoxO1 vector-treated mice were 76 ± 10 U/liter, which were not significantly different from mock-treated (71 ± 14 U/liter) and LacZ vector-treated control mice (59 ± 15 U/liter). Although plasma ALT levels were elevated in FoxO1 vector-treated mice (52 ± 11 U/liter), in comparison with mock-treated (27 ± 5 U/liter) and control vector-treated (28 ± 11) mice (Fig. 3F), these values were with the normal range. In a similar study (14), we showed that hepatic FoxO1-Δ256 production did not cause hepatotoxicity in mice.
To account for increased intrahepatic fat deposition associated with elevated FoxO1 production in the liver, we determined the expression levels of genes involved in lipogenesis. Elevated FoxO1 production significantly increased FAS (Fig. 4A) and ACC (Fig. 4B) expression. In addition, we studied the expression levels of SREBP-1c, a nuclear transcription factor that plays a key role in mediating the stimulatory effect of insulin on lipogenic gene expression (23,24). Hepatic SREBP-1c mRNA (Fig. 4C) and SREBP-1c protein (Fig. 4D) levels remained unchanged in FoxO1 vector-treated mice. Lin et al. (25) showed that PGC-1β is a coactivator of SREBP-1c and is capable of binding and augmenting SREBP-1c transcriptional activity in stimulating lipogenesis in liver. We studied the effect of hepatic FoxO1 production on PGC-1β expression in liver. As shown in Fig. 4E, we detected a significant elevation in hepatic PGC-1β expression in liver of FoxO1 vector-treated mice. These results indicate that hepatic FoxO1 production up-regulated PGC-β expression in liver. To corroborate these findings, we determined endogenous PGC-β protein levels in HepG2 in the absence and presence of adenovirus-mediated FoxO1 production. As shown in Fig. 4F, significantly higher PGC-1/β protein levels were detected in HepG2 cells transduced by FoxO1 vector. In contrast, PGC-1/β protein levels remained unchanged in control vector-transduced cells.
Fig. 4.

Impact of FoxO1 on hepatic lipogenic expression. Mice were killed after 16-h fasting after 6 d of hepatic FoxO1 production in normal CD-1 mice. Hepatic mRNA levels of FAS (A), ACC (B), and SREBP-1c (C) were determined using β-actin mRNA as control. Hepatic protein levels of SREBP-1c (D) and PGC-1β (E) were determined by semiquantitative immunoblot analysis. Cytosolic (molecular mass, 125 kDa) and nuclear (molecular mass, 68 kDa) SREBP-1 levels were coordinately produced. Quantitative data show hepatic levels of cytosolic SREBP-1c proteins. In addition, HepG2 cells were transduced with FoxO1 and LacZ vector at an MOI of 100 pfu/cell in 6-well plates. After 24 h incubation, PGC-1β protein levels (F) were determined. *, P < 0.05. NS, Not significant.
Effect of elevated hepatic FoxO1 expression on hepatic glucose metabolism
To study the effect of FoxO1 on hepatic glucose metabolism, we performed hyperinsulinemic/euglycemic clamp studies on mice after 5 d of hepatic production of FoxO1. GIRs during hyperinsulinemic/euglycemic clamping were determined and compared between different groups. As shown in Fig. 5A, the mean GIR in FoxO1 vector-treated mice was significantly reduced (46 ± 13 vs. 105 mg/kg·min in mock-treated control mice, P < 0.01 by ANOVA). In contrast, GIR in LacZ vector-treated mice (94 ± 9 mg/kg·min) was not significantly different from that in control mice. In addition, we determined hepatic glucose production rates in different groups of animals using the radioactive tracer method, as previously described (19). In keeping with increased hepatic gluconeogenesis in FoxO1 vector-treated mice (Fig. 2), elevated FoxO1 production in liver resulted in a 4-fold increase of hepatic glucose production (HGP) (Fig. 5B), which correlated with augmented hepatic PEPCK and G6Pase expression in FoxO1 vector-treated mice (Fig. 2). In contrast, HGP in LacZ vector-treated mice was not statistically different from controls. These results indicated that FoxO1 gain of function in liver perturbs the ability of insulin to suppress hepatic glucose production in mice.
Fig. 5.

Hyperinsulinemic/euglycemic clamp studies. A, GIR. B, HGP rate. Three groups of CD-1 mice (n = 6, mean body weight, 33.7 ± 2.5 g) were mock treated or treated with FoxO1 or LacZ vector. Animals were cannulated on d 3 after treatment. After 1 d of recovery, animals were subjected to hyperinsulinemic/euglycemic clamping for the determination of GIR and HGP as described in Materials and Methods. *, P < 0.01.
Hepatic metabolism in FoxO1 transgenic mice
To corroborate the above results, we studied the effect of FoxO1 on hepatic metabolism in FoxO1S253A transgenic mice. FoxO1S253A transgenic mice bear a constitutive FoxO1 mutant allele under the control of the transthyretin promoter. The resulting FoxO1S253A transgene is mainly expressed in liver (13). As shown in Fig. 6, A and B, FoxO1S253A transgenic mice exhibited significantly increased intrahepatic fat deposition. These histological results were confirmed by the quantification of hepatic TG content. When compared with age- and gender-matched control littermates, more than 2-fold levels of hepatic TG content were detected in livers of FoxO1S253A transgenic mice (Fig. 6C). To gain insight into the mechanism underlying the increased intrahepatic fat infiltration, we determined hepatic protein levels of SREBP-1c and its coactivator PGC-1β. Hepatic SREBP-1c (Fig. 6D) and PGC-1β (Fig. 6E) levels were markedly elevated, contributing to increased hepatic fat deposition in FoxO1S253A transgenic mice. These data are suggestive of a potential link between increased FoxO1 activity and impaired hepatic metabolism in FoxO1S253A transgenic mice (13, 26).
Fig. 6.

Effect of FoxO1 on hepatic metabolism in FoxO1S253A transgenic mice. FoxO1S253A transgenic mice (Foxo1-tg, n = 5) at 8 months of age and control littermates (Ctrl, n = 7) were killed after 16-h fasting. Liver tissues were studied for hepatic fat content by staining with Oil red O (A and B) and quantifying hepatic TG content (C). Hepatic protein levels of SREBP-1c (D) and PGC-1β (E) were quantified by a semiquantitative immunoblot assay. Quantitative data show hepatic abundance of cytosolic SREBP-1c proteins because cytosolic and nuclear SREBP-1 levels were coordinately expressed. *, P < 0.05. Bar, 50 μm.
Hepatic FoxO1 expression and subcellular distribution in high fat diet-induced obese mice
To investigate the potential association between insulin resistance and FoxO1 deregulation in liver, we studied hepatic FoxO1 expression and subcellular distribution in high fat diet-induced obese mice. C57 BL/6J mice at 6 wk of age were fed a high-fat diet (n = 6) or regular chow (n = 6) for 2 months. In comparison with mice fed regular chow, high-fat diet-fed mice exhibited significantly increased body weight gain (Fig. 7A), accompanied by elevated fasting blood glucose levels (Fig. 7B) and markedly increased fasting plasma insulin levels (Fig. 7C). In response to glucose tolerance test (GTT), high-fat diet-fed animals displayed severely impaired blood glucose profiles, in comparison with lean controls (Fig. 7D). To study the expression level of FoxO1 in liver, animals were killed after a 16-h fast after a 2-month high-fat feeding. Liver tissues were used for preparation of cytoplasmic and nuclear protein lysates, which were subjected to immunoblot analysis. When compared with lean control mice, more than 3-fold higher levels of FoxO1 protein were detected in the nucleus of hepatocytes in high-fat diet-induced obese mice (Fig. 7, E and F). To confirm these findings, total hepatic RNA was isolated from high-fat diet-fed and control mice and subjected to semi-quantitative RT-PCR assay. As shown in Fig. 7G, hepatic FoxO1 mRNA expression was markedly elevated in response to high-fat feeding.
Fig. 7.

FoxO1 expression in high-fat diet-induced obese mice. C57 BL/6J mice at 6 wk of age were fed a high-fat diet (n = 6) or regular chow (n = 6) for 2 months. A, Body weight. B, Fasting blood glucose levels. C, Fasting plasma insulin levels. D, Blood glucose profiles during GTT. E, Nuclear and total FoxO1 protein levels. F, Immunoblot of cytoplasmic vs. nuclear FoxO1 protein. G, FoxO1 mRNA levels. Total liver RNA was prepared for the determination of FoxO1 mRNA levels by semiquantitative RT-PCR using β-actin mRNA as control. Fasting blood glucose and plasma insulin levels were determined after a 16-h fast. *, P < 0.05; **, P < 0.001.
Effects of FoxO1 loss of function on glucose metabolism in db/db mice
FoxO1-Δ256 is a FoxO1 dominant-negative mutant allele, whose hepatic expression has been shown to inhibit FoxO1 function in target gene expression in cultured hepatocytes (14,17). We have previously shown that hepatic FoxO1-Δ256 production in insulin-resistant livers suppressed excessive gluconeogenesis, contributing to significantly improved fasting glycemia in diabetic db/db mice (14). To study whether FoxO1 loss of function is associated with improved hepatic metabolism, we transferred FoxO1-Δ256 cDNA into liver of diabetic db/db mice, as described (14). Male db/db mice at 12 wk of age were stratified by blood glucose levels and randomly assigned to three groups to ensure similar mean blood glucose levels in different groups (n = 6). One group of db/db mice was treated with FoxO1-Δ256 vector at 1.5 × 10¹¹ pfu/kg per animal, the second group was treated with LacZ vector at the same dose, and the third group was mock treated. In addition, one group (n = 6) of heterozygous db/+ mice was included as controls. Four days after hepatic FoxO1-Δ256 cDNA delivery, we performed ip glucose tolerance test. As shown in Fig. 8A, FoxO1-Δ256 vector-treated db/db mice exhibited significantly improved blood glucose profiles in response to GTT, although their glucose disposal rates were not completely restored to normal. In contrast, mock- and control vector-treated diabetic db/db mice displayed severely impaired blood glucose profiles in response to GTT. This was confirmed by quantitative AUC analysis of blood glucose profiles. As shown in Fig. 8B, the mean AUC value in FoxO1-Δ256 vector-treated db/db mice was significantly reduced, in comparison with mock- or control vector-treated db/db mice.
Fig. 8.

Effect of FoxO1 loss of function on glucose metabolism in db/db mice. A, Blood glucose profiles during GTT. B, AUC of blood glucose profiles during GTT. C, Changes in blood glucose levels in response to insulin tolerance test. D, Fasting plasma insulin levels. Data in A and B were obtained on d 4 after vector administration. Insulin tolerance test was performed on d 5 after vector administration. For blood glucose levels higher than 500 mg/dl, aliquots of 5-μl freshly collected tail-vein blood samples were mixed with 5 μl PBS buffer before blood glucose levels were immediately measured by glucometer. *, P < 0.05; **, P < 0.001.
To study the potential improvement in insulin sensitivity as a result of functional inhibition of FoxO1 activity in liver, we performed an ip insulin tolerance test. As shown in Fig. 8C, FoxO1-Δ256 vector-treated diabetic mice exhibited significantly increased sensitivity to insulin, and their blood glucose levels were significantly reduced in response to insulin infusion. In contrast, control vector-treated db/db mice continued to maintain relatively high degrees of insulin resistance, as reflected by the lack of changes in blood glucose levels in response to ITT.
To corroborate these findings, we determined fasting plasma insulin levels after an 8-h fast. When compared with mock- or control vector-treated db/db mice, fasting plasma insulin levels in FoxO1-Δ256 vector-treated diabetic mice were significantly reduced, albeit not to the normal levels seen in nondiabetic db/+ control mice (Fig. 8D). Together these results indicate that FoxO1 loss of function in insulin-resistant liver is associated with improved glucose metabolism and amelioration of insulin resistance in diabetic mice.
To determine the effect of FoxO1-Δ256 on hepatic lipid metabolism, we quantified hepatic TG content in db/db mice after 1 wk of hepatic FoxO1-Δ256 expression. Hepatic TG levels in diabetic db/db mice were markedly elevated (1320 ± 126 mg/g liver protein), which were more than 20-fold higher than that in control littermates (60.5 ± 8.5 mg/g liver protein). In addition, we detected a mean hepatic TG content of 1360 ± 169 mg/g liver in FoxO1-Δ256 vector-treated db/db mice. These data suggest that short-term FoxO1-Δ256 production in liver did not mitigate hepatic steatosis despite the reduction of hyperglycemia and hyper-insulinemia in diabetic db/db mice.
Hepatic FoxO1 expression under fed vs. fasting conditions
To study the physiological expression profile of FoxO1 in liver, we determined hepatic FoxO1 mRNA and protein levels in mice under fed and fasting conditions. Male C57BL/6J mice at 6 months old were randomly divided into two groups, one of which was fasted for 24 h and the other was fed ad libitum. Both hepatic FoxO1 protein (Fig. 9A) and mRNA (Fig. 9B) levels were markedly elevated in response to 24-h fasting. Imae et al. also showed that hepatic FoxO1 mRNA levels were increased in fasted rats (27). To study the effect of fasting on subcellular redistribution of FoxO1, we performed immunohistochemistry. FoxO1 was predominantly localized in the nuclei of hepatocytes in liver of fasted mice (Fig. 9, C–E), when compared with mice under non-fasting conditions (Fig. 9, F–H). Increased FoxO1 expression along with its skewed nuclear distribution accounts for its enhanced transcriptional activity, which serves a compensatory mechanism for promoting hepatic glucose production to preserve fasting blood glucose levels within a normal range.
Fig. 9.

Hepatic FoxO1 expression in fed and fasting states. Male C57BL/6J mice (6 months old on regular chow) were fasted for 24 h (n = 3) or fed ad libitum (n = 4). Liver tissue was collected from killed mice for the preparation of liver protein extracts. Aliquots of 20 μg liver proteins were subjected to 4–20% gradient SDS-PAGE. Hepatic abundance of FoxO1 (A) was determined by semiquantitative immunoblot assay. Hepatic FoxO1 mRNA levels (B) were determined by real-time RT-PCR using β-actin mRNA as control. Hepatic FoxO1 subcellular distribution in fasting (C–E) and nonfasting (F–H) states was examined by immunohistochemistry using anti-FoxO1 antibody. Arrows mark FoxO1-colocalized nuclei (E). Bar, 20 μm. *, P < 0.001.
Discussion
We studied the effect of FoxO1 on hepatic glucose metabolism using two independent but complementary approaches, namely gain vs. loss of function in normal vs. insulin-resistant liver. We showed that elevated FoxO1 production in normal liver by about 2.5-fold, a level that is normally detected in diabetic liver (26), resulted in a marked increase in hepatic glucose production in mice. As a result, FoxO1 vector-treated mice develop a prediabetic phenotype, as manifested by impaired glucose tolerance and elevated fasting plasma insulin levels but without significant elevations in fasting blood glucose levels. These results are consistent with previous data that excessive hepatic glucose production caused by transgenic PEPCK expression or impaired insulin inhibition of hepatic gluconeogenesis in liver-specific insulin receptor-knockout mice resulted in glucose intolerance and hyperinsulinemia (28, 29). Conversely, functional inhibition of FoxO1, caused by hepatic expression of its dominant-negative variant in insulin-resistant liver, was shown to suppress excessive gluconeogenesis, contributing to improved fasting glycemia in diabetic db/db mice. These results suggest that excessive hepatic FoxO1 activity is associated with impaired ability of insulin to suppress hepatic glucose production. Inhibition of FoxO1 activity in insulin-resistant liver confers a beneficial effect on hepatic metabolism in diabetic mice. In support of this notion, Samuel et al. (16) showed that targeted FoxO1 inhibition by antisense approach improved hepatic metabolism and peripheral insulin action in high-fat diet-induced obesity.
FoxO1 has emerged as a key forkhead transcription factor that acts in liver to mediate the inhibitory effect of insulin on hepatic gluconeogenesis. In response to reduced insulin action, hepatically produced FoxO1 resides in the nucleus and acts as a transcription enhancer to stimulate gluconeogenic gene expression, accounting for augmented glucose production in liver. In the presence of insulin, FoxO1 is phosphorylated, resulting in its nuclear exclusion and inhibition of hepatic gluconeogenesis. This phosphorylation-dependent FoxO1 protein trafficking has been viewed as an acute mechanism for liver to adjust hepatic gluconeogenic activity in response to altered insulin action under different physiological conditions (12, 30). Although insulin inhibition of FoxO1 activity can be achieved without necessarily altering FoxO1 subcellular redistribution, this inhibition seems to depend on the ability of FoxO1 to undergo insulin-dependent phosphorylation (31, 32). Consistent with this model, we show that hepatic FoxO1 activity is enhanced, which acts as a compensatory mechanism for priming the liver to augment hepatic production in response to prolonged fasting. Inhibition of FoxO1 activity in liver is associated with diminished ability to undergo hepatic gluconeogenesis, resulting in significantly lower fasting blood glucose levels (14).
Recently Nakae et al. (13) showed that transgenic mice expressing a constitutively active FoxO1 allele develop hyperinsulinemia, accompanied by impaired glucose tolerance. In contrast, FoxO1 haploinsufficiency is shown to rescue diabetes in IRS2-deficient diabetic mice and prevent the development of high-fat diet-induced insulin resistance in C57 BL/6J mice (15). We showed in diabetic db/db mice that hepatic FoxO1 expression becomes deregulated, culminating in its increased hepatic production along with skewed subcellular distribution in the nucleus, which is thought to be a contributing factor for the impaired ability of insulin to regulate hepatic glucose metabolism (26). Furthermore, hepatic FoxO1 was significantly increased in Syrian golden hamsters in response to high-fructose feeding, which correlated with impaired glucose tolerance and the development of hyperinsulinemia (33). In the present study, we demonstrated that hepatic FoxO1 expression also became deregulated in high-fat diet-induced obese mice, coinciding with the onset of hyperinsulinemia and glucose intolerance. Furthermore, we showed that mice with elevated hepatic FoxO1 production exhibited significantly increased fat deposition in liver due to the induction of PGC-1β. Because PGC-1β is a coactivator of SREBP-1c and is required for SREBP-1c-mediated lipogenesis in liver (25), the induction of PGC-1β production along with increased FAS and ACC expression in liver accounts for augmented hepatic lipogenic activity and increased lipid deposition in FoxO1 vector-treated and FoxO1S253A transgenic mice. Unlike PGC-1β-mediated induction of hepatic lipogenesis that is associated with lipid accumulation in liver without elevation of plasma TG levels, both hepatic lipid content and plasma TG levels were increased in FoxO1 vector-treated mice and FoxO1S253A transgenic mice (26). These data imply that FoxO1 may also play a significant role in very low-density lipoprotein-TG secretion. Whereas hepatic insulin signaling plays a pivotal role in metabolism and whole-body insulin sensitivity, our data together with others (13, 34) highlight the functional importance of FoxO1 as a target of insulin action in governing hepatic glucose and lipid metabolism. FoxO1 deregulation in insulin-resistant liver is a confounding factor for the pathogenesis of fasting hyperglycemia and dyslipidemia in diabetes.
Interestingly, recent studies (35, 36) indicated that in addition to its function in hepatic glucose metabolism, FoxO1 plays a role in promoting insulin sensitivity by up-regulating hepatic IRS2 expression. These findings seem counterintuitive in the sense that FoxO1 overproduction is associated with impaired hepatic metabolism in a number of animal models, including high-fat diet-induced obesity, diabetic db/db mice (14), high-fructose-induced hyperlipidemic hamsters (37), and FoxO1S253A transgenic mice (13). Furthermore, hepatic FoxO1 production is up-regulated in response to prolonged fasting in normal mice. To account for this apparent paradox of FoxO1 function, Matsumoto et al. (38) used an adenovirus-mediated gene transfer approach to achieve elevated production of the constitutively active FoxO1-ADA variant in liver, demonstrating that FoxO1-ADA augmented hepatic insulin sensitivity via a combined mechanism by stimulating IRS2 production and increasing Akt phosphorylation. This latter effect was due to FoxO1-ADA inhibition of the expression of pseudokinase tribble 3, a modulator of Akt activity (38). Consistent with our observation that increased FoxO1 activity was associated with hepatic fat infiltration, hepatic FoxO1-ADA production was shown to result in severe steatosis in mice (38). These data unveil a dual role for FoxO1 in modulating insulin sensitivity and hepatic lipid metabolism. Nevertheless, the physiological significance of this finding remains to be addressed (38).
Regarding the effect of FoxO1 on hepatic lipid metabolism, Zhang et al. (39) reported that hepatic SREBP-1c mRNA expression was reduced by 50%, accounting for decreased hepatic lipogenic activity in transgenic mice expressing a constitutively active FoxO1 allele. In contrast, we detected an increase in SREBP-1c protein levels in FoxO1S253A transgenic mice. This discrepancy may be attributable to the differences in the experimental settings between these two studies. First, the FoxO1 transgenic mice used by Zhang et al. expressed the mouse FoxO1-AAA allele with all three consensus phosphorylation sites (T24A, S256A, and S319A) mutated in FVB/N genetic background, whereas our transgenic mice expressing the human FoxO1S253A allele containing the S253A mutation in C57BL/6J background. Second, their transgenic mice were fed a high-carbohydrate diet containing 65% sucrose, in comparison with the regular rodent chow used in our study. Third, Zhang et al. studied the expression of SREBP-1c 6 h after feeding, when lipogenesis is relatively higher, in comparison with our experimental conditions in which SREBP-1 expression was determined after a 16-h fast. Lastly, our FoxO1S253A transgenic mice expressed FoxO1 at levels that were 2- to 3-fold higher than control littermates, as determined by Western blot analysis (13). This level is equivalent to hepatic FoxO1 protein levels detected in diabetic db/db mice (26). In contrast, only a 50% of increase in hepatic FoxO1 levels was produced in their transgenic mice, as measured by microarray and quantitative RT-PCR (39). Because SREBP-1c is not a target of FoxO1, the observed alterations in hepatic SREBP-1c expression were likely due to indirect effects of FoxO1 on hepatic metabolism in FoxO1S253A transgenic mice.
In summary, we show in multiple animal models that FoxO1 gain of function in liver is associated with augmented hepatic gluconeogenesis and elevated hepatic fat deposition at the expense of increased glycogen breakdown. Hepatic FoxO1 expression becomes deregulated, as characterized by increased nuclear redistribution in liver with impaired insulin action. In contrast, FoxO1 loss of function helps curb excessive gluconeogenesis in insulin-resistant liver, conferring significant beneficial effects on fasting glycemia in diabetic animals. These data suggest that FoxO1 deregulation is a confounding factor for impaired hepatic metabolism. Selective inhibition of FoxO1 activity in insulin-resistant liver may be explored as a novel mechanism to improve glucose metabolism in diabetes.
Acknowledgments
We thank Dr. Domenico Accili for providing transgenics and Dr. Bruce Spiegelman for providing anti-PGC-1β antibody. We thank Sonal Harbaran and Anja Richter for technical assistance.
This work was supported by National Institutes of Health Grant DK066301.
Abbreviations
- ACC
Acetyl CoA carboxylase
- ALT
alanine amino-transferase
- AST
aspartate aminotransferase
- AUC
area under the curve
- FAS
fatty acid synthase
- Fox
forkhead box
- GIR
glucose infusion rate
- GK
glucokinase
- G6Pase
glucose-6 phosphatase
- GTT
glucose tolerance test
- H&E
hematoxylin and eosin
- HGP
hepatic glucose production
- IRS
insulin receptor substrate
- PEPCK
phosphoenolpyruvate carboxykinase
- PGC
peroxisome proliferator-activated receptor-γ co-activator
- SREBP
sterol regulatory element binding protein
Footnotes
Endocrinology is published monthly by The Endocrine Society (http://www.endo-society.org), the foremost professional society serving the endocrine community.
Disclosure: the authors have nothing to disclose.
References
- 1.Pilkis SJ, Granner DK. Molecular physiology of the regulation of hepatic gluconeogenesis and glycogenolysis. Annu Rev Physiol. 1992;54:885–909. doi: 10.1146/annurev.ph.54.030192.004321. [DOI] [PubMed] [Google Scholar]
- 2.Giaccari A, Morviducci L, Pastore L, Zorretta D, Sbraccia P, Maroccia E, Buongiorno A, Tamburrano G. Relative contribution of glycogenolysis and gluconeogenesis to hepatic glucose production in control and diabetic rats. A re-examination in the presence of euglyceamia. Diabetologia. 1998;41:307–314. doi: 10.1007/s001250050908. [DOI] [PubMed] [Google Scholar]
- 3.Magnuson MA, Rothman DL, Katz LD, Shulman RG, Shulman GI. Increased rate of gluconeogenesis in type II diabetes mellitus: a 13C nuclear magnetic resonance study. J Clin Invest. 1992;90:1322–1327. doi: 10.1172/JCI115997. [DOI] [PMC free article] [PubMed] [Google Scholar]
- 4.Boden G, Chen X, Stein TP. Gluconeogenesis in moderately and severely hyperglycemic patients with type 2 diabetes mellitus. Am J Physiol Endocrinol Metab. 2001;280:E23–E30. doi: 10.1152/ajpendo.2001.280.1.E23. [DOI] [PubMed] [Google Scholar]
- 5.Kaestner KH, Knochel W, Martinez DE. Unified nomenclature for the winged helix/forkhead transcription factors. Gene Dev. 2000;14:142–146. [PubMed] [Google Scholar]
- 6.Nakae J, Park B-C, Accili D. Insulin stimulates phosphorylation of the forkhead transcription factor FKHR on serine 253 through a wortmannin-sensitive pathway. J Biol Chem. 1999;274:15982–15985. doi: 10.1074/jbc.274.23.15982. [DOI] [PubMed] [Google Scholar]
- 7.Nakae J, Barr V, Accili D. Differential regulation of gene expression by insulin and IGF-1 receptors correlates with phosphorylation of a single amino acid residue in the forkhead transcription factor FKHR. EMBO J. 2000;19:989–996. doi: 10.1093/emboj/19.5.989. [DOI] [PMC free article] [PubMed] [Google Scholar]
- 8.Durham SK, Suwanichkul A, Scheimann AO, Yee D, Jackson JG, Barr FG, Powell DR. FKHR binds the insulin response element in the insulin-like growth factor binding protein-1 promoter. Endocrinology. 1999;140:3140–3146. doi: 10.1210/endo.140.7.6856. [DOI] [PubMed] [Google Scholar]
- 9.Kops GJ, Burgering BM. Forkhead transcription factors: new insights into protein kinase B (c-akt) signaling. J Mol Med. 1999;77:656–665. doi: 10.1007/s001099900050. [DOI] [PubMed] [Google Scholar]
- 10.Kashii Y, Uchida M, Kirito K, Tanaka M, Nishijima K, Toshima M, Ando T, Koizumi K, Endoh T, Sawada K, Momoi M, Ozawa K, Komatsu N. A member of forkhead family transcription factor, FKHRL1, is one of the downstream molecules of phophatidylinositol 3-kinase-Akt activation path way in erythropoietin signal transduction. Hematopoisis. 2000;96:941–949. [PubMed] [Google Scholar]
- 11.Lin K, Dorman JB, Rodan A, Kenyon C. Daf-16: an HNF-3/Forkhead family member that can function to double the life-span of Caenorhabditis elegans. Science. 1997;278:1319. doi: 10.1126/science.278.5341.1319. [DOI] [PubMed] [Google Scholar]
- 12.Accili D, Arden KC. FoxOs at the crossroads of cellular metabolism, differentiation, and transformation. Cell. 2004;117:421–426. doi: 10.1016/s0092-8674(04)00452-0. [DOI] [PubMed] [Google Scholar]
- 13.Nakae J, Biggs WH, Kitamura T, Cavenee W, Wright CVE, Arden KC, Accili D. Regulation of insulin action and pancreatic β-cell function by mutated alleles of the gene encoding forkhead transcription factor Foxo1. Nat Genet. 2002;32:245–253. doi: 10.1038/ng890. [DOI] [PubMed] [Google Scholar]
- 14.Altomonte J, Richter A, Harbaran S, Suriawinata j, Nakae J, Thung SN, Meseck M, Accili D, Dong H. Inhibition of Foxo1 function is associated with improved fasting glycemia in diabetic mice. Am J Physiol. 2003;285:E718–E728. doi: 10.1152/ajpendo.00156.2003. [DOI] [PubMed] [Google Scholar]
- 15.Nakae J, Kitamura T, Kitamura Y, Biggs WH, 3rd, Arden KC, Accili D. The forkhead transcription factor Foxo1 regulates adipocyte differentiation. Dev Cell. 2003;4:119–129. doi: 10.1016/s1534-5807(02)00401-x. [DOI] [PubMed] [Google Scholar]
- 16.Samuel VT, Choi CS, Phillips TG, Romanelli AJ, Geisler JG, Bhanot S, McKay R, Monia B, Shutter JR, Lindberg RA, Shulman GI, Veniant MM. Targeting foxo1 in mice using antisense oligonucleotide improves hepatic and peripheral insulin action. Diabetes. 2006;55:2042–2050. doi: 10.2337/db05-0705. [DOI] [PubMed] [Google Scholar]
- 17.Nakae J, Kitamura T, Silver DL, Accili D. The forkhead transcription factor Foxo1 (Fkhr) confers insulin sensitivity onto glucose-6-phosphatase expression. J Clin Invest. 2001;108:1359–1367. doi: 10.1172/JCI12876. [DOI] [PMC free article] [PubMed] [Google Scholar]
- 18.Dong H, Altomonte J, Morral N, Meseck M, Thung SN, Woo SLC. Basal insulin gene expression significantly improves conventional insulin therapy in type 1 diabetic rats. Diabetes. 2002;51:130–138. doi: 10.2337/diabetes.51.1.130. [DOI] [PubMed] [Google Scholar]
- 19.Rossetti L, Chen W, Hu M, Hawkins M, Barzilai N, Efrat S. Abnormal regulation of HGP by hyperglycemia in mice with a disrupted glucokinase allele. Am J Physiol. 1997;273:E743–E750. doi: 10.1152/ajpendo.1997.273.4.E743. [DOI] [PubMed] [Google Scholar]
- 20.Altomonte J, Harbaran S, Richter A, Dong H. Fat-depot specific expression of adiponectin is impaired in Zucker fatty rats. Metabolism. 2003;52:958–963. doi: 10.1016/s0026-0495(03)00092-1. [DOI] [PubMed] [Google Scholar]
- 21.Dong H, Morral N, McEvoy R, Meseck M, Thung SN, Woo SLC. Hepatic insulin expression improves glycemic control in type 1 diabetic rats. Diabetes Res Clin Pract. 2001;52:153–163. doi: 10.1016/s0168-8227(01)00220-0. [DOI] [PubMed] [Google Scholar]
- 22.Huard J, Lochmüller H, Acsadi G, Jani A, Massie B, Karpati G. The route of administration is a major determinant of the transduction efficiency of rat tissues by adenoviral recombinants. Gene Ther. 1995;2:107–115. [PubMed] [Google Scholar]
- 23.Foretz M, Pacot C, Dugail I, Lemarchand P, Guichard C, Le Liepvre X, Berthelier-Lubrano C, Spiegelman B, Kim JB, Ferre P, Foufelle F. ADD1/SREBP-1c is required in the activation of hepatic lipogenic gene expression by glucose. Mol Cell Biol. 1999;19:3760–3768. doi: 10.1128/mcb.19.5.3760. [DOI] [PMC free article] [PubMed] [Google Scholar]
- 24.Forete M, Guichard C, Ferre P, Foufelle F. Sterol regulatory element binding protein-1c is a major mediator of insulin action on the hepatic expression of glucokinase and lipogenesis-related genes. Proc Natl Acad Sci USA. 1999;96:12737–12742. doi: 10.1073/pnas.96.22.12737. [DOI] [PMC free article] [PubMed] [Google Scholar]
- 25.Lin J, Yang R, Tarr PT, Wu PH, Handschin C, Li S, Yang W, Pei L, Uldry M, Tontonoz P, Newgard CB, Spiegelman BM. Hyperlipidemic effects of dietary saturated fats mediated through PGC-1β coactivation of SREBP. Cell. 2005;120:261–273. doi: 10.1016/j.cell.2004.11.043. [DOI] [PubMed] [Google Scholar]
- 26.Altomonte J, Cong L, Harbaran S, Richter A, Xu J, Meseck M, Dong HH. Foxo1 mediates insulin action on ApoC-III and triglyceride metabolism. J Clin Invest. 2004;114:1493–1503. doi: 10.1172/JCI19992. [DOI] [PMC free article] [PubMed] [Google Scholar]
- 27.Imae M, Fu Z, Yoshida A, Noguchi T, Kato H. Nutritional and hormonal factors control the gene expression of FoxOs, the mammalian homologues of DAF-16. J Mol Endocrinol. 2003;30:253–262. doi: 10.1677/jme.0.0300253. [DOI] [PubMed] [Google Scholar]
- 28.Valera A, Pujol A, Pelegrin M, Bosch F. Transgenic mice overexpressing phosphoenolpyruvate carboxykinase develop non-insulin-dependent diabetes mellitus. Proc Natl Acad Sci USA. 1994;91:9151–9154. doi: 10.1073/pnas.91.19.9151. [DOI] [PMC free article] [PubMed] [Google Scholar]
- 29.Fisher SJ, Kahn CR. Insulin signaling is required for insulin’s direct and indirect action on hepatic glucose production. J Clin Invest. 2003;111:463–468. doi: 10.1172/JCI16426. [DOI] [PMC free article] [PubMed] [Google Scholar]
- 30.Zhao X, Gan L, Pan H, Kan D, Majeski M, Adam SA, Unterman TG. Multiple elements regulate nuclear/cytoplasmic shuttling of FOXO1: characterization of phosphorylation- and 14-3-3-dependent and -independent mechanisms. Biochem J. 2004;378:839–849. doi: 10.1042/BJ20031450. [DOI] [PMC free article] [PubMed] [Google Scholar]
- 31.Tsai WC, Bhattacharyya N, Han LY, Hanover JA, Rechler MM. Insulin inhibition of transcription stimulated by the forkhead protein Foxo1 is not solely due to nuclear exclusion. Endocrinology. 2003;144:5615–5622. doi: 10.1210/en.2003-0481. [DOI] [PubMed] [Google Scholar]
- 32.Zhang X, Gan L, Pan H, Guo S, He X, Olson ST, Mesecar A, Adam S, Unterman TG. Phosphorylation of serine 256 suppresses transactivation by FKHR (FOXO1) by multiple mechanisms. Direct and indirect effects on nuclear/cytoplasmic shuttling and DNA binding. J Biol Chem. 2002;277:45276–45284. doi: 10.1074/jbc.M208063200. [DOI] [PubMed] [Google Scholar]
- 33.Altomonte J, Anthony K, Baliga S, Xu J, Dong H. Foxo1 plays a role in mediating the effect of fibrates on diabetic dyslipidemia. Diabetes. 2004;53(Suppl 2):A227. [Google Scholar]
- 34.Kitamura T, Nakae J, Kitamura Y, Kido Y, Biggs WH, 3rd, Wright CV, White MF, Arden KC, Accili D. The forkhead transcription factor Foxo1 links insulin signaling to Pdx1 regulation of pancreatic β cell growth. J Clin Invest. 2002;110:1839–1847. doi: 10.1172/JCI200216857. [DOI] [PMC free article] [PubMed] [Google Scholar]
- 35.Zhang J, Ou J, Bashmakov Y, Horton JD, Brown MS, Goldstein JL. Insulin inhibits transcription of IRS-2 gene in rat liver through an insulin response element (IRE) that resembles IREs of other insulin repressed genes. Proc Natl Acad Sci USA. 2001;98:3756–3761. doi: 10.1073/pnas.071054598. [DOI] [PMC free article] [PubMed] [Google Scholar]
- 36.Ide T, Shimano H, Yahagi N, Matsuzaka T, Nakakuki M, Yamamoto T, Nakagawa Y, Takahashi A, Suzuki H, Sone H, Toyoshima H, Fukamizu A, Yamada N. SREBPs suppress IRS-2-mediated insulin signalling in the liver. Nat Cell Biol. 2004;6:351–357. doi: 10.1038/ncb1111. [DOI] [PubMed] [Google Scholar]
- 37.Qu S, Su D, Altomonte J, Kamagate A, He J, Perdomo G, Tse T, Jiang Y, Dong HH. PPAR-α mediates the hypolipidemic action of fibrates by antagonizing FoxO1. Am J Physiol Endocrinol Metab. doi: 10.1152/ajpendo.00157.2006. in press. [DOI] [PMC free article] [PubMed] [Google Scholar]
- 38.Matsumoto M, Han S, Kitamura T, Accili D. Dual role of transcription factor FoxO1 in controlling hepatic insulin sensitivity and lipid metabolism. J Clin Invest. 2006;116:2464–2472. doi: 10.1172/JCI27047. [DOI] [PMC free article] [PubMed] [Google Scholar]
- 39.Zhang W, Patil S, Chauhan B, Guo S, Powell DR, Le J, Klotsas A, Matika R, Xiao X, Franks R, Heidenreich KA, Sajan MP, Farese RV, Stolz DB, Tso P, Koo SH, Montminy M, Unterman TG. FoxO1 regulates multiple metabolic pathways in the liver: effects on gluconeogenic, glycolytic, and lipogenic gene expression. J Biol Chem. 2006;281:10105–10117. doi: 10.1074/jbc.M600272200. [DOI] [PubMed] [Google Scholar]