

Abstract
Objective
To compare the effectiveness of progressively increasing stimulation intensity, progressively increasing frequency, or progressively increasing both frequency and intensity on paralyzed quadriceps femoris muscle force maintenance during repetitive activation.
Design
Factorial design with different stimulation protocols as independent variables.
Setting
A muscle performance laboratory.
Participants
People (N=8) with spinal cord injury (SCI) (age, 14.63±1.77y).
Interventions
Not applicable.
Main Outcome Measure
Number of contractions when the peak force was 90% or more of a subject’s maximal twitch force.
Results
The protocol involving progressively increasing stimulation intensity and then frequency generated more successful contractions (189.88±53.33) than progressively increasing the frequency followed by intensity (122.75±26.56 contractions). Regardless of the order, progressively increasing both intensity and frequency generated more successful contractions than progressively increasing intensity (97 contractions) or frequency (62 contractions) alone.
Conclusions
Our findings suggest that during repetitive electric activation, progressively increasing both stimulation frequency and intensity can produce more successful contractions than progressively increasing only frequency or intensity. These findings can help researchers and clinicians design more effective stimulation protocols for persons with SCI during functional electric stimulation applications.
Keywords: Electric stimulation, Rehabilitation, Spinal cord injuries
The use of electric stimulation to produce purposeful and controlled muscle contractions to restore functional movements for patients with upper motoneuron lesions is termed functional electric stimulation (FES).1 FES has been used to help patients perform functional movements such as standing or walking after stroke2,3 or spinal cord injury (SCI)4–10 and has been added into gait training protocols to improve walking function.11 Although FES has the potential advantage of improving functional mobility for people with upper motoneuron lesions, it has not gained widespread clinical popularity because of limitations such as rapid muscle fatigue.12–14
Possible factors contributing to the rapid muscle fatigue observed during FES are differences in motor unit activation during voluntary versus electrically elicited contractions and changes in skeletal muscle after upper motoneuron lesions. During electric stimulation, the same motor unit population is usually recruited if the stimulation intensity is kept constant15 and, in contrast to voluntary contractions, all of the recruited motor units are activated synchronously. Also, because of the inverse relationship between neuron axial resistance and fiber diameter,16 larger motoneurons are more likely to be activated than smaller ones, resulting in the preferential recruitment of the more fatigable motor units during electric stimulation.17–19 This repetitive activation of the same motor unit population and the preferential recruitment of larger and more fatigable units cause more rapid muscle fatigue during electric stimulation compared with voluntary contractions. In addition, muscular atrophy and a shift in muscle fiber type composition toward predominantly fatigable fibers occur after SCI,20–22 resulting in an increase in muscle fatigability23–25 and contributing to the rapid muscle fatigue observed during the application of FES.
During voluntary contractions, the central nervous system controls muscle force by modulating both the activation frequency (rate-coding) and the number of activated motor units (recruitment).26,27 In contrast, most FES systems use a constant stimulation frequency and only modulate intensity to recruit motor units and control muscle force output.13,28–31 Although not currently used by clinical FES systems, it has been reported that increasing stimulation frequency was effective in maintaining muscle force production during repetitive electric stimulation.32,33 Kebaetse et al compared the number of knee excursions that exceed a targeted angle using stimulation strategies with and without frequency modulation for both able-bodied subjects32 and subjects with SCI.33 Their results showed that by switching from a lower to a higher stimulation frequency, human quadriceps femoris muscles produced more knee excursions that exceeded a target angle compared with repetitive stimulation at a constant frequency or by switching from a higher to a lower frequency. Kebaetse’s results indicate the importance of rate-coding in maintaining muscle force production during electrically elicited contractions and suggest that frequency modulation should be considered for the application of FES.
The effectiveness of increasing stimulation frequency and intensity on maintaining force production of the quadriceps femoris muscles of able-bodied people during electrically elicited contractions has been recently investigated in our laboratory.34 Five different stimulation strategies, including progressively increasing frequency, progressively increasing intensity, and 3 protocols that progressively increased the intensity and then progressively increased the frequency using one of 3 different starting frequencies (20, 30, 40Hz) were investigated. With the use of a real-time feedback controller, stimulation frequency and intensity were increased progressively to maintain the quadriceps muscle’s peak forces above a targeted force level. Our results show that starting at 30Hz and progressively increasing the intensity and frequency allows the muscle to maintain peak forces for a longer period of time compared with the other stimulation strategies. In addition, progressively increasing the frequency produced more successful contractions than increasing the intensity.
To date, however, no study to our knowledge has reported the effectiveness of progressively increasing both the stimulation frequency and intensity to overcome the rapid muscle fatigue seen in muscles of paralyzed people during repetitive electric stimulation. Thus, the purpose of this study was to compare the effectiveness of progressively increasing stimulation intensity, progressively increasing frequency, or progressively increasing both on paralyzed quadriceps femoris muscle force maintenance during repetitive activation. We hypothesized that (1) progressively increasing stimulation frequency would produce more contractions that meet or exceed a targeted level (successful contractions) than progressively increasing the intensity, (2) progressively increasing both intensity and frequency would produce more successful contractions than progressively increasing intensity or frequency only, and (3) the best stimulation strategy to maintain muscle forces for the longest period of time would progressively increase first the stimulation intensity and then the frequency. The findings of this study may be important in providing guidelines for improving FES applications.
METHODS
Participants
Five boys and 3 girls (age, 14.63±1.77y) with SCI and American Spinal Injury Association grade A or B (motor complete lesions) were recruited from the pool of previously screened subjects with SCI who have agreed to participate in research studies at Shriners Hospital for Children, Philadelphia, PA. The use of subjects with complete motor lesions allowed us to isolate the effects of electric stimulation without the contribution of voluntary contractions. Subjects and their parents or guardians were made aware of the nature of the research, the procedures, and the potential risks involved. Parents then signed an informed consent form approved by the Human Subjects Review Board of University of Delaware and the institutional review board of Temple University. In addition, each subject signed an approved assent form.
People with SCI were excluded from this study if they failed to meet any of the following inclusion criteria: (1) motor complete thoracic or cervical level SCI; (2) 7 to 25 years old; (3) at least 10 months post-SCI and neurologically stable; (4) no history of heart disease, peripheral vascular disease, neoplasms, or any neurologic disorder affecting lower extremities, such as cerebrovascular accident and multiple sclerosis; (5) no previous knee joint injury, including arthritic conditions; (6) not pregnant; or (7) minimal or no flexor withdrawal response to electric stimulation of the quadriceps femoris muscles.
A screening process was performed to determine if strong and unwanted reflexive responses exist when electric stimulation was applied. A series of stimulation trains with different stimulation frequency and intensity combinations was delivered to the quadriceps muscles at a rate of approximately 1 train every 5 to 10 seconds. The stimulation trains were 1 second long with frequencies of 1, 14, and 33Hz. The reflexive response was considered strong if the stimulation produced no increase in force with increasing stimulation intensity or if there was unwanted muscle activity such as hip or knee flexion and/or ankle dorsiflexion or plantarflexion force noise that made reading forces from the quadriceps difficult and the unwanted muscle responses did not accommodate to repetitive electric stimulation. All 8 subjects tested showed minimal or no flexor withdrawal responses to electric stimulation of the quadriceps femoris muscles.
Equipment and Experimental Setup
Subjects were seated on a computer-controlled dynamometer III 500-11a with hips flexed to approximately 85° and knees flexed to 65°. The trunk, waist, and thigh were stabilized using inelastic straps with self-adhesive (Velcro) closures. The axis of the dynamometer was aligned with the axis of each subject’s knee joint. Isometric muscle forces for right quadriceps femoris muscles were measured by a force transducer placed against the anterior aspect of the tibia, with the lower edge of the transducer pad positioned 2.5cm proximal to the lateral malleolus. A Grass model S8800 electric stimulator and an SIU8T stimulus isolation unitb were used to deliver electric stimulation to the quadriceps femoris muscles. A personal computer equipped with a PCI-6Q24FDAQ board,c a PCI 6602 counter-timer board,c and custom-written LabView softwarec was used to control the timing of all pulses during testing. Although stimulation intensity can be modulated by varying either pulse amplitude or duration, pulse duration modulation was chosen in the present study because it was easier to control and required less charge per stimulus pulse compared with stimulation amplitude modulation.35 A custom-made pulse-duration control switch was connected in series with the Grass stimulator for the modulation of pulse duration. Two 7.6 × 12.7–cm, self-adhesive electrodesd were used for electric stimulation. The electrode connected to the anode of the stimulator was placed over the motor point of the rectus femoris, and the cathode was placed over the motor point of the vastus medialis.36
Experimental Procedures
Each subject participated in 2 testing sessions; sessions were separated by a minimum of 48 hours (fig 1). Each session involved one of the 2 fatiguing protocols and the order for testing each protocol was randomly assigned to each subject.
Fig 1.

Experimental procedures.
At the beginning of each session, each subject’s maximal twitch force was determined. A single 600-µs stimulation pulse was delivered every 10 seconds while the stimulation voltage was increased from 0V to a maximum of 135V in 5-V increments until a plateau in the maximum peak twitch force occurred. After determining the maximal twitch force, the stimulation voltage was adjusted to produce tetanic force equal to the subject’s maximal twitch force level using a 1-second, 100-Hz stimulation train (pulse duration, 600µs). The maximal twitch force of persons with SCI is approximately 20% to 25% of their maximum tetanic force,23,37 so the force level tested was relatively low and safe. Next, a series of 1-second–long stimulation trains with different frequency (12.5, 20, 33.3, 50, or 80Hz) and intensity (150, 250, 350, or 600µs) combinations were delivered to the quadriceps femoris muscles to determine the force-frequency and force-intensity relationships for each subject. These 20 testing trains were delivered in a random order at the rate of 1 train every 10 seconds to avoid fatigue and then were repeated in a reversed order. (The same random order was used for all subjects.) The force responses to the train with the same frequency and intensity were averaged and plotted to obtain each subject’s force-frequency and force-intensity relationships, which were then used to determine the required increments in stimulation frequency and intensity to maintain muscle peak force output for each subject (appendix 1).
After calculating the frequency and intensity modulation steps for a subject, stimulation amplitude was readjusted using a series of 300-ms–long, 60-Hz stimulation trains (pulse duration, 600µs). Stimulation amplitude was gradually increased until the peak force reached twice the subject’s maximal twitch force (2 by maximal twitch force). The amplitude was then held constant for the remainder of the session.
Next, one of the fatiguing protocols was tested. For both fatiguing protocols, each train was 300ms long, the starting frequency was 30Hz, and stimulation trains were delivered at a rate of 1 train every 1.1 seconds. The starting stimulation intensity was determined by adjusting the pulse duration to produce a peak force equal to the subject’s maximal twitch force. In each of the fatiguing protocols, the stimulation frequency or intensity was increased progressively each time when the peak forces dropped below 90% of the subject’s maximal twitch force. One of the fatiguing protocols progressively increased stimulation pulse duration first. After the pulse duration reached 600µs, stimulation frequency was then progressively increased until it reached 60Hz (intensity followed by frequency modulation protocol). Another fatiguing protocol progressively increased stimulation frequency first. After the frequency reached 60Hz, pulse duration was increased progressively until it reached 600µs (frequency followed by intensity modulation protocol).
Data Management and Analysis
The dependent variable in the current study was the number of successful contractions. A contraction was defined as successful when its peak force exceeded 90% or more of a subject’s maximal twitch force. One-way analysis of variance was used to compare the number of successful contractions produced by the intensity followed by frequency modulation protocol, frequency followed by intensity modulation protocol, the increasing intensity-only portion of the intensity followed by frequency modulation protocol, and the increasing frequency-only portion of the frequency followed by intensity modulation protocol. The Tukey post hoc test was performed if a significant main effect was observed. Statistical significance was accepted at P less than or equal to .05.
RESULTS
The maximal twitch force for the 8 subjects tested ranged from 28 to 60N. The mean initial pulse duration ± standard deviation (SD) was 218.38±34.32µs. On average, 6 intensity modulation steps were used to maintain quadriceps femoris muscle isometric peak forces at the maximal twitch force level. In addition, 2 to 4 frequency modulation steps were used for force maintenance above the targeted force level (table 1).
Table 1.
Summary for the 8 Subjects Tested
| No. of Modulation Steps |
||||||||
|---|---|---|---|---|---|---|---|---|
| Subject | Sex | Age (y) | Years Since Injury | SCI Level | MTF (n) | Initial Pulse Duration (µs) | Intensity | Frequency |
| 1 | M | 14 | 7.0 | T9 | 51 | 206 | 4 | 2 |
| 2 | M | 15 | 2.0 | T8 | 58 | 260 | 7 | 4 |
| 3 | F | 15 | 2.0 | T6 | 52 | 204 | 5 | 2 |
| 4 | M | 15 | 8.0 | T10–11 | 28 | 227 | 7 | 4 |
| 5 | M | 14 | 5.0 | T4 | 38 | 172 | 8 | 3 |
| 6 | F | 16 | 1.5 | T10 | 60 | 200 | 8 | 2 |
| 7 | F | 11 | 6.0 | C7 | 29 | 202 | 7 | 3 |
| 8 | M | 17 | 3.0 | T6 | 48 | 276 | 5 | 4 |
| Mean ± SD | NA | 14.6±1.8 | 4.3±2.5 | NA | 45.5±12.3 | 218.0±34.3 | 6.9±1.5 | 3.0±0.9 |
Abbreviations: F, female; M, male; MTF, maximal twitch force; NA, not applicable.
The peak force responses to the 2 stimulation protocols for a typical subject are shown in figure 2. For this subject, the initial pulse duration was adjusted to 276µs so that the initial peak force response to a 30-Hz train was equal to the subject’s maximal twitch force (solid lines) (48N). Quadriceps muscles were then stimulated repetitively using 30-Hz trains with pulse duration at 276µs. The peak forces gradually declined because of muscle fatigue from repetitive activation. When the peak forces declined below 90% of the subject’s maximal twitch force (dashed lines) twice, the stimulation intensity was progressively increased based on the modulation steps calculated before testing. After each modulation, peak forces produced were again increased and above the 90% maximal twitch force level. After 2 failures in peak force using the maximal pulse duration (600µs), the stimulation frequency was then progressively increased from 30 to 60Hz. The stimulation protocol was stopped when, using the 60-Hz train, the peak force was below 90% of the maximal twitch force for 2 successive contractions (fig 2A). A similar procedure was used for the frequency followed by intensity modulation protocol (fig 2B). As shown in figure 2, the intensity followed by frequency modulation protocol produced 220 more successful contractions compared with the frequency followed by intensity modulation protocol for this subject.
Fig 2.
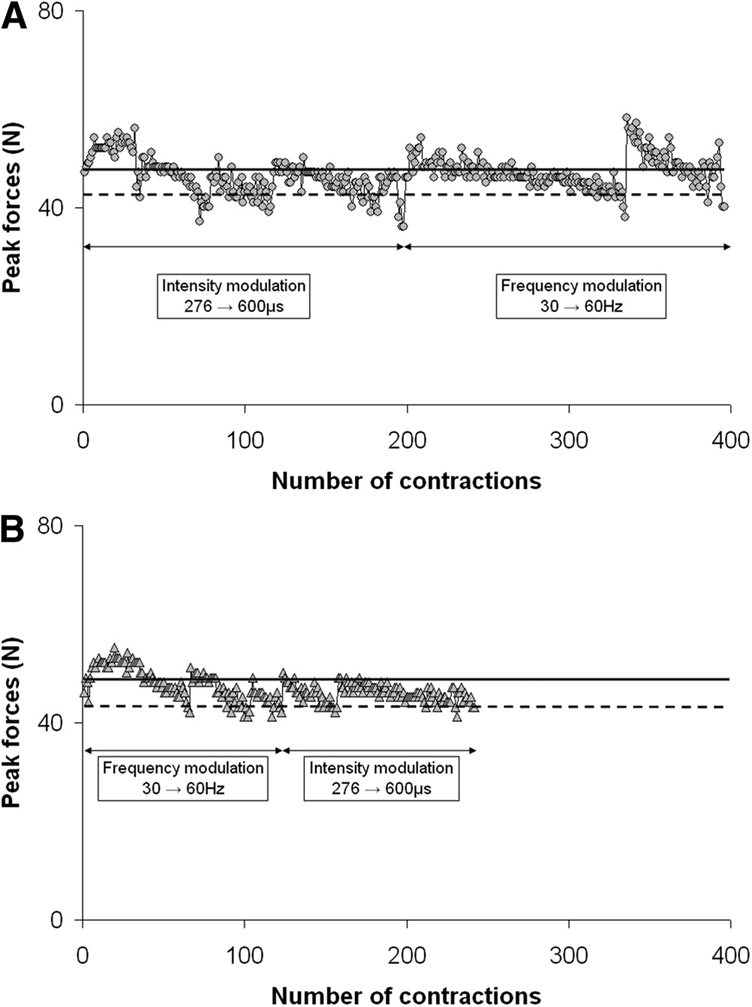
Plots of the peak force responses to the 2 stimulation protocols for a typical subject. Each data point represents a peak force from 1 contraction. (A) The intensity followed by frequency modulation protocol. (B) The frequency followed by intensity modulation protocol. In both protocols, the initial pulse duration was adjusted so that the initial peak forces were equal to a subject’s maximal twitch force (solid lines). Stimulation trains were delivered at a rate of 1 train every 1.1 seconds to fatigue the muscles. When the peak forces declined below 90% of the subject’s maximal twitch force (dashed lines), stimulation frequency or intensity was progressively increased according to the modulation steps calculated before testing. As shown in the figure, the intensity followed by frequency modulation protocol produced more successful contractions than the frequency followed by intensity modulation protocol.
The average number of successful contractions ± standard error produced by the intensity followed by frequency modulation protocol for all subjects was 189.88±53.33, which was significantly greater than the number of successful contractions produced by the frequency followed by intensity modulation protocol (122.75±26.56) (F=7.89, P<.05) (fig 3). In addition, the number of successful contractions produced by each of the combinations of frequency and intensity protocols were significantly greater than that of the intensity modulation portion (97 contractions) of the intensity followed by frequency modulation protocol and the frequency modulation portion (62 contractions) of the frequency followed by intensity modulation protocol. The number of successful contractions produced by the frequency modulation portion of the frequency followed by intensity modulation protocol was significantly smaller than that produced by the intensity modulation portion of the intensity followed by frequency modulation protocol.
Fig 3.
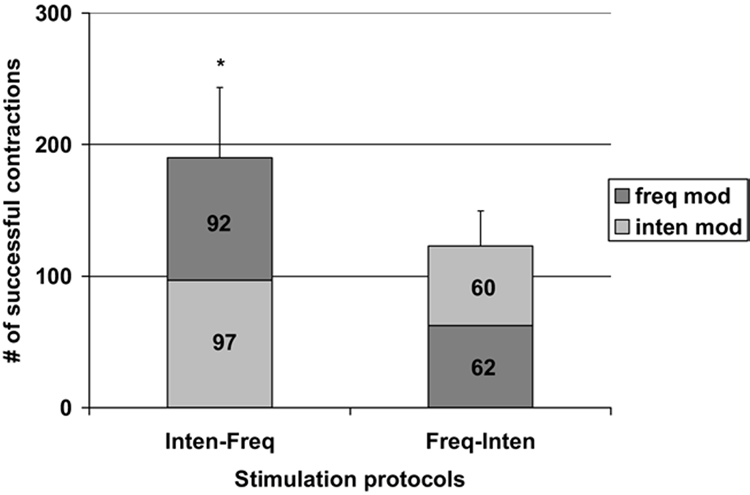
Plot of the number of successful contractions produced by the 2 stimulation protocols tested. Light gray indicates the number of successful contractions produced by the intensity modulation portion of the protocols; dark gray indicates the number of successful contractions produced by the frequency modulation portion of the protocols. The averaged number of successful contractions produced by the intensity followed by frequency (Inten-Freq) and the frequency followed by intensity (Freq-Inten) modulation (mod) protocols. * P<.05 (see text for details).
DISCUSSION
The current study was the first to compare the effectiveness of progressively increasing the stimulation frequency, stimulation intensity, or both frequency and intensity on paralyzed skeletal muscle peak force maintenance during repetitive activation. The results showed that stimulation strategies that progressively increased both stimulation frequency and intensity produced more successful contractions than strategies that progressively increased frequency or intensity only. Previous studies have shown that the central nervous system controls skeletal muscle force output by changing the firing rate (rate-coding) or the number of activated motor units (recruitment) during voluntary contractions.26,27,38 Although not used by current FES systems, rate-coding has been reported to have a significant contribution in muscle force output during both voluntary39 and electrically elicited contractions.40 We therefore expected that use of both rate-coding and recruitment may better maintain muscle force production than using only one of them. As hypothesized, our results showed that stimulation strategies that used the combination of both frequency and intensity modulation maintained paralyzed muscle force output longer than using only frequency or only intensity modulation. This finding suggests that using both frequency and intensity modulation may be a better stimulation strategy than the traditional approach (constant stimulation frequency and only increase stimulation intensity) and should be considered during the application of FES.
The results also showed that the order of frequency and intensity modulation significantly affected skeletal muscle force maintenance during repetitive electric stimulation. The better stimulation strategy first progressively increased the stimulation intensity and then the stimulation frequency (intensity followed by frequency modulation protocol). We posit that the difference in force maintenance between the intensity followed by frequency modulation protocol and the frequency followed by intensity modulation protocol might be due to differences in the metabolic demands and activation frequencies experienced by each activated muscle fiber during each protocol. As outlined in the Methods section, the same initial intensity and frequency combination was used for both protocols (a low initial intensity of ≈218µs and a 30-Hz frequency). Because a low stimulation intensity was maintained for the entire frequency modulation portion of the frequency followed by intensity modulation protocol, a much smaller fraction of the muscle was recruited throughout the frequency modulation portion of the frequency followed by intensity modulation protocol than during the intensity modulation portion of the intensity followed by frequency modulation protocol, which allowed new motor units to be recruited as the stimulation intensity was increased. Thus, because forces were maintained at the same level for both protocols, a greater metabolic demand and a more rapid rate of fatigue must have been produced within each active muscle fiber during the frequency modulation portion of the frequency followed by intensity modulation protocol than during the intensity modulation portion of the intensity followed by frequency modulation protocol. The advantage of producing less force for each active muscle fiber during the intensity modulation portion of the intensity followed by frequency modulation protocol may explain the better performance during the intensity modulation portion of the intensity followed by frequency modulation protocol compared with the frequency modulation portion of the frequency followed by intensity modulation protocol (see fig 3). Furthermore, for the second portion of each protocol, the intensity followed by frequency modulation protocol maintained the muscle force by progressively increasing the activation frequency from 30 to 60Hz, whereas the frequency followed by intensity modulation protocol used a constant 60-Hz frequency and progressively increased the stimulation intensity. Based on the force–frequency relationship of the quadriceps muscle of subjects with SCI,23 all newly recruited motor units in the intensity modulation portion of the frequency followed by intensity modulation protocol were activated at close to their maximal force-generating capacity. Once again, these higher forces would have been metabolically more demanding for each muscle fiber than the initial lower frequencies used during the frequency modulation portion of the intensity followed by frequency modulation protocol. In addition, both the higher stimulation frequency41,42 and resulting greater number of stimulation pulses43 delivered to the muscle during the intensity modulation portion of the frequency followed by intensity modulation protocol have been shown to be related to greater muscle fatigue during electrically elicited contractions. Thus, the higher frequency of stimulation explains the poorer performance during the intensity modulation portion of the frequency followed by intensity modulation protocol compared with the frequency modulation portions of the intensity followed by frequency modulation protocol. Both the differences in the metabolic demand and activation frequency experienced by each activated muscle fiber during each protocol can be used to account for the overall poorer performance of the frequency followed by intensity modulation protocol versus the intensity followed by frequency modulation protocol.
Based on a previous study34 from our laboratory that used able-bodied subjects, we hypothesized that during the initial portion of each protocol, increasing the stimulation frequency would produce more successful contractions than increasing the intensity. In contrast, we found that initially increasing the intensity produced more successful contractions than initially increasing the frequency. We believe that the differences in the results between the present study and our previous work34 were primarily due to the differences in the protocols used by the 2 studies. In the previous study,34 for the frequency modulation protocol, we fixed the stimulation intensity at 600µs and adjusted the stimulation frequency (≈13Hz) to produce the initial targeted peak force (20% of the subject’s maximum voluntary isometric contraction); for the intensity modulation protocol, we fixed the stimulation frequency at 60Hz and adjusted the stimulation intensity (≈143µs) to produce the initial targeted peak. The stimulation frequency or intensity was then progressively increased until each reached 60Hz or 600µs, respectively. In contrast, the current study used an initial low intensity (≈218µs) and a 30-Hz frequency for both stimulation protocols. Thus, the frequency modulation protocol of the previous study used a much longer pulse duration, which would have recruited many more motor units and would have been less fatiguing for each active muscle fiber, compared with the frequency modulation portion of the present frequency followed by intensity modulation protocol. Similarly, the intensity modulation portion of the present intensity followed by frequency modulation protocol used a lower frequency during modulation of intensity than the previous study’s intensity modulation protocol (30Hz vs 60Hz). Thus, it appears that the lower intensity used in the present study for the frequency modulation portion of the frequency followed by intensity modulation protocol was more detrimental to maintenance of the force than the 30-Hz frequency we selected to be used during the intensity modulation portion of the intensity followed by frequency modulation protocol.
The initial frequency of 30Hz was selected for the present study because our recently completed work with the able-bodied subjects’ quadriceps femoris muscles34 found that starting at 30Hz produced more successful contractions than starting at other clinically relevant frequencies (20 or 40Hz). Two major factors, low-frequency fatigue and the available operational range for frequency modulation, were used to explain the effect of starting frequency on muscle force maintenance during repetitive electric stimulation.34 Although previous studies have reported changes in muscle contractile properties and fatigability after SCI,24,25,37,44 a recently published study from our laboratory23 investigating the force-frequency relationship of paralyzed human quadriceps muscles showed only a slight leftward shift in the force-frequency relationship compared with age-matched able-bodied subjects when the muscles were not fatigued and only minor rightward shift was seen in the fatigued condition. This similar force-frequency relationship between persons with SCI and age-matched able-bodied subjects led us to believe that 30Hz was probably also the best initial frequency for paralyzed quadriceps femoris muscles when progressively increasing both intensity and frequency to maintain muscle force output during repetitive activation. We therefore selected 30Hz as the initial frequency for both stimulation protocols tested in the current study.
In addition to the differences in the protocols, the differences in the results between the present study and our previous work34 may have been related to differences in the contractile properties and fatigability of muscles of able-bodied versus SCI subjects. Future studies will need to explore this possibility.
Study Limitations
Because the present study included only SCI subjects during isometric contractions, future work should be conducted in other patient populations who may also benefit from FES application. Future studies will also need to test nonisometric contractions that more closely mimic functional tasks and test other functionally relevant muscle groups to determine how broadly the present results can be generalized.
CONCLUSIONS
To our knowledge, the present study was the first to investigate the effectiveness of progressively increasing frequency, intensity, and the combination of the 2 on paralyzed quadriceps femoris muscle force maintenance during repetitive activation. Our results show that for paralyzed quadriceps femoris muscles, the better stimulation strategy first increased the stimulation intensity and then increased the stimulation frequency. The present results also support the suggestion that, after the stimulation intensity has been maximally increased, increasing the stimulation frequency to maintain muscle force may help to extend the duration of FES applications in people with SCI.
Acknowledgments
We thank Ramu Perumal, PhD, and Ryan D. Maladen, MS, for the development of hardware and software for data acquisition.
Supported by the National Institutes of Health (grant no. HD-36379).
APPENDIX 1: MODULATION STEP CALCULATION
The modulation steps for stimulation frequency and intensity were identified for each subject based on their force-frequency and force-intensity relationships, respectively. The same calculation method was used for the frequency and intensity modulation steps. Below is an example for calculating the stimulation intensity steps. First, an exponential equation,
| (1) |
was used to fit each of the force-intensity relationship curves, where parameter A is the scaling factor for the force (F), PD represents the duration of the stimulation pulse (in µs). PD0 represents the threshold pulse duration (in µs) above which there is a measurable force. τ is the time constant controlling the rise of the force with increasing pulse duration. Because muscles cannot generate negative forces, F equals 0 when PD≤PD0. A recently completed study in our laboratory34 comparing the parameter values found that the value for both PD0, threshold pulse duration, and τ, rate of rise in force with increasing pulse duration, were consistent across frequencies and fatigue conditions and that only A, the scaling factor, changed with changes in stimulation frequency or muscle fatigue, suggesting that the normalized force-intensity relationships stay the same and the relationship could be modeled by varying only 1 parameter in the exponential equation. This consistency in the normalized force-intensity relationship curve across stimulation frequencies and conditions enabled us to predict the required stimulation intensity for a targeted force level during the fatiguing protocols tested in the current study. Five steps were needed to determine each modulation step (fig 4).
Fig 4.
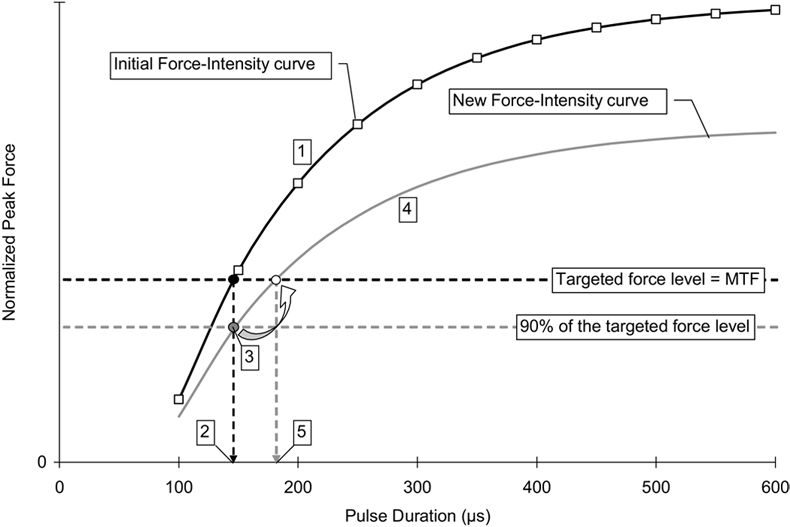
Example for the determination of stimulation intensity modulation steps based on the force-intensity relationship curve for a typical subject. The force-intensity relationship curve (black curve) was fitted with equation 1, and the parameter values for A, PD0, and τ were then determined for each subject. The starting pulse duration was determined by locating the pulse duration that produces peak force equal to the subject’s maximal twitch force (MTF) (black point). When the peak force dropped to 90% of the subject’s maximal twitch force (gray point), a new curve (gray curve) representing the new relationship between force output and stimulation intensity could then be determined by calculating the new A value. (From the results of a previous study,34 only A value changes with fatigue). By locating the pulse duration that produces peak force equal to the subject’s maximal twitch force from the new force-intensity relationship curve, the next intensity modulation step was determined. NOTE. Not drawn to scale. See text for details.
Step 1: The force-intensity relationship curve (black curve) was fitted with equation 1, and the parameter values for A, PD0, and τ for the force-intensity relationship curve were determined.
Step 2: The starting pulse duration was identified by locating the pulse duration that produced peak force equal to a subject’s maximal twitch force (black point). The stimulation trains were delivered at a rate of 1 train per second; therefore, muscle peak force output gradually declined because of muscle fatigue.
Step 3: Stimulation intensity was modulated when the peak force dropped below 90% of a subject’s maximal twitch force (gray point).
Step 4: When the peak force dropped below 90% of a subject’s maximal twitch force, a new curve that represented the relationship between force output and stimulation intensity at that point of time could then be identified. Based on our previous study, only parameter A changed with fatigue. Thus, with all other parameter values were known, the new A value for the new force-intensity relationship curve (gray curve) that passes through the 90% maximal twitch force data point could then be determined.
Step 5: By locating the pulse duration that produced peak force equal to a subject’s maximal twitch force from the new force-intensity relationship curve, the next modulation step for intensity was determined.
These steps were repeated until the pulse duration reached 600µs (fig 5). To produce peak forces to reach a subject’s maximal twitch force, the last predicted modulation step for stimulation intensity might exceed 600µs. In that case, we used 600µs for the last modulation steps because these values could still produce peak forces above 90% of a subject’s maximal twitch force. After the stimulation intensity reached the highest values (600µs), stimulation was stopped when peak forces dropped below 90% of a subject’s maximal twitch force. The same calculation method was used to determine the frequency modulation steps for each fatiguing protocol for each subject.
Fig 5.
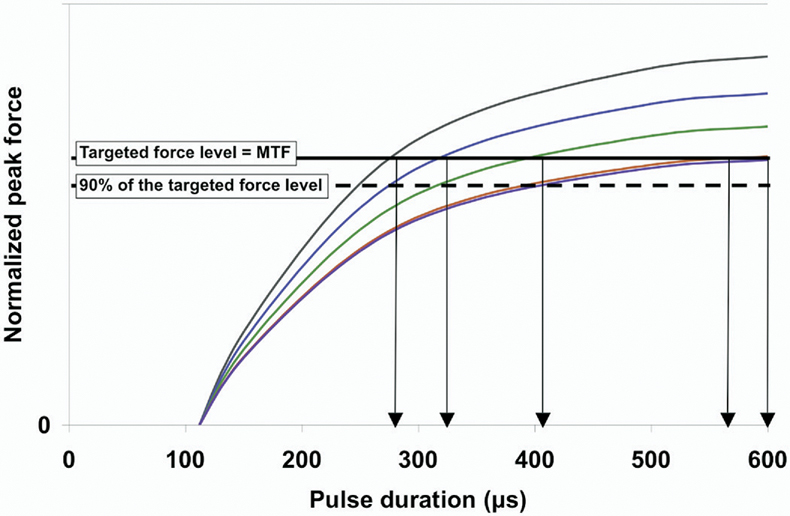
Family of force-intensity relationship curves for a typical subject. The force-intensity relationship shifted down with fatigue. As shown by the arrows, the intensity modulation steps were determined by locating the intersection between the force-intensity curves and the maximal twitch force dashed line.
Studies investigating the force-frequency relationship of skeletal muscles for able-bodied subjects showed that a right-ward shift in the normalized force-frequency curve was usually observed after muscle fatigue (for examples, please see Binder-Macleod and colleagues45,46). However, a recently published study23 from our laboratory investigating the force-frequency relationship for paralyzed skeletal muscles showed that although the force-frequency relationship shifted to the right after muscle fatigue, the shift was less than in the control group and most of the shift occurred at 30Hz and lower. In the current study, the timing for modulating frequency occurred when only minimal fatigue was present (muscle peak forces dropped from 100% to 90% of a subject’s maximal twitch forces); therefore, we believe that only minor shift in the force-frequency relationship would be observed at the beginning of each of the fatiguing protocols. In addition, stimulation frequency was progressively increased; after the frequency reached 30Hz or higher, the shift in the force-frequency relationship was minimal and could be ignored. Thus, both the minimal shift in the force-frequency relationship at the beginning of the protocol and the progressive increase in frequency with each modulation step could overcome the gradual shift in the force-frequency relationship with fatigue, and the change in the force-frequency relationship with fatigue should have little effect on the frequency modulation step prediction when using our calculation method described above. Thus, for simplicity, we used the same methods to calculate frequency modulation steps.
Footnotes
Publisher's Disclaimer: This article appeared in a journal published by Elsevier. The attached copy is furnished to the author for non-commercial research and education use, including for instruction at the authors institution and sharing with colleagues.
Other uses, including reproduction and distribution, or selling or licensing copies, or posting to personal, institutional or third party websites are prohibited.
In most cases authors are permitted to post their version of the article (e.g. in Word or Tex form) to their personal website or institutional repository. Authors requiring further information regarding Elsevier’s archiving and manuscript policies are encouraged to visit: http://www.elsevier.com/copyright
No commercial party having a direct financial interest in the results of the research supporting this article has or will confer a benefit upon the authors or upon any organization with which the authors are associated.
Suppliers
KinCom; Chattecx Corp, 6426 Morning Glory Dr, Harrison, TN 37341.
Grass Technologies, Astro-Med Industrial Pk, 600 E Greenwich Ave, West Warwick, RI 02893.
National Instruments, 11500 N Mopac Expwy, Austin, TX 78759-3504.
Versa-Stim; Conmed Corp, 525 French Rd, Utica, NY 13502.
References
- 1.Liberson WT, Holmquest HJ, Scot D, Dow M. Functional electrotherapy: stimulation of the peroneal nerve synchronized with the swing phase of the gait of hemiplegic patients. Arch Phys Med Rehabil. 1961;42:101–105. [PubMed] [Google Scholar]
- 2.Wilder RP, Wind TC, Jones EV, Crider BE, Edlich RF. Functional electrical stimulation for a dropped foot. J Long Term Eff Med Implants. 2002;12:149–159. [PubMed] [Google Scholar]
- 3.van der Aa HE, Bultstra G, Verloop AJ, et al. Application of a dual channel peroneal nerve stimulator in a patient with a “central” drop foot. Acta Neurochir Suppl. 2002;79:105–107. doi: 10.1007/978-3-7091-6105-0_23. [DOI] [PubMed] [Google Scholar]
- 4.Agarwal S, Kobetic R, Nandurkar S, Marsolais EB. Functional electrical stimulation for walking in paraplegia: 17-year follow-up of 2 cases. J Spinal Cord Med. 2003;26:86–91. doi: 10.1080/10790268.2003.11753666. [DOI] [PubMed] [Google Scholar]
- 5.Saigal R, Renzi C, Mushahwar VK. Intraspinal microstimulation generates functional movements after spinal-cord injury. IEEE Trans Neural Syst Rehabil Eng. 2004;12:430–440. doi: 10.1109/TNSRE.2004.837754. [DOI] [PubMed] [Google Scholar]
- 6.Creasey GH, Ho CH, Triolo RJ, et al. Clinical applications of electrical stimulation after spinal cord injury. J Spinal Cord Med. 2004;27:365–375. doi: 10.1080/10790268.2004.11753774. [DOI] [PubMed] [Google Scholar]
- 7.Kim CM, Eng JJ, Whittaker MW. Effects of a simple functional electric system and/or a hinged ankle-foot orthosis on walking in persons with incomplete spinal cord injury. Arch Phys Med Rehabil. 2004;85:1718–1723. doi: 10.1016/j.apmr.2004.02.015. [DOI] [PMC free article] [PubMed] [Google Scholar]
- 8.Mihelj M, Munih M. Unsupported standing with minimized ankle muscle fatigue. IEEE Trans Biomed Eng. 2004;51:1330–1340. doi: 10.1109/TBME.2004.827560. [DOI] [PubMed] [Google Scholar]
- 9.Pierce SR, Laughton CA, Smith BT, Orlin MN, Johnston TE, McCarthy JJ. Direct effect of percutaneous electric stimulation during gait in children with hemiplegic cerebral palsy: a report of 2 cases. Arch Phys Med Rehabil. 2004;85:339–343. doi: 10.1016/s0003-9993(03)00473-8. [DOI] [PubMed] [Google Scholar]
- 10.Stein RB. Functional electrical stimulation after spinal cord injury. J Neurotrauma. 1999;16:713–717. doi: 10.1089/neu.1999.16.713. [DOI] [PubMed] [Google Scholar]
- 11.Thrasher TA, Flett HM, Popovic MR. Gait training regimen for incomplete spinal cord injury using functional electrical stimulation. Spinal Cord. 2006;44:357–361. doi: 10.1038/sj.sc.3101864. [DOI] [PubMed] [Google Scholar]
- 12.Isakov E, Mizrahi J, Najenson T. Biomechanical and physiological evaluation of FES-activated paraplegic patients. J Rehabil Res Dev. 1986;23:9–19. [PubMed] [Google Scholar]
- 13.Peckham PH, Knutson JS. Functional electrical stimulation for neuromuscular applications. Annu Rev Biomed Eng. 2005;7:327–360. doi: 10.1146/annurev.bioeng.6.040803.140103. [DOI] [PubMed] [Google Scholar]
- 14.Popovic MR, Curt A, Keller T, Dietz V. Functional electrical stimulation for grasping and walking: indications and limitations. Spinal Cord. 2001;39:403–412. doi: 10.1038/sj.sc.3101191. [DOI] [PubMed] [Google Scholar]
- 15.Adams GR, Harris RT, Woodard D, Dudley GA. Mapping of electrical muscle stimulation using MRI. J Appl Physiol. 1993;74:532–537. doi: 10.1152/jappl.1993.74.2.532. [DOI] [PubMed] [Google Scholar]
- 16.Blair EA, Erlanger J. A comparison of the characteristics of axons through their individual electrical responses. Am J Physiol. 1933;106:524–564. [Google Scholar]
- 17.Heyters M, Carpentier A, Duchateau J, Hainaut K. Twitch analysis as an approach to motor unit activation during electrical stimulation. Can J Appl Physiol. 1994;19:451–461. doi: 10.1139/h94-037. [DOI] [PubMed] [Google Scholar]
- 18.Trimble MH, Enoka RM. Mechanisms underlying the training effects associated with neuromuscular electrical stimulation. Phys Ther. 1991;71:273–280. doi: 10.1093/ptj/71.4.273. discussion 280-2. [DOI] [PubMed] [Google Scholar]
- 19.Sinacore DR, Delitto A, King DS, Rose SJ. Type II fiber activation with electrical stimulation: a preliminary report. Phys Ther. 1990;70:416–422. doi: 10.1093/ptj/70.7.416. [DOI] [PubMed] [Google Scholar]
- 20.Burnham R, Martin T, Stein R, Bell G, MacLean I, Steadward R. Skeletal muscle fibre type transformation following spinal cord injury. Spinal Cord. 1997;35:86–91. doi: 10.1038/sj.sc.3100364. [DOI] [PubMed] [Google Scholar]
- 21.Castro MJ, Apple DF, Jr, Staron RS, Campos GE, Dudley GA. Influence of complete spinal cord injury on skeletal muscle within 6 mo of injury. J Appl Physiol. 1999;86:350–358. doi: 10.1152/jappl.1999.86.1.350. [DOI] [PubMed] [Google Scholar]
- 22.Round JM, Barr FM, Moffat B, Jones DA. Fibre areas and histochemical fibre types in the quadriceps muscle of paraplegic subjects. J Neurol Sci. 1993;116:207–211. doi: 10.1016/0022-510x(93)90327-u. [DOI] [PubMed] [Google Scholar]
- 23.Scott WB, Lee SC, Johnston TE, Binkley J, Binder-Macleod SA. Contractile properties and the force-frequency relationship of the paralyzed human quadriceps femoris muscle. Phys Ther. 2006;86:788–799. [PubMed] [Google Scholar]
- 24.Shields RK. Fatigability, relaxation properties, and electromyographic responses of the human paralyzed soleus muscle. J Neurophysiol. 1995;73:2195–2206. doi: 10.1152/jn.1995.73.6.2195. [DOI] [PubMed] [Google Scholar]
- 25.Thomas CK. Fatigue in human thenar muscles paralysed by spinal cord injury. J Electromyogr Kinesiol. 1997;7:15–26. doi: 10.1016/s1050-6411(96)00020-x. [DOI] [PubMed] [Google Scholar]
- 26.Person RS, Kudina LP. Discharge frequency and discharge pattern of human motor units during voluntary contraction of muscle. Electroencephalogr Clin Neurophysiol. 1972;32:471–483. doi: 10.1016/0013-4694(72)90058-2. [DOI] [PubMed] [Google Scholar]
- 27.Thomas CK, del Valle A. The role of motor unit rate modulation versus recruitment in repeated submaximal voluntary contractions performed by control and spinal cord injured subjects. J Electromyogr Kinesiol. 2001;11:217–229. doi: 10.1016/s1050-6411(00)00055-9. [DOI] [PubMed] [Google Scholar]
- 28.Lyons GM, Wilcox DJ, Lyons DJ, Hilton D. Evaluation of a drop foot stimulator FES intensity envelope matched to tibialis anterior muscle activity during walking. Proceedings of the 5th Annual IFESS Conference; 2000; Jun 18–21; Aalborg (Sweden). pp. 448–451. [Google Scholar]
- 29.Mourselas N, Granat MH. Correction of foot drop using a fuzzy logic controlled miniature stimulator. Proceedings of 5th Annual IFESS Conference; 2000; Jun 18–20; Aalborg (Denmark). pp. 456–457. [Google Scholar]
- 30.Prochazka A, Wiles CM. Electrical stimulation of paretic leg muscle in man, allowing feedback controlled movements to be generated from the wrist. J Physiol. 1983;343:20–21. [Google Scholar]
- 31.Stanić U, Trnkoczy A, Aćimović R, Gros N. Effect of gradually modulated electrical stimulation on the plasticity of artificial evoked movements. Med Biol Eng Comput. 1977;15:62–66. doi: 10.1007/BF02441576. [DOI] [PubMed] [Google Scholar]
- 32.Kebaetse MB, Binder-Macleod SA. Strategies that improve human skeletal muscle performance during repetitive, non-isometric contractions. Pflugers Arch. 2004;448:525–532. doi: 10.1007/s00424-004-1279-0. [DOI] [PubMed] [Google Scholar]
- 33.Kebaetse MB, Lee SC, Johnston TE, Binder-Macleod SA. Strategies that improve paralyzed human quadriceps femoris muscle performance during repetitive, nonisometric contractions. Arch Phys Med Rehabil. 2005;86:2157–2164. doi: 10.1016/j.apmr.2005.06.011. [DOI] [PubMed] [Google Scholar]
- 34.Chou LW. New strategies to maintain paralyzed muscle force output during repetitive electrical stimulation [dissertation] Newark: Univ Delaware; 2006. [Google Scholar]
- 35.Crago PE, Peckham PH, Mortimer JT, Van der Meulen JP. The choice of pulse duration for chronic electrical stimulation via surface, nerve, and intramuscular electrodes. Ann Biomed Eng. 1974;2:252–264. doi: 10.1007/BF02368496. [DOI] [PubMed] [Google Scholar]
- 36.Barnett S, Cooney K, Johnston R. Electrically elicited quadriceps femoris muscle torque as a function of various electrode placements. J Clin Electrophysiol. 1991;3:3–8. [Google Scholar]
- 37.Gerrits HL, De Haan A, Hopman MT, van der Woude LH, Jones DA, Sargeant AJ. Contractile properties of the quadriceps muscle in individuals with spinal cord injury. Muscle Nerve. 1999;22:1249–1256. doi: 10.1002/(sici)1097-4598(199909)22:9<1249::aid-mus13>3.0.co;2-n. [DOI] [PubMed] [Google Scholar]
- 38.Kernell D, Sjoholm H. Recruitment and firing rate modulation of motor unit tension in a small muscle of the cat’s foot. Brain Res. 1975;98:57–72. doi: 10.1016/0006-8993(75)90509-0. [DOI] [PubMed] [Google Scholar]
- 39.Botterman BR, Iwamoto GA, Gonyea WJ. Gradation of isometric tension by different activation rates in motor units of cat flexor carpi radialis muscle. J Neurophysiol. 1986;56:494–506. doi: 10.1152/jn.1986.56.2.494. [DOI] [PubMed] [Google Scholar]
- 40.Kesar T, Chou LW, Binder-Macleod SA. Effects of stimulation frequency versus pulse duration modulation on muscle fatigue. J Electromyogr Kinesiol. doi: 10.1016/j.jelekin.2007.01.001. In press. [DOI] [PMC free article] [PubMed] [Google Scholar]
- 41.Jones DA. High-and low-frequency fatigue revisited. Acta Physiol Scand. 1996;156:265–270. doi: 10.1046/j.1365-201X.1996.192000.x. [DOI] [PubMed] [Google Scholar]
- 42.Jones DA, Bigland-Ritchie B, Edwards RH. Excitation frequency and muscle fatigue: mechanical responses during voluntary and stimulated contractions. Exp Neurol. 1979;64:401–413. doi: 10.1016/0014-4886(79)90279-6. [DOI] [PubMed] [Google Scholar]
- 43.Marsden CD, Meadows JC, Merton PA. “Muscular wisdom” that minimizes fatigue during prolonged effort in man: peak rates of motoneuron discharge and slowing of discharge during fatigue. Adv Neurol. 1983;39:169–211. [PubMed] [Google Scholar]
- 44.Thomas CK. Contractile properties of human thenar muscles paralyzed by spinal cord injury. Muscle Nerve. 1997;20:788–799. doi: 10.1002/(sici)1097-4598(199707)20:7<788::aid-mus2>3.0.co;2-3. [DOI] [PubMed] [Google Scholar]
- 45.Binder-Macleod SA, McDermond LR. Changes in the force-frequency relationship of the human quadriceps femoris muscle following electrically and voluntarily induced fatigue. Phys Ther. 1992;72:95–104. doi: 10.1093/ptj/72.2.95. [DOI] [PubMed] [Google Scholar]
- 46.Binder-Macleod SA, Lee SC, Fritz AD, Kucharski LJ. New look at force-frequency relationship of human skeletal muscle: effects of fatigue. J Neurophysiol. 1998;79:1858–1868. doi: 10.1152/jn.1998.79.4.1858. [DOI] [PubMed] [Google Scholar]