

Abstract
Huntington’s disease is a neurodegenerative disorder, caused by an elongation of CAG repeats in the huntingtin gene. Mice with an insertion of an expanded polyglutamine repeat in the mouse huntingtin gene (knock-in mice) most closely model the disease because the mutation is expressed in the proper genomic and protein context. However, few knock-in mouse lines have been extensively characterized and available data suggest marked differences in the extent and time course of their behavioral and pathological phenotype. We have previously described behavioral anomalies in the open field as early as 1 month of age, followed by the appearance at 2 months of progressive huntingtin neuropathology, in a mouse carrying a portion of human exon 1 with approximately 140 CAG repeats inserted into the mouse huntingtin gene. Here we extend these observations by showing that early behavioral anomalies exist in a wide range of motor (climbing, vertical pole, rotarod, and running wheel performance) and non-motor functions (fear conditioning and anxiety) starting at 1–4 months of age, and are followed by progressive gliosis and decrease in DARPP32 (12 months) and a loss of striatal neurons at 2 years. At this age, mice also present striking spontaneous behavioral deficits in their home cage. The data show that this line of knock-in mice reproduces canonical characteristics of Huntington’s disease, preceded by deficits which may correspond to the protracted pre-manifest phase of the disease in humans. Accordingly, they provide a useful model to elucidate early mechanisms of pathophysiology and the progression to overt neurodegeneration.
Keywords: climbing, running wheel, psychiatric, atrophy, gliosis, DARPP-32
Huntington’s disease (HD) is an autosomal dominant neurodegenerative disorder, which causes motor, cognitive and psychiatric changes in affected patients. The disease is caused by an elongation of the normal run of triplet repeats (CAG, encoding glutamine) in the huntingtin gene, which is found on chromosome 4 (The Huntington's Disease Collaborative Research Group, 1993). Several clinical studies have shown the existence of behavioral and pathological changes that precede the onset of clinically manifest HD (Duff et al., 2007, Hinton et al., 2007, Solomon et al., 2007, Tai et al., 2007). Indeed motor, cognitive, sensory and striatal volume changes have now been shown to develop and progress up to 20 years prior to disease diagnosis, in mutation-carrying individuals (Paulsen et al., 2007).
Genetic mouse models are particularly useful in studying early effects of disease-causing mutations that are usually not accessible for analysis in humans. Many different genetic mouse models of HD have been generated to date (Hickey and Chesselet, 2003, Gray et al., 2008), including several lines of knock-in (KI) mice in which the expanded CAG repeat is placed within the correct genomic context of the murine HD homologue (Hdh) (Menalled, 2005). Interestingly, previous studies suggest a wide range of time course in the development of behavioral deficits in various KI lines, stressing the need to fully characterize the phenotype of individual lines prior to further studies. Differences are particularly striking in the age of onset of the earliest reported behavioral deficits, with a deficit in grip strength reported at 1.5 months in one line with 150 CAG repeats inserted into the mouse gene (Woodman et al., 2007), but no deficit in muscle power is noted in mice with the same mutation in another background (Heng et al., 2007). Several studies have reported cognitive impairments (Trueman et al., 2007, Trueman et al., 2008) and subtle balance and motor coordination deficits (Kennedy et al., 2003) at 4 months in various other KI lines.
We have previously observed motor deficits as early as 1 month of age in homozygous KI mice with a chimeric mouse/human exon 1 with 140 CAG repeats inserted into the Hdh gene (Menalled et al., 2003), while KI mice carrying 94 CAG repeats show similar defects starting at 2 months (Menalled et al., 2002). Neuropathology in the form of nuclear accumulation of huntingtin was evident shortly after the onset of behavioral deficits in CAG 94 and CAG140 KI mice, and was followed by the occurrence of huntingtin aggregates in nuclei and neuropil (Menalled et al., 2002, Menalled et al., 2003). In addition, a marked decrease in mRNA encoding enkephalin was detected in the striatum of 4 month old 94 CAG repeat mice (Menalled et al., 2000), suggesting that transcriptional dysregulation, a major pathological effect of mutated huntingtin (Kuhn et al., 2007, Woodman et al., 2007) is also present at an early age in these mice.
Here we expand the characterization of these mice by examining 1) neuropathological changes in the striatum at an advanced age to determine whether the mice reproduce the canonical striatal loss characteristic of HD; and 2) a wide range of behavioral functions at an early age to determine the extent of neuronal dysfunction occurring in these mice prior to the onset of neurodegeneration.
Experimental Procedures
Animals
All procedures were carried out in accordance with the NIH Guide for the Care and Use of Laboratory Animals (NIH Publications No. 80-23) revised 1996, and were approved by the Institutional Animal Care and Use Committee at UCLA. The KI mice contained a chimeric mouse/human exon 1 with 140 CAG repeats inserted into the mouse gene by homologous targeting (Menalled et al., 2003). As reported in other HD mouse models (Wheeler et al., 1999), the CAG repeat length was unstable with successive breeding and the repeat length from a sample population of the mice used in this study was 121 ± 2 (n=12, Laragen Inc., Culver City, CA), reduced from the original description of 140 CAGs. A sample of 28 other KIs from our colony shows a CAG repeat length of 119 ± 1.3, thus our measurement is very likely representative of our colony. Mice were housed in groups of up to 4 in a temperature and humidity controlled room. Food and water were available ad lib and mice were kept on a 12:12 h light:dark cycle. Mice used in this study were on a mixed C57BL/6J × 129/Sv background (N2–N3 on C57BL/6J). All KI mice used in this study were homozygous for the mutation. The large majority of mice used in this study were generated from heterozygote breeding pairs (only non-sibling breeding pairs were used), and WT littermates of the KI mice were used as controls. A small subgroup (n= 18) of the mice used for testing were generated from homozygote KI X heterozygote or heterozygote X WT breeding pairs.
Pathological Analyses
Preparation of Tissue
Male mice aged 20–26 m (approx 23 m, WT n=7, KI n=4) were used for volume measurements and striatal neuronal counts. Male mice were also used for immunocytochemical staining (4 m, n=4–5, 1 yr, n=3–4, 20–26 m, n=4–7). Mice were perfused with 4% paraformaldehyde, their brains dissected out and postfixed overnight. Brains were then cryoprotected in 30% sucrose and frozen for analysis. Coronal cryosections (35µm) were cut and sections stored in cyroprotectant for use.
Stereology
Sections for volume analysis and for striatal neuron counting were stained using cresyl violet. The first section containing the striatum was noted for each brain. In order to eliminate any bias, the first section to be analyzed was chosen at random from the first ten sections containing the striatum. This section, and every 10th after, was used for analysis. The striatum was outlined in each of the sections of the series using StereoInvestigator V5.00. The program calculated the area of the outlined portion and the volume was calculated using the Cavalieri method. The optical fractionator method (Stereoinvestigator V5.00) was used to count striatal neurons in the same sections. Cell counts were performed at 100x using a 1.4 NA lens and 1.4 NA oil condenser, with a DVC real-time digital camera. Neurons were defined as having medium sized somas, and a large rounded nucleus, diffusely stained with cresyl violet. The counting frames were distributed using a sampling grid of 400 × 400 µm. Counting frame sizes were 50 µm × 50 µm × 6 µm. Counting frames contained ≈6–7 cells, and Gunderson coefficients of error were always less than 0.1.
Immunohistochemistry
Sections at the levels of approximately 1.34mm, 0.86 and −0.46mm to the bregma were used (Paxinos and Franklin, 2001). Immunohistochemical staining on free floating sections was performed as described (Menalled et al., 2003) with slight modifications. Sections were washed in 0.1M phosphate buffered saline (PBS) and then endogenous peroxidases were inactivated with 1% H2O2 in 0.1M PBS containing 0.5% Triton X-100, for 30 min. Sections were blocked in 3% bovine serum albumin and 2% normal goat serum in 0.1M PBS containing 0.2% Triton X-100. Sections were then incubated overnight at room temperature in the same blocking solution containing primary antisera (anti-DARPP-32, 1/2000, Chemicon International, Temecula, CA; anti-GFAP, 1/2000, DAKO, Carpinteria, CA). The following day, the unbound primary antisera was washed off using 0.1M PBS and the sections were incubated in biotinylated goat anti-rabbit antibody, diluted in blocking solution, for 2 hours at room temperature (1:200, Vector Laboratories, Burlingame, CA; or 1:500, ICN Biomedicals, Inc., Aurora, OH). Following washes with 0.1M PBS, sections were then incubated with avidin-biotin complex (Vectastain Elite ABC kit) in PBS containing 0.2% Triton X-100. Sections were then incubated with a 0.03% 3-3′-diaminobenzidine tetrahydrochloride (Sigma Aldrich, St. Louis, MO) and 0.0003% H2O2 in 0.1 M Tris buffer solution, pH 7.6. Following rinses in the Tris buffer, sections were mounted onto gelatin coated glass slides, dehydrated, defatted and mounted with Eukitt (Calibrated Instruments, Hawthorne, NY). Separate immunostainings were carried out for each age timepoint. Development times and experimental conditions were rigorously controlled and to prevent bias, only “within age” statistical comparisons were made. Control sections for each mouse, omitting the primary antibody, were processed along with experimental sections. No specific staining was observed in these sections.
Optical density measurements of striatal DARPP-32 immunostaining was carried out on digitized sections, with NIH ImageJ 1.36b. For graphic representation, the optical density for each mouse (WT and KI) was expressed as a percent of the group WT mean for each age, but raw data were used for analysis. Sections stained with GFAP were coded and scored on a scale of 1 to 6 by a blinded observer, for density of GFAP-positive cells in the cortex, striatum, corpus callosum and globus pallidus.
Digital Image processing
Images were taken using a PC computer equipped with Spot Advanced (V 3.5.4, Diagnostic Instruments, Sterling Heights, MI) software, and a Zeiss Axioskop microscope. Digital images were imported into Adobe Photoshop (V 10.0.1, San Diego, CA) and cropped, and then placed in montages, using Adobe Photoshop CS3 extended V 10.0.1.
Behavioral Tests
Upon entry to a new room for behavior testing, mice were habituated for 20–30 min. For all tests, the genotypes of the mice were unknown to the experimenter during the behavioral and videotape analysis. All equipment was cleaned using Power-Cide Plus between individual tests (Intercem Corporation, Anaheim, CA), except for fear conditioning paradigm for which either 0.01% benzaldehyde or 0.01% diacetyl was used.
Scoring of spontaneous homecage behavior
Mice were scored for spontaneous homecage behavioral anomalies (Group 1: WT n = 5 (3M, 2F), KI n = 12 (4M, 8F); Group 2: WT n=8 (3M, 5F), KI N=15 (7M, 8F)). Mice were scored while in their homecages, during one 5 minute period, during the light phase, finishing at least 1 hour prior to lights off. Scoring was for presence or absence of shake/tremor, and presence or absence of an uncoordinated gait including difficulty with turning and wide-placed hindlimbs.
1. Behavioral Tests Performed during the Light Phase
The following behavioral analyses were all performed during the light cycle in mice maintained on a normal day-light cycle. Mixed, balanced gender groups were used for these tasks. All testing was completed at least one hour prior to the onset of the dark phase.
Climbing Cage Test
To assess motor coordination and spontaneous activity during the light phase, mice were placed in the bottom of wire cylinder cages (height 14 cm, diameter 12 cm, made from 1.3 cm square mesh). Spontaneous activity was videotaped for five minutes. The same group of mice was tested at 1.5, 2.5, 3.5, 4.5 and 6.5 months (WT n = 12 (6M, 6F); KI n = 11 (4M, 7F)). The number of climbs (all 4 paws on side of cage) and rears were quantified from these tapes.
Pole test
Mice tested for climbing were also examined for performance on a vertical pole (1 cm in diameter, 60 cm high) at 4.5 and at 7 months (WT n = 12 (6M, 6F); KI n = 11 (4M, 7F)). Mice placed on a vertical pole turn downwards and descend the pole. Mice were habituated to the task in 2 trials per day for 2 days. On test day (third day) 3 measures were taken over 5 trials per mouse: the total time taken to descend, the time taken to turn and the time taken to descend after turning.
Light/Dark Box Test
To gauge anxiety, the mice were tested in a light/dark box during the light phase at 1.5 and 7 months (WT n = 11 (7M, 4F); KI n = 11 (5M, 6F)). The box (46 cm long, 16.5 cm wide) consisted of two equal areas of light and dark, separated by an open door (6.3 cm × 7.6 cm). The mice were placed at the back of the dark area. The activity of the mice was videotaped for 5 mins. The time taken (latency) for a mouse to place all four paws in the light area was measured.
2. Behavioral Tests performed during the dark phase
The following behavioral analyses were performed in dim light in the middle of the dark phase in mice maintained on an inverted day-light cycle.
Rotarod
The rotarod apparatus (Ugo Basile, Varese, Italy) was used to measure motor coordination and balance. The same group of mice was tested at 4 and at 6 months (WT, n = 19 (10M, 9F); KI, n = 13 (4M, 9F)). Data from male and female mice were combined, as gender had no effect on rotarod performance (ANOVA performed on data from 4 month old mice, using 3 factors, genotype, speed and gender, effect of genotype F(1,28)=8.3, p<0.01, no effect of gender, genotype × gender interaction not significant). The latency for each mouse to fall off the rotarod was recorded, except in the case of clinging mice (see below) and used to generate group means. Two rotarods were used and the axle of one was covered with smooth rubber (denoted “smooth axle”). The other axle was left as manufactured, i.e. it was grooved (denoted “grooved axle”). During the training period (habituation), mice were trained to run on the smooth axle that was accelerated from 4 rpm to 40 rpm over 10 min (3 trials per day for 4 days, accelerating paradigm). Mice were then tested using the grooved axle rotarod with 1 trial each of 20, 30 and 40 rpm for 10 min (fixed speed paradigm). The grooves on the axle can lead to some clinging. Mice that cling no longer walk on the rotarod, therefore, to prevent data bias the small minority of mice presenting this clinging behavior were removed after 3 successive revolutions and that latency used for analysis. We did not compare data from mice that clung with those that did not, since the number of clinging mice was so small (less than 15%, no difference in number of mice between genotypes, that clung).
Fear conditioning
Only male mice (WT, n = 7; KI n = 8) were used for this test since estrogen levels and estrus cycle stage can affect memory and fear processing (Farr et al., 1995, Pearson and Lewis, 2005). Animals were trained as described in (Chaudhury and Colwell, 2002). The inside of each cage was wiped with 0.01% benzaldehyde before the start of each experiment. On the day of training, mice were placed individually into context cages and habituated for 3 min after which time animals received a 30 s tone (CS; 80 dB, 2.9 kHz) followed by a 2 s footshock (US, 0.2mA), followed by 64 s interval. This CS-US-64 s interval was repeated twice more, for a total of 3 training sessions. For the context recall test, animals were placed, individually, back into the same conditioning chamber and left there for 8 min, with no tone or footshock. The cages used for tone recall were made of Perspex (dark sides and clear back and ceiling) and were placed in a separate room. These cages were cleaned with 0.01% diacetyl prior to testing. For tone recall, mice were habituated for 4 min followed by the CS tone for 6 min. Context and tone recall took place 48 h following training. Background noise (70 dB) during acquisition, context and tone testing was provided by a ‘white’ noise generator. Freezing during acquisition, context and tone recall was defined as the complete absence of somatic and motility movements with the exception of respiratory movements. For acquisition, context and tone recall an 8 s time sampling procedure was used in which each animal was observed 8 times per 64 s period and these were averaged to yield an estimate of percentage time freezing (Chaudhury and Colwell, 2002).
Tail suspension test
(Steru et al., 1985). Mice (4.5 – 6m, WT: n = 13 (7M, 6F); KI: n = 13 (6M, 7F) were suspended by the tail for 6mins and their behavior video recorded for analysis. Latency to immobility and duration of immobility were measured. Tail length was similar between groups (effect of tail length, F(3,22) = 1.65, ns).
Forced swim test
(Porsolt et al., 1977). Mice (4.5 – 6m, WT: n = 13 (7M, 6F); KI: n = 13 (6M, 7F) were placed in 12cm of water (temperature 24 – 25°C) in a large plexiglass beaker and their behavior video taped for analysis. Latency to become immobile, duration of immobility and of swimming and number of fecal boli were calculated (boli were counted in real time).
3. Running wheel
Both male and female mice were used, but data were analyzed separately because estrus cycle influences running activity. Mice were tested repeatedly at 1, 4, 6 and 8 months of age (males: n = 12–13 at 1 and 6 months, 8–10 at 4 months, n = 3–5 at 8 months; females, n = 10–12 at 1 and 6 months, n = 9/group at 4 months, n = 5/group at 8 months). Running wheel apparatus was as for Hickey et al. (2005). Running activities per dark phase (or light phase) were compared and were also collapsed to generate a mean running speed per age. The first and last days in running wheels were not used because the full 24 h were not recorded for these days. Slopes were calculated from the formula (y2 - y1 / x2 - x1) where y2 = running speed on night 10 (x2 = 10) and y1 = running speed on night 2 (x1 = 2, from first full 24 h of data collection). Slope of mean running speed per day was used to indicate motor learning, as has been used for other motor tests (Van Raamsdonk et al., 2007). Breaks from running were calculated from raw data from night 7 through 9. For cycling in female mice, the dark phase with the highest mean running (peak) was used to align data sets (Kent et al., 1991). Most cycling female mice showed a 4 day cycle, thus data from the night of peak activity and 3 preceding nights were used per cycle, for comparison. Data from mice that did not show a cycle was divided chronologically into 4 d sets and used for analysis.
Statistics
Statistical analysis was performed using GB Stat (v8.0 for PC, Dynamic Microsystems Inc., Silver Spring, MD). In all cases, p < 0.05 was considered significant. Data collected over time were compared using repeated measures ANOVAs followed up by Fishers LSD post hoc tests for multiple comparisons (Thorne and Giesen, 2003). TST and PST data were analyzed using ANOVAs with genotype and gender as factors, and Fishers LSD was used for post hoc analysis. Climbing data was transformed by calculating the square root of raw data and statistics were then calculated. Outliers were detected using Grubbs test and removed. Light dark box data was compared using a one tailed Student’s t test for heteroscedastic data. Categorical data (spontaneous homecage behavior) was compared using Chi square independence tests. Power estimates of running speed were calculated using the power analysis option in GBstat (v8.0 for PC). Student’s t tests were used to compare neuronal counts, striatal volumes and DARPP-32 optical density with pooled or separate variances depending on the variances of the data sets. Mann Whitney U-tests were used for within-age comparisons GFAP data.
Results
Variation of repeat length is a common occurrence in KI as well as transgenic mice and careful evaluation of repeat length in mice used for experiments is necessary (Wheeler et al., 1999). Due to intergenerational instability the actual allele sizes in our colony are approximately 121 CAGs. However, we name this line “CAG140” for consistency because this was the original size of the repeat length introduced in the mouse HD gene and the name used in previous publications by us and others (Menalled et al., 2003, Dorner et al., 2007). Knock-in mice carrying 94 CAG repeats in a similar construct to the CAG140 mice (Menalled et al., 2002), show a very similar phenotype that develops at a slightly later age than in CAG140 mice. In addition, most kinds of aggregates in CAG94 KI mice are observed at a slightly later stage than in CAG140 mice. Thus, it is unlikely that the reduction of the repeat length by approximately 20 repeats will affect the development of phenotype or aggregates significantly compared to the cohort of mice examined in our previous study (Menalled et al., 2003).
Neurodegenerative changes in CAG140 knock-in mice – striatal neuronal loss and atrophy, neurochemical deficits and astrogliosis
We have previously demonstrated the presence of nuclear staining and neuropil and nuclear aggregates of huntingtin, a hallmark of HD pathology, in CAG140 mice starting as early as 2 months and increasing progressively with age (Menalled et al., 2003). To determine whether these mice later exhibited a loss of striatal neurons, a characteristic of manifest HD, we performed striatal neuronal counts in old (20 – 26m) CAG140 KI mice. At this age, KI mice show a 38% reduction in striatal volume and a 40% loss of striatal neurons compared to WT mice (Fig 1A, B). In addition to striatal atrophy, the brain weights of these KI mice were reduced by approximately 19%, indicating that while the striatum is much more severely affected, overall brain atrophy at this age is present, as is observed in late stage HD patient brains (WT, n=7; 0.48 ± 0.01g, KI, n=4; 0.39 ± 0.02g, p < 0.002).
Fig 1. KI mice show striatal neuronal loss and striatal atrophy.

A, The volume of the total striatum (1 hemisphere) was calculated in 20 – 26 m old WT and KI mice, and KI mice show 38% reduction in striatal volume in comparison to WT mice. B, Using the optical fractionator method, the number of striatal neurons over the entire striatum (1 hemisphere) in these mice was estimated, with KI mice showing 40% reduction in striatal neurons. Male mice, WT, n=7, KI, n=4. Data compared using Student’s t test, *p<0.01.
Having established that the hallmark of HD pathology (striatal degeneration) is observed in the mutant mice we then examined a marker of striatal neurons, DARPP-32, which is reduced in other mouse models of HD (Bibb et al., 2000, van Dellen et al., 2000). DARPP-32 immunoreactivity was normal at 4 months in the striatum of KI mice but was reduced by 41% at 1 yr, and 84% at 20 – 26m compared to WT (Mann Whitney U-test within-age comparisons, Fig 2).
Fig 2. DARPP-32 levels in WT and KI CAG140 mice.

A, Representative photomicrographs of DARPP-32 immunocytochemistry at 4 m, 12 m and 20–26 m (approx 23 m). B, WT and KI mice were grouped by age and the optical density of striatal staining for DARPP-32 was determined from digitized photomicrographs using ImageJ. DARPP-32 content for each mouse (WT and KI) was determined as a percent of the WT group mean. Within-age comparisons of raw data were carried out using Mann Whitney U-tests, * p<0.05. Male mice were used, 4 m WT n=4, KI n=5, 12 m WT n=3, KI n=4, 23 m WT n=6, KI n=4. Scale bar in A = 2 mm.
Astrogliosis, an additional hallmark of neuropathology in HD patient tissue, was also similar in mutant and WT animals at 4 months, but was clearly increased in KI cortex compared to WT at 1 yr (Mann Whitney U-test within-age comparisons, Fig 3). However, striatal gliosis was only increased in KI animals at 2 yrs, compared to age-matched WT (Mann Whitney U-test within-age comparisons, Fig 4). GFAP-immunoreactivity was not different in the corpus callosum or globus pallidus between KI and WT mice.
Fig 3. Cortical gliosis in WT and KI CAG140 mice.

A through F, Representative photomicrographs of GFAP immunoreactivity in the cortex of WT (A, C, E) and KI (B, D, F) mice at 4 m (A, B), 12 m (C, D) and 20–26 m (approx 23 m, E, F). Note the increased gliosis in KI mice at 12 m, with increased numbers of glia in the deeper cortical layers. By 23 m, gliosis is even more prominent in KI mice. Scale bar = 100 µm, applies to A through F. G, A blinded observer scored each of three sections per mouse for numbers of glia present, on a scale of 1 through 6. The average score per mouse was then used to generate group means. *, p<0.05, ** p<0.01. Male mice were used, 4 m WT n=4, KI n=5, 12 m WT n=3, KI n=4, 23 m WT n=7, KI n=5.
Fig 4. Late stage striatal gliosis in KI CAG140 mice.

A through F, Representative photomicrographs of GFAP immunoreactivity in the striatum of WT (A, C, E) and KI (B, D, F) mice at 4 m (A, B), 12 m (C, D) and 20–26 m (approx 23 m, E, F). Striatal gliosis is delayed in comparison to cortical gliosis (see Fig 3) and KI mice do not show increased striatal gliosis until 23 m. Scale bar = 100 µm, applies to A through F. G, A blinded observer scored each of 3 sections per mouse for numbers of glia present, on a scale of 1 through 6. The average score per mouse was then used to generate group means. * p<0.05. Male mice were used, 4 m WT n=4, KI n=5, 12 m WT n=3, KI n=4, 23 m WT n=7, KI n=5.
Late onset motor deficits – Spontaneous home cage behavioral anomalies
CAG140 KI mice have a normal life span, and every day handling revealed that up to 1 year of age, mice did not show any overt symptoms, as we have previously reported (Menalled et al., 2003). However, we noted that after 20 months of age KI mice became obviously impaired and could be discerned from WTs in their home cages. The proportion of mice showing an uncoordinated gait was significantly greater in the KI group (KI: 8/12, WT: 0/5, p<0.05, Chi square test). We confirmed this effect in a separate group of mice examined at 20–26 months of age, and further, found that KI mice showed tremor or shakiness (Table 1, p<0.01, Chi square test) as well as uncoordinated gait (Table 1, p<0.01, Chi square test). Only KI mice showed both tremor and uncoordinated gait (p < 0.05, Chi square test). Thus, the KI mice develop an overt phenotype, visible in the homecage that becomes obvious at an age when extensive (40%) striatal neuronal loss is present.
Table 1.
KI mice develop spontaneous homecage behavioral anomalies
Data from 20–26 month old mice, WT n=8 (3M, 5F), KI N=15 (7M, 8F),
p<0.05;
p<0.01, Chi square independence test.
Early onset motor deficits – Deficits in climbing, sensorimotor performance, rotarod and running wheel activity
To further characterize the early behavioral changes that are present in these mice (Menalled et al., 2003), KI and WT mice were examined in a variety of challenging motor tests between the ages of 1.5 and 8 m. Similar to our previous observations in the R6/2 transgenic HD mice (Hickey et al., 2005), one of the earliest deficits observed was in climbing. Indeed, climbing was persistently decreased in CAG140 KI mice, and the deficit was progressive over the ages of 1.5 – 6.5 m, with their performance at 6.5 m significantly lower than that at 1.5m (Fig 5A, effect of genotype, F(1,21)=4.5, p <0.05). Testing was carried out during the light phase and the reduced climbing was not due to reduced activity, since rearing was normal up to 4.5 m (Fig 5B). We have confirmed this climbing deficit in separate, larger groups of mice at 1.5 months of age (Hickey, Chesselet, unpublished) and have found no gender effect in this test.
Fig 5. Young KI mice climb less than WT mice and are impaired on the pole task and fixed speed rotarod paradigm.

A, KI mice attempt less climbs than WT mice from 1.5 months of age. * p<0.05, ** p<0.01 compared to WT group. B, However, activity levels are normal until 4.5 months, but by 6.5 months, KI mice rear less than WT mice in the climbing cage **, p<0.01. C, KI mice show sensorimotor deficits on the pole task at 4.5 months of age. ** p<0.01 compared to WT group at same age. Data shown are mean ± sem. WT n=12, KI n=11. D, KI and WT mice (4 months) were tested on the rotarod using fixed speeds and KI mice showed impaired performance at higher speeds, * p<0.05, ** p<0.01. Data are mean ± sem. WT n=19, KI n=13.
By 4 months of age, several other behavioral deficits became apparent, including sensorimotor performance on the vertical pole (tested at 4.5 and 7 m); balance and coordination on the rotarod (tested at 4 and 6m); and running speed and pattern on the running wheel (tested at 1, 4, 6 and 8m). Mice took longer to complete the pole task compared to WT controls at 4.5 m (Fig 5C, genotype × age interaction, F(1,21)=7, p<0.02). In addition, the time taken to descend after turning was increased in KI mice at 4.5 months (data not shown, genotype × age interaction, F(1,21)=8.02, p<0.05). This test also showed that at later ages the performance of WT controls deteriorates (4.5 m versus 7 m, p<0.05, Fishers LSD), obscuring genotype effects. This deterioration in performance with age, in normal mice, has been noted previously and highlights the importance of age in behavioral testing (Kurosaki et al., 2003).
Rotarod performance was not impaired in KI mice using the accelerating paradigm. Previously, we have shown that R6/2 transgenic mice, when tested using the smooth axle accelerating paradigm, can perform as well as wildtype mice yet still show impaired climbing and running wheel activity (Hickey et al., 2005). Therefore, here we further challenged the knock-in mice and tested them using a grooved axle, with increasing, fixed, speeds. Indeed, this paradigm did reveal an impairment in the KI mice, but larger group sizes were required to demonstrate this, showing that it is a subtle behavioral deficit in these mice (Fig 5D, non-accelerating paradigm, ANOVA performed on 4 m data, genotype × speed interaction, F(2,60)=3.83, p<0.05). Additionally, due to deteriorating performance in WT mice, the genotype deficit was again obscured at 6 m (data not shown).
For running wheel activity, we analyzed data separately for males and females, since running wheel performance is affected by gender and the estrous cycle (Kent et al., 1991, Kopp et al., 2006). Mice were tested on the running wheel at 1, 2 4, 6 and 8m and by 4 m male KI mice began to show deficits in running speed in the dark phase (Fig 6B, effect of nightly running F(8,128)=20.9, p<0.0001). By 6 m, a profound deficit was evident in male KI mice (Fig 6C, genotype × nightly running speed interaction F(8,184)=3.69, p<0.001), and this persisted at 8 m, despite a smaller group size tested at this age (data not shown, genotype × nightly running interaction, F(9,54)=2.6, p<0.02). In addition to running speed, running patterns was also profoundly affected, with KI mice taking longer breaks from running, and taking longer to start running in the dark phase at 6 months (Fig 6D). Behavior on the running wheel provided the highest power, with only 5 male mice required to detect a 50% improvement in performance at 6m (80% power, α = 0.05).
Fig 6. Male KI mice show progressive reduction in running wheel performance with age.

While no deficit in performance was detected at 1 month of age (A), slight deterioration was found at 4 months (B). By 6 months (C) KI mice show profoundly reduced running, accompanied by (D) an increase in the time taken to run when the lights go off (Time to initiate running) and increased lengths of break taken from running (Length of break). * p<0.05, ** p<0.01, *** p<0.001 compared to WT mice. Data shown are mean ± sem. n=8–13.
Female knock-in mice also showed deficits in performance by 4 months of age (Fig 7B, effect of nightly running F(8, 128) = 10.3, p<0.0001), which persisted at 6 m (Fig 7C, genotype × nightly running interaction F(13, 260) = 2.7, p<0.01) and became profoundly perturbed by 8 months (7E effect of nightly running F(14,112) = 2.2, p<0.02). When we examined the running patterns of our female mice in more detail, we noted that the mice displayed a distinct pattern of running, with increased running every 4–5 nights (most mice, when they showed a cycle, had a 4 night cycle). We attributed this pattern of running to their estrus cycle, as previous research has demonstrated a similar cycle in C57BL/6 mice (Kopp et al., 2006). When we aligned the data to this night of peak activity (Kent et al., 1991), the effect of cycle was blunted in female KI mice at 6 months and lost at 8 months (Fig 7D (6 months), effect of cycle F(2,40) = 17.5, p<0.0001, effect of cycle day, F(3, 60) = 20.2, p < 0.0001; Fig 7F (8 months), genotype × cycle interaction F(2,16) = 6.6, p < 0.01; genotype × cycle day interaction F(3,24) = 11.8, p < 0.0001). Thus, in this fully automated task, both male and female KI mice show disturbed patterns of running and exhibit deficits in motor performance.
Fig 7. Female KI mice show progressive reduction in dark phase running and deficits become more obvious when estrus cycle is taken into account.

At 1 month (A), similar to male KI mice, no deficit in performance in female KI mice is noted. However by 4 months (B), slight reductions in performance are detected. Unaligned nightly running of female WT and KI mice at (C) 6 and (E) 8 months of age. Raw data from (C) and (E) were then aligned to coordinate peak running. WT mice show a strong estrus cycle at 6 (D) and 8 (F) months. KI mice do show estrus cycling at 6 months, however they do not run as fast as their WT littermates, and by 8 months show no cycling at all. * p<0.05, ** p<0.01 compared to WTs. Data shown are mean ± sem. n=5–12.
Early onset emotional defects – Evidence of increased anxiety in the light dark box and in the fear conditioning paradigm
In order to assess emotional changes in these mice, we examined anxiety using the light dark box and the fear conditioning paradigms, and behavioral despair using the tail suspension test and the forced swim test. KI mice displayed increased latency to enter the light (WT 6.91±3.03s, KI 27.94±10.65s, p < 0.05, one tailed t test for heteroscedastic data), indicating increased anxiety, although we note that the within group variance was significantly greater in the KI group (p < 0.05). Mice were also tested at 7 months, however by this age there was a large variability in both groups, and there was no difference between groups.
Fear conditioning takes advantage of the ethologically validated freezing response of rodents to aversive stimuli (Fendt and Fanselow, 1999, Blanchard et al., 2001). We measured acquisition of fear-conditioned memory in male WT and KI mice (4–6 months of age). Over 3 CS-US training sessions mice were trained to associate a tone with a footshock, and both genotypes showed increased freezing with training, during the tone. However, KI mice showed more freezing, earlier, indicating that they were more fearful of the footshock (effect of training session, F(2,26)=4.22, p<0.03, data not shown). Both groups of mice responded to the actual footshock with immediate movement and squeaking and similar levels of tail rattle were observed in both WT and KI mice. Following footshock, both genotypes showed further increases in freezing, however, KI mice showed greater levels of freezing and this became highly significant by the third training session (Fig. 8A, effect of training session, F(2,26)=4.5, p<0.03). KI mice froze approximately 48% of the post shock period, in contrast to WT mice that froze 14% of their post shock period. Furthermore, a separate group of male KI mice also showed increased freezing compared with male WTs (effect of training session, (F(2,18)=15.9, p<0.001, freezing in third session WT 25 ± 8%, KI 42.5 ± 6.4% p<0.05, Fishers LSD).
Fig 8. Male KI mice show enhanced fear response during fear conditioning training and show evidence of motor learning impairment.

A, For fear conditioning mice were tested once, and were aged 4–6 months. During CS-US pairing (training) KI mice show increased fear in response to the footshock, in comparison to WT mice. **, p<0.01, compared to WT, same session. B, KI mice show less improvement over time in running wheel activity, as indicated by the reduced slope of their performance between night 2 and night 10 of running wheel exposure. * p<0.05, compared to WT mice. C, Context and tone recall for fear conditioning were tested 48 hours post training. Both genotypes show significantly increased freezing over baseline (habituation) values when exposed to the context within which training took place (left), or when exposed to the tone (CS, right). * p<0.05, **, p<0.01. For the context recall, mice were placed in the same chambers as they were trained in, thus habituation data shown here are from prior to training sessions. For tone recall, mice are placed in different cages, in a separate room, thus habituation data are from before tone being turned on. Data shown are mean ± sem. N = 8–13.
Behavioral despair was tested with the tail suspension test (Steru et al., 1985) and the forced swim test (Porsolt et al., 1977), two tests that are predictive of anti-depressant action and are used to model behavioral despair by measuring immobility during testing (Cryan and Mombereau, 2004). We found no evidence of depressive behavior in either test (Table 2).
Table 2.
No evidence of behavioral despair in the forced swim test (Porsolt swim test, PST) and tail suspension test (TST).
| Male | Female | |||
|---|---|---|---|---|
| WT (s) | KI (s) | WT (s) | KI (s) | |
| Duration of immobility (PST) | 114 ± 24 | 115 ± 38 | 136 ± 45 | 139 ± 28 |
| Duration of immobility (TST) | 143 ± 20 | 141 ± 20 | 104 ± 29 | 118 ± 24 |
Mice were aged 4.5 – 6 m. WT n= 13 (7M, 6F); KI n=13 (4M, 7F).
Cognitive performance in motor and emotional tasks
To assess cognitive performance, we examined learning components of the running wheel and fear conditioning tests described earlier. At 6 months, male KI mice are not only impaired on the running wheel, they also show slower improvement in running activity over time, when compared to WT mice (Fig 8B). Similarly, while 6 month old WT females ran faster on days 2.4 and 3.4 versus day 1.4 (Fig 7D, p < 0.01, Fishers LSD), KI performance did not improve. These data suggest that both male and female mice had motor learning defects. In contrast, recall of the fear conditioning paradigm was normal in the KI mice, since their response to tone alone, or context alone, was similar to WT mice (Fig 8C).
Discussion
Here, we show that the CAG140 line of mice shows multiple behavioral deficits up to 2 years before overt, spontaneous motor deficits in the homecage, and eventually displays striatal neuronal loss, a pathological hallmark of HD. Thus, these mice provide a slowly progressive phenotype amenable to mechanistic studies of successive phases of the disease. Indeed, there is increasing evidence of motor, cognitive and psychiatric dysfunction in pre-manifest carriers of the HD mutation (Kirkwood et al., 1999, Kirkwood et al., 2000a, Kirkwood et al., 2000b, Smith et al., 2000, Kirkwood et al., 2002, Duff et al., 2007, Hinton et al., 2007, Solomon et al., 2007). In addition, pathological changes (Gomez-Tortosa et al., 2001, Aylward et al., 2004, Rosas et al., 2005, Rosas et al., 2006) and neural dysfunction (Zimbelman et al., 2007) exist many years prior to estimated age at onset. These early changes are taking on increasing value as potential markers of therapeutic efficacy in clinical trials (Paulsen et al., 2007). The protracted period of behavioral dysfunction displayed by the KI mice, together with progressive huntingtin pathology (Menalled et al., 2003), provides a useful model for studying the early stages of HD and for preclinical drug testing.
Neurodegenerative changes
Only a handful of HD models, including one other KI line (Heng et al., 2007) reproduce the frank loss of striatal neurons observed in HD (Reddy et al., 1999, Slow et al., 2003, Stack et al., 2005, Kantor et al., 2006). Usually this phenotype is only observed in old mice, therefore our goal was not to provide a detailed time course of the striatal neuronal loss but to establish that this line of KI mice does exhibit the pathological hallmarks of HD. Our data indeed show a 40% striatal neuronal loss as measured with rigorous stereological methods at 20–26 months of age in KI mice. In addition, we observed a progressive loss of DARPP32, which is present in medium-sized spiny neurons of the striatum. These neurons are primarily vulnerable in HD and comprise 95% of all striatal neurons. The absence of DARPP32 decrease at 4 months establishes that there is no significant neuronal loss in the striatum at the age when the mice already show extensive dysfunction in tests of motor and non-motor behaviors (see below).
DARPP-32 levels are also reduced in other genetic models of HD (Bibb et al., 2000, van Dellen et al., 2000). This phosphoprotein is an important mediator of signaling cascades in dopaminoceptive neurons (Greengard, 2001), and it’s loss could contribute to reported alterations in dopaminergic signaling in HD mice (Bibb et al., 2000, van Dellen et al., 2000, Hickey et al., 2002, Petersén et al., 2002, Heng et al., 2007). Other pathological findings in humans with HD include cortical (Selemon et al., 1998) and striatal (Stevens et al., 1988) gliosis. Cortical gliosis was already significantly increased in KI mice by 1 year of age while striatal gliosis was only increased at 2 yrs. The delayed appearance of gliosis in the KI mice is compatible with the late onset of neurodegeneration in this model and with reports of striatal reactive gliosis in CAG150 homozygous mice, at approximately similar ages (Lin et al., 2001).
Motor impairments
As with other HD mouse models (Hickey et al., 2005) spontaneous overt homecage motor phenotypes were not observed until an old age (20 – 26 months) and consisted of obvious shake or tremor and qualitative impairment of gait. This supports and extends gait deficits measured quantitatively in these mice at 1 year (Menalled et al., 2003) and later (2 years of age) in the CAG 150 and HdhQ111 models (Wheeler et al., 2002, Heng et al., 2007). These deficits are also similar to those exhibited by the R6/2 transgenic mouse but this overt phenotype is also a very late manifestation of disease in these transgenic mice (Hickey et al., 2005).
In contrast to the late developing overt spontaneous home-cage motor phenotypes, motor performances on challenging behavioral tests were impaired at a much earlier age, extending our previous observations in the same line of mice (Menalled et al., 2003). Both in R6/2 transgenic mice (Hickey et al., 2005) and CAG140 KI mice, which display very different progression of phenotype, climbing is one of the earliest deficits observed and here we show that in CAG140 KI mice, as with R6/2 transgenic mice, the deficit is progressive.
At 4 m, sensorimotor performance was impaired in KI mice on the vertical pole task. On the rotarod, KI mice did not show any deficit in the accelerating paradigm, however deficits were revealed using a fixed speed paradigm (4 m), which has been shown to be more sensitive to striatal dysfunction (Monville et al., 2006). However, the deficits were subtle and larger group sizes were required to reveal them.
Running wheel activity takes advantage of a fully automated test. Spontaneous running deficits developed over time in the CAG140 mice starting with significant but small deficits at 4 m, in both male and female mice. By 6 m running became profoundly reduced in male KI mice and this deficit remained at 8 m, despite using smaller group sizes. Indeed, power analysis of running wheel data at 6 months showed that only 5 male mice are required to see a 50% change in running wheel performance at 6 months. The pattern of running in 6 m male KI mice was fragmented and disorganized and this is very much reminiscent of the progressive reduction in running wheel performance of transgenic R6/2 mice (Hickey et al., 2005). We did not find any differences in running wheel in the light, however this is not unexpected since rodents run very little in the light phase. Similarly, in R6/2 mice, night phase running deficits are much larger than; and precede; light phase deficits (Hickey et al., 2005). Our findings on the running wheel and in climbing activity of male KI mice are consistent with observations made by Dorner and colleagues (2007) in the same line of mice, with the exception of the gender interactions found by these authors with smaller number of animals than in our study.
Wheel running can be modulated by estrogen levels (Cotman and Engesser-Cesar, 2002, Ogawa et al., 2003) thus performance of female mice was analyzed separately to male mice. Running was reduced at 4 m and 6 m and became profoundly impaired at 8 m. We also noted that the mice showed a pattern of increased running every 4–5 nights (most mice, when they showed a cycle, had a 4 d cycle). This pattern has been described previously, and has been attributed to estrus cycle, with increased running at proestrous in rodents (Kent et al., 1991, Kopp et al., 2006). Indeed, running wheel activity has been used as a non-invasive method for monitoring estrus cycle in female rats (Kent et al., 1991). When we aligned the data to these nights of peak activity the deficit in female KI performance on the running wheel became more apparent. In aligned data, proestrus running was blunted in female KI mice by 6m, and by 8 m, female KI mice did not show cycling. Interestingly, many aspects of endocrine function are perturbed in HD (Petersén and Bjorkqvist, 2006) and indeed circulating levels of sex hormones are altered in a transgenic rat model of HD (Bode et al., 2008).
Non-motor behaviors; evidence of anxiety and motor-learning impairment
Importantly, CAG140 KI mice exhibited early non-motor anomalies, indicating that they express a broad range of behavioral deficits, similar to HD patients even in the pre-manifest phase of the disease (Duff et al., 2007, Marshall et al., 2007). Evidence for increased anxiety was observed in the light dark box and in the fear conditioning paradigm. The difference in variability between WT and KI groups at 1.5 months in the light dark box is reminiscent of the variable incidence of anxiety in HD (Paulsen et al., 2001). The effect was only observed at this early age, which is consistent with data showing that optimal results with the light dark box are achieved with young mice (Hascoet et al., 1999). Indeed, we also observed increased anxiety in young (4 weeks), but not old (8 weeks) male R6/2 transgenic mice (Hickey et al., 2005). In addition, we found that male KI mice showed an increased fear response during the training phase of fear conditioning. Alterations in fear conditioning response in the R6/2 model have been reported (Bolivar et al., 2003), however freezing, a well defined rodent response to aversive stimuli (Fendt and Fanselow, 1999, Blanchard et al., 2003), was not measured in that study. Mild stress induces an increased fear response during footshock (Griffin et al., 2003) and anxiolytics can reduce the fear response (Miyamoto et al., 2004). In addition, mutant mice that show neophobia in the novelty-suppressed feeding task and other anxiety behaviors also show increased freezing in response to footshock (Gross et al., 2000). This suggests that the increase in fear response in our mice may further indicate enhanced anxiety, at an early stage in disease progression.
Surprisingly, other HD mouse models displayed reduced (File et al., 1998, Naver et al., 2003, von Hörsten et al., 2003, Nguyen et al., 2006) or no change (Klivenyi et al., 2006) in anxiety. These differences may be due to the analysis of different phases of the disease in models with markedly different progression rates of pathology. We also tested our mice for depressive behavior using the tail suspension and the forced swim tests, which have a long history of use in the study of depression and of predicting anti-depressant action (Cryan and Mombereau, 2004, Cryan et al., 2005). Based on these tests, our mutant mice did not display any depression-like behavior.
No deficits were observed in the recall components of the fear conditioning task, indicating that long term memory for the context and CS was normal in KI mice. In contrast, both male and female KI mice showed impaired motor learning on the running wheel, again reminiscent of early changes in learning observed in pre-manifest HD (Feigin et al., 2006, Ghilardi et al., 2008).
In summary, the CAG140 KI mice reproduce key features of HD: an expanded CAG repeat within the full length huntingtin protein, expressed under the huntingtin promoter; progressive accumulation of huntingtin in the nucleus followed by huntingtin aggregates in the nucleus and the neuropil, and nuclear inclusions (Menalled et al., 2003); early and progressive motor dysfunction leading to overt deficits at an older age; non-motor anomalies suggestive of increased anxiety; motor learning deficits; reactive gliosis; loss of DARPP-32; brain and striatal atrophy; and finally loss of striatal neurons, a hallmark of advanced HD in humans. This ensemble of characteristics (see Table 3), in particular the slow progress of the phenotype, makes these mice a particularly useful model to decipher the succession of detrimental effects caused by the mutation, and to test neuroprotective treatments for HD.
Table 3.
Timeline of pathological and behavioral anomalies in CAGI40 KI mice
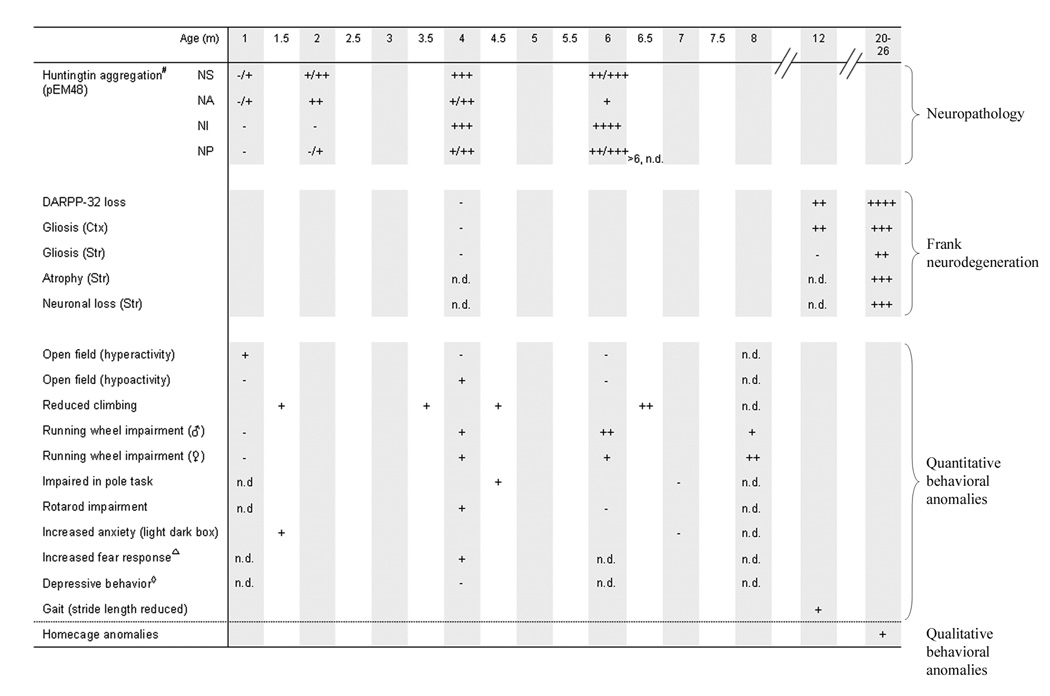 |
The top section shows the pattern of huntingtin aggregation in the striatum, pEM48, polyclonal EM48; NS, nuclear staining; NA, nuclear microaggregates; NI, nuclear inclusions; NP, neuropil aggregates. Ages greater than 6 m were not examined. The middle section shows the frank degenerative changes that occur in CAG140 homozygous mutuant KI mice, as described in this paper. The bottom section shows the behavioral anomalies in KI mice. Symbol (+) indicates presence of deficit or anomaly in behavioral measure (see row title) in comparison to WT mice. ΔFear conditioning measures in male mice aged 4–6 m. ◇Depressive behavior measured in mice aged 4.5–6m. #Indicate data previously published in Menalled et al., 2003. Please note than these observations were made in KI mice with 140CAG repeats; all other observations are from the present study, with mice carrying approximately 120 CAG repeats.
Acknowledgements
We thank Dr Chunni Zhu for helpful discussions. We also thank Ehud Gruen, Gowry Fernando and Zhongliang Zhao for their expert technical assistance with the mouse colony. We would also like to thank Star Lee, Shanna Fang and Sandra Thomasian for assistance with behavior. Finally, we thank Arkady Hagopian and Dr Christopher Colwell for their expert advice and helpful discussions in regard to the fear conditioning and running wheel paradigms.
Supported by: Cure HD Initiative, The HighQ Foundation and PHS grant R01 (NS41574).
Abbreviations
- KI
knock-in
- WT
wildtype
- HD
Huntington’s disease
- PBS
phosphate buffered saline
Footnotes
Publisher's Disclaimer: This is a PDF file of an unedited manuscript that has been accepted for publication. As a service to our customers we are providing this early version of the manuscript. The manuscript will undergo copyediting, typesetting, and review of the resulting proof before it is published in its final citable form. Please note that during the production process errors may be discovered which could affect the content, and all legal disclaimers that apply to the journal pertain.
Bibliography
- Aylward EH, Sparks BF, Field KM, Yallapragada V, Shpritz BD, Rosenblatt A, Brandt J, Gourley LM, Liang K, Zhou H, Margolis RL, Ross CA. Onset and rate of striatal atrophy in preclinical Huntington disease. Neurology. 2004;63:66–72. doi: 10.1212/01.wnl.0000132965.14653.d1. [DOI] [PubMed] [Google Scholar]
- Bibb JA, Yan Z, Svenningsson P, Snyder GL, Pieribone VA, Horiuchi A, Nairn AC, Messer A, Greengard P. Severe deficiencies in dopamine signaling in presymptomatic Huntington's disease mice. Proc Natl Acad Sci U S A. 2000;97:6809–6814. doi: 10.1073/pnas.120166397. [DOI] [PMC free article] [PubMed] [Google Scholar]
- Blanchard DC, Griebel G, Blanchard RJ. Mouse defensive behaviors: pharmacological and behavioral assays for anxiety and panic. Neurosci Biobehav Rev. 2001;25:205–218. doi: 10.1016/s0149-7634(01)00009-4. [DOI] [PubMed] [Google Scholar]
- Blanchard DC, Griebel G, Blanchard RJ. The Mouse Defense Test Battery: pharmacological and behavioral assays for anxiety and panic. Eur J Pharmacol. 2003;463:97–116. doi: 10.1016/s0014-2999(03)01276-7. [DOI] [PubMed] [Google Scholar]
- Bode FJ, Stephan M, Suhling H, Pabst R, Straub RH, Raber KA, Bonin M, Nguyen HP, Riess O, Bauer A, Sjoberg C, Petersen A, von Horsten S. Sex differences in a transgenic rat model of Huntington's disease: decreased 17ss-estradiol levels correlate with reduced numbers of DARPP32+ neurons in males. Hum Mol Genet. 2008 doi: 10.1093/hmg/ddn159. [DOI] [PubMed] [Google Scholar]
- Bolivar VJ, Manley K, Messer A. Exploratory activity and fear conditioning abnormalities develop early in R6/2 Huntington's disease transgenic mice. Behav Neurosci. 2003;117:1233–1242. doi: 10.1037/0735-7044.117.6.1233. [DOI] [PubMed] [Google Scholar]
- Chaudhury D, Colwell CS. Circadian modulation of learning and memory in fear-conditioned mice. Behav Brain Res. 2002;133:95–108. doi: 10.1016/s0166-4328(01)00471-5. [DOI] [PubMed] [Google Scholar]
- Cotman CW, Engesser-Cesar C. Exercise enhances and protects brain function. Exerc Sport Sci Rev. 2002;30:75–79. doi: 10.1097/00003677-200204000-00006. [DOI] [PubMed] [Google Scholar]
- Cryan JF, Mombereau C. In search of a depressed mouse: utility of models for studying depression-related behavior in genetically modified mice. Mol Psychiatry. 2004;9:326–357. doi: 10.1038/sj.mp.4001457. [DOI] [PubMed] [Google Scholar]
- Cryan JF, Mombereau C, Vassout A. The tail suspension test as a model for assessing antidepressant activity: review of pharmacological and genetic studies in mice. Neurosci Biobehav Rev. 2005;29:571–625. doi: 10.1016/j.neubiorev.2005.03.009. [DOI] [PubMed] [Google Scholar]
- Dorner JL, Miller BR, Barton SJ, Brock TJ, Rebec GV. Sex differences in behavior and striatal ascorbate release in the 140 CAG knock-in mouse model of Huntington's disease. Behav Brain Res. 2007;178:90–97. doi: 10.1016/j.bbr.2006.12.004. [DOI] [PMC free article] [PubMed] [Google Scholar]
- Duff K, Paulsen JS, Beglinger LJ, Langbehn DR, Stout JC. Psychiatric Symptoms in Huntington's Disease before Diagnosis: The Predict-HD Study. Biol Psychiatry. 2007 doi: 10.1016/j.biopsych.2006.11.034. [DOI] [PubMed] [Google Scholar]
- Farr SA, Flood JF, Scherrer JF, Kaiser FE, Taylor GT, Morley JE. Effect of ovarian steroids on footshock avoidance learning and retention in female mice. Physiol Behav. 1995;58:715–723. doi: 10.1016/0031-9384(95)00124-2. [DOI] [PubMed] [Google Scholar]
- Feigin A, Ghilardi MF, Huang C, Ma Y, Carbon M, Guttman M, Paulsen JS, Ghez CP, Eidelberg D. Preclinical Huntington's disease: compensatory brain responses during learning. Ann Neurol. 2006;59:53–59. doi: 10.1002/ana.20684. [DOI] [PMC free article] [PubMed] [Google Scholar]
- Fendt M, Fanselow MS. The neuroanatomical and neurochemical basis of conditioned fear. Neurosci Biobehav Rev. 1999;23:743–760. doi: 10.1016/s0149-7634(99)00016-0. [DOI] [PubMed] [Google Scholar]
- File SE, Mahal A, Mangiarini L, Bates GP. Striking changes in anxiety in Huntington's disease transgenic mice. Brain Res. 1998;805:234–240. doi: 10.1016/s0006-8993(98)00736-7. [DOI] [PubMed] [Google Scholar]
- Ghilardi MF, Silvestri G, Feigin A, Mattis P, Zgaljardic D, Moisello C, Crupi D, Marinelli L, Dirocco A, Eidelberg D. Implicit and explicit aspects of sequence learning in pre-symptomatic Huntington's disease. Parkinsonism Relat Disord. 2008 doi: 10.1016/j.parkreldis.2007.11.009. [DOI] [PMC free article] [PubMed] [Google Scholar]
- Gomez-Tortosa E, MascDonald ME, Friend JC, Taylor SA, Weiler LJ, Cupples LA, Srinidhi J, Gusella JF, Bird ED, Vonsattel JP, Myers RH. Quantitative neuropathological changes in presymptomatic Huntington's disease. Ann Neurol. 2001;49:29–34. [PubMed] [Google Scholar]
- Gray M, Shirasaki DI, Cepeda C, Andre VM, Wilburn B, Lu XH, Tao J, Yamazaki I, Li SH, Sun YE, Li XJ, Levine MS, Yang XW. Full-length human mutant huntingtin with a stable polyglutamine repeat can elicit progressive and selective neuropathogenesis in BACHD mice. J Neurosci. 2008;28:6182–6195. doi: 10.1523/JNEUROSCI.0857-08.2008. [DOI] [PMC free article] [PubMed] [Google Scholar]
- Greengard P. The neurobiology of dopamine signaling. Biosci Rep. 2001;21:247–269. doi: 10.1023/a:1013205230142. [DOI] [PubMed] [Google Scholar]
- Griffin WC, 3rd, Skinner HD, Salm AK, Birkle DL. Mild prenatal stress in rats is associated with enhanced conditioned fear. Physiol Behav. 2003;79:209–215. doi: 10.1016/s0031-9384(03)00097-0. [DOI] [PubMed] [Google Scholar]
- Gross C, Santarelli L, Brunner D, Zhuang X, Hen R. Altered fear circuits in 5-HT(1A) receptor KO mice. Biol Psychiatry. 2000;48:1157–1163. doi: 10.1016/s0006-3223(00)01041-6. [DOI] [PubMed] [Google Scholar]
- Hascoet M, Colombel MC, Bourin M. Influence of age on behavioural response in the light/dark paradigm. Physiol Behav. 1999;66:567–570. doi: 10.1016/s0031-9384(98)00333-3. [DOI] [PubMed] [Google Scholar]
- Heng MY, Tallaksen-Greene SJ, Detloff PJ, Albin RL. Longitudinal Evaluation of the Hdh(CAG)150 Knock-In Murine Model of Huntington's Disease. J Neurosci. 2007;27:8989–8998. doi: 10.1523/JNEUROSCI.1830-07.2007. [DOI] [PMC free article] [PubMed] [Google Scholar]
- Hickey MA, Chesselet M-F. The use of transgenic and knock-in mice to study Huntington's disease. Cytogenet Genome Res. 2003;100:276–286. doi: 10.1159/000072863. [DOI] [PubMed] [Google Scholar]
- Hickey MA, Gallant K, Gross GG, Levine MS, Chesselet M-F. Early behavioral deficits in R6/2 mice suitable for use in preclinical drug testing. Neurobiol Dis. 2005;20:1–11. doi: 10.1016/j.nbd.2005.01.024. [DOI] [PubMed] [Google Scholar]
- Hickey MA, Reynolds GP, Morton AJ. The role of dopamine in motor symptoms in the R6/2 transgenic mouse model of Huntington's disease. J Neurochem. 2002;81:46–59. doi: 10.1046/j.1471-4159.2002.00804.x. [DOI] [PubMed] [Google Scholar]
- Hinton SC, Paulsen JS, Hoffmann RG, Reynolds NC, Zimbelman JL, Rao SM. Motor timing variability increases in preclinical Huntington's disease patients as estimated onset of motor symptoms approaches. J Int Neuropsychol Soc. 2007;13:539–543. doi: 10.1017/S1355617707070671. [DOI] [PubMed] [Google Scholar]
- The Huntington's Disease Collaborative Research Group. A novel gene containing a trinucleotide repeat that is expanded and unstable on Huntington's disease chromosomes. Cell. 1993;72:971–983. doi: 10.1016/0092-8674(93)90585-e. [DOI] [PubMed] [Google Scholar]
- Kantor O, Temel Y, Holzmann C, Raber K, Nguyen HP, Cao C, Turkoglu HO, Rutten BP, Visser-Vandewalle V, Steinbusch HW, Blokland A, Korr H, Riess O, von Horsten S, Schmitz C. Selective striatal neuron loss and alterations in behavior correlate with impaired striatal function in Huntington's disease transgenic rats. Neurobiol Dis. 2006;22:538–547. doi: 10.1016/j.nbd.2005.12.014. [DOI] [PubMed] [Google Scholar]
- Kennedy L, Evans E, Chen CM, Craven L, Detloff PJ, Ennis M, Shelbourne PF. Dramatic tissue-specific mutation length increases are an early molecular event in Huntington disease pathogenesis. Hum Mol Genet. 2003;12:3359–3367. doi: 10.1093/hmg/ddg352. [DOI] [PubMed] [Google Scholar]
- Kent S, Hurd M, Satinoff E. Interactions between body temperature and wheel running over the estrous cycle in rats. Physiol Behav. 1991;49:1079–1084. doi: 10.1016/0031-9384(91)90334-k. [DOI] [PubMed] [Google Scholar]
- Kirkwood SC, Siemers E, Bond C, Conneally PM, Christian JC, Foroud T. Confirmation of subtle motor changes among presymptomatic carriers of the Huntington disease gene. Arch Neurol. 2000a;57:1040–1044. doi: 10.1001/archneur.57.7.1040. [DOI] [PubMed] [Google Scholar]
- Kirkwood SC, Siemers E, Hodes ME, Conneally PM, Christian JC, Foroud T. Subtle changes among presymptomatic carriers of the Huntington's disease gene. J Neurol Neurosurg Psychiatry. 2000b;69:773–779. doi: 10.1136/jnnp.69.6.773. [DOI] [PMC free article] [PubMed] [Google Scholar]
- Kirkwood SC, Siemers E, Stout JC, Hodes ME, Conneally PM, Christian JC, Foroud T. Longitudinal cognitive and motor changes among presymptomatic Huntington disease gene carriers. Arch Neurol. 1999;56:563–568. doi: 10.1001/archneur.56.5.563. [DOI] [PubMed] [Google Scholar]
- Kirkwood SC, Siemers E, Viken R, Hodes ME, Conneally PM, Christian JC, Foroud T. Longitudinal personality changes among presymptomatic Huntington disease gene carriers. Neuropsychiatry Neuropsychol Behav Neurol. 2002;15:192–197. [PubMed] [Google Scholar]
- Klivenyi P, Bende Z, Hartai Z, Penke Z, Nemeth H, Toldi J, Vecsei L. Behaviour changes in a transgenic model of Huntington's disease. Behav Brain Res. 2006;169:137–141. doi: 10.1016/j.bbr.2006.01.003. [DOI] [PubMed] [Google Scholar]
- Kopp C, Ressel V, Wigger E, Tobler I. Influence of estrus cycle and ageing on activity patterns in two inbred mouse strains. Behav Brain Res. 2006;167:165–174. doi: 10.1016/j.bbr.2005.09.001. [DOI] [PubMed] [Google Scholar]
- Kuhn A, Goldstein DR, Hodges A, Strand AD, Sengstag T, Kooperberg C, Becanovic K, Pouladi MA, Sathasivam K, Cha JH, Hannan AJ, Hayden MR, Leavitt BR, Dunnett SB, Ferrante RJ, Albin R, Shelbourne P, Delorenzi M, Augood SJ, Faull RL, Olson JM, Bates GP, Jones L, Luthi-Carter R. Mutant huntingtin's effects on striatal gene expression in mice recapitulate changes observed in human Huntington's disease brain and do not differ with mutant huntingtin length or wild-type huntingtin dosage. Hum Mol Genet. 2007 doi: 10.1093/hmg/ddm133. [DOI] [PubMed] [Google Scholar]
- Kurosaki R, Akasaka M, Michimata M, Matsubara M, Imai Y, Araki T. Effects of Ca2+ antagonists on motor activity and the dopaminergic system in aged mice. Neurobiol Aging. 2003;24:315–319. doi: 10.1016/s0197-4580(02)00085-4. [DOI] [PubMed] [Google Scholar]
- Lin CH, Tallaksen-Greene S, Chien WM, Cearley JA, Jackson WS, Crouse AB, Ren S, Li XJ, Albin RL, Detloff PJ. Neurological abnormalities in a knock-in mouse model of Huntington's disease. Hum Mol Genet. 2001;10:137–144. doi: 10.1093/hmg/10.2.137. [DOI] [PubMed] [Google Scholar]
- Marshall J, White K, Weaver M, Flury Wetherill L, Hui S, Stout JC, Johnson SA, Beristain X, Gray J, Wojcieszek J, Foroud T. Specific psychiatric manifestations among preclinical Huntington disease mutation carriers. Arch Neurol. 2007;64:116–121. doi: 10.1001/archneur.64.1.116. [DOI] [PubMed] [Google Scholar]
- Menalled L, Zanjani H, MacKenzie L, Koppel A, Carpenter E, Zeitlin S, Chesselet MF. Decrease in striatal enkephalin mRNA in mouse models of Huntington's disease. Exp Neurol. 2000;162:328–342. doi: 10.1006/exnr.1999.7327. [DOI] [PubMed] [Google Scholar]
- Menalled LB. Knock-in mouse models of Huntington's disease. NeuroRx. 2005;2:465–470. doi: 10.1602/neurorx.2.3.465. [DOI] [PMC free article] [PubMed] [Google Scholar]
- Menalled LB, Sison JD, Dragatsis I, Zeitlin S, Chesselet MF. Time course of early motor and neuropathological anomalies in a knock-in mouse model of Huntington's disease with 140 CAG repeats. J Comp Neurol. 2003;465:11–26. doi: 10.1002/cne.10776. [DOI] [PubMed] [Google Scholar]
- Menalled LB, Sison JD, Wu Y, Olivieri M, Li XJ, Li H, Zeitlin S, Chesselet MF. Early motor dysfunction and striosomal distribution of huntingtin microaggregates in Huntington's disease knock-in mice. J Neurosci. 2002;22:8266–8276. doi: 10.1523/JNEUROSCI.22-18-08266.2002. [DOI] [PMC free article] [PubMed] [Google Scholar]
- Miyamoto J, Tsuji M, Takeda H, Ohzeki M, Nawa H, Matsumiya T. Characterization of the anxiolytic-like effects of fluvoxamine, milnacipran and risperidone in mice using the conditioned fear stress paradigm. Eur J Pharmacol. 2004;504:97–103. doi: 10.1016/j.ejphar.2004.09.043. [DOI] [PubMed] [Google Scholar]
- Monville C, Torres EM, Dunnett SB. Comparison of incremental and accelerating protocols of the rotarod test for the assessment of motor deficits in the 6-OHDA model. J Neurosci Methods. 2006;158:219–223. doi: 10.1016/j.jneumeth.2006.06.001. [DOI] [PubMed] [Google Scholar]
- Naver B, Stub C, Moller M, Fenger K, Hansen AK, Hasholt L, Sorensen SA. Molecular and behavioral analysis of the R6/1 Huntington's disease transgenic mouse. Neuroscience. 2003;122:1049–1057. doi: 10.1016/j.neuroscience.2003.08.053. [DOI] [PubMed] [Google Scholar]
- Nguyen HP, Kobbe P, Rahne H, Worpel T, Jager B, Stephan M, Pabst R, Holzmann C, Riess O, Korr H, Kantor O, Petrasch-Parwez E, Wetzel R, Osmand A, von Horsten S. Behavioral abnormalities precede neuropathological markers in rats transgenic for Huntington's disease. Hum Mol Genet. 2006;15:3177–3194. doi: 10.1093/hmg/ddl394. [DOI] [PubMed] [Google Scholar]
- Ogawa S, Chan J, Gustafsson JA, Korach KS, Pfaff DW. Estrogen increases locomotor activity in mice through estrogen receptor alpha: specificity for the type of activity. Endocrinology. 2003;144:230–239. doi: 10.1210/en.2002-220519. [DOI] [PubMed] [Google Scholar]
- Paulsen JS, Langbehn DR, Stout JC, Aylward E, Ross CA, Nance M, Guttman M, Johnson S, McDonald M, Beglinger LJ, Duff K, Kayson E, Biglan K, Shoulson I, Oakes D, Hayden M. Detection of Huntington's disease decades before diagnosis: The Predict HD study. J Neurol Neurosurg Psychiatry. 2007 doi: 10.1136/jnnp.2007.128728. [DOI] [PMC free article] [PubMed] [Google Scholar]
- Paulsen JS, Ready RE, Hamilton JM, Mega MS, Cummings JL. Neuropsychiatric aspects of Huntington's disease. J Neurol Neurosurg Psychiatry. 2001;71:310–314. doi: 10.1136/jnnp.71.3.310. [DOI] [PMC free article] [PubMed] [Google Scholar]
- Paxinos G, Franklin KBJ. The mouse brain in stereotaxic coordinates. Florida: Academic Press; 2001. [Google Scholar]
- Pearson R, Lewis MB. Fear recognition across the menstrual cycle. Horm Behav. 2005;47:267–271. doi: 10.1016/j.yhbeh.2004.11.003. [DOI] [PubMed] [Google Scholar]
- Petersén Å, Bjorkqvist M. Hypothalamic-endocrine aspects in Huntington's disease. Eur J Neurosci. 2006;24:961–967. doi: 10.1111/j.1460-9568.2006.04985.x. [DOI] [PubMed] [Google Scholar]
- Petersén Å, Puschban Z, Lotharius J, NicNiocaill B, Wiekop P, O'Connor WT, Brundin P. Evidence for dysfunction of the nigrostriatal pathway in the R6/1 line of transgenic Huntington's disease mice. Neurobiol Dis. 2002;11:134–146. doi: 10.1006/nbdi.2002.0534. [DOI] [PubMed] [Google Scholar]
- Porsolt RD, Le Pichon M, Jalfre M. Depression: a new animal model sensitive to antidepressant treatments. Nature. 1977;266:730–732. doi: 10.1038/266730a0. [DOI] [PubMed] [Google Scholar]
- Reddy PH, Charles V, Williams M, Miller G, Whetsell WO, Jr, Tagle DA. Transgenic mice expressing mutated full-length HD cDNA: a paradigm for locomotor changes and selective neuronal loss in Huntington's disease. Philos Trans R Soc Lond B Biol Sci. 1999;354:1035–1045. doi: 10.1098/rstb.1999.0456. [DOI] [PMC free article] [PubMed] [Google Scholar]
- Rosas HD, Hevelone ND, Zaleta AK, Greve DN, Salat DH, Fischl B. Regional cortical thinning in preclinical Huntington disease and its relationship to cognition. Neurology. 2005;65:745–747. doi: 10.1212/01.wnl.0000174432.87383.87. [DOI] [PubMed] [Google Scholar]
- Rosas HD, Tuch DS, Hevelone ND, Zaleta AK, Vangel M, Hersch SM, Salat DH. Diffusion tensor imaging in presymptomatic and early Huntington's disease: Selective white matter pathology and its relationship to clinical measures. Mov Disord. 2006;21:1317–1325. doi: 10.1002/mds.20979. [DOI] [PubMed] [Google Scholar]
- Selemon LD, Rajkowska G, Goldman-Rakic PS. Elevated neuronal density in prefrontal area 46 in brains from schizophrenic patients: application of a three-dimensional, stereologic counting method. J Comp Neurol. 1998;392:402–412. [PubMed] [Google Scholar]
- Slow EJ, van Raamsdonk J, Rogers D, Coleman SH, Graham RK, Deng Y, Oh R, Bissada N, Hossain SM, Yang YZ, Li XJ, Simpson EM, Gutekunst CA, Leavitt BR, Hayden MR. Selective striatal neuronal loss in a YAC128 mouse model of Huntington disease. Hum Mol Genet. 2003;12:1555–1567. doi: 10.1093/hmg/ddg169. [DOI] [PubMed] [Google Scholar]
- Smith MA, Brandt J, Shadmehr R. Motor disorder in Huntington's disease begins as a dysfunction in error feedback control. Nature. 2000;403:544–549. doi: 10.1038/35000576. [DOI] [PMC free article] [PubMed] [Google Scholar]
- Solomon AC, Stout JC, Johnson SA, Langbehn DR, Aylward EH, Brandt J, Ross CA, Beglinger L, Hayden MR, Kieburtz K, Kayson E, Julian-Baros E, Duff K, Guttman M, Nance M, Oakes D, Shoulson I, Penziner E, Paulsen JS. Verbal episodic memory declines prior to diagnosis in Huntington's disease. Neuropsychologia. 2007;45:1767–1776. doi: 10.1016/j.neuropsychologia.2006.12.015. [DOI] [PMC free article] [PubMed] [Google Scholar]
- Stack EC, Kubilus JK, Smith K, Cormier K, Del Signore SJ, Guelin E, Ryu H, Hersch SM, Ferrante RJ. Chronology of behavioral symptoms and neuropathological sequela in R6/2 Huntington's disease transgenic mice. J Comp Neurol. 2005;490:354–370. doi: 10.1002/cne.20680. [DOI] [PubMed] [Google Scholar]
- Steru L, Chermat R, Thierry B, Simon P. The tail suspension test: a new method for screening antidepressants in mice. Psychopharmacology (Berl) 1985;85:367–370. doi: 10.1007/BF00428203. [DOI] [PubMed] [Google Scholar]
- Stevens CD, Altshuler LL, Bogerts B, Falkai P. Quantitative study of gliosis in schizophrenia and Huntington's chorea. Biol Psychiatry. 1988;24:697–700. doi: 10.1016/0006-3223(88)90144-8. [DOI] [PubMed] [Google Scholar]
- Tai YF, Pavese N, Gerhard A, Tabrizi SJ, Barker RA, Brooks DJ, Piccini P. Microglial activation in presymptomatic Huntington's disease gene carriers. Brain. 2007;130:1759–1766. doi: 10.1093/brain/awm044. [DOI] [PubMed] [Google Scholar]
- Thorne BM, Giesen JM. Statistics for the Behavioral Sciences. New York: McGraw-Hill Higher Education; 2003. [Google Scholar]
- Trueman RC, Brooks SP, Jones L, Dunnett SB. The operant serial implicit learning task reveals early onset motor learning deficits in the Hdh knock-in mouse model of Huntington's disease. Eur J Neurosci. 2007;25:551–558. doi: 10.1111/j.1460-9568.2007.05307.x. [DOI] [PubMed] [Google Scholar]
- Trueman RC, Brooks SP, Jones L, Dunnett SB. Time course of choice reaction time deficits in the Hdh(Q92) knock-in mouse model of Huntington's disease in the operant Serial Implicit Learning Task (SILT) Behav Brain Res. 2008 doi: 10.1016/j.bbr.2008.01.020. [DOI] [PubMed] [Google Scholar]
- van Dellen A, Welch J, Dixon RM, Cordery P, York D, Styles P, Blakemore C, Hannan AJ. N-Acetylaspartate and DARPP-32 levels decrease in the corpus striatum of Huntington's disease mice. Neuroreport. 2000;11:3751–3757. doi: 10.1097/00001756-200011270-00032. [DOI] [PubMed] [Google Scholar]
- Van Raamsdonk JM, Metzler M, Slow E, Pearson J, Schwab C, Carroll J, Graham RK, Leavitt BR, Hayden MR. Phenotypic abnormalities in the YAC128 mouse model of Huntington disease are penetrant on multiple genetic backgrounds and modulated by strain. Neurobiol Dis. 2007;26:189–200. doi: 10.1016/j.nbd.2006.12.010. [DOI] [PubMed] [Google Scholar]
- von Hörsten S, Schmitt I, Nguyen HP, Holzmann C, Schmidt T, Walther T, Bader M, Pabst R, Kobbe P, Krotova J, Stiller D, Kask A, Vaarmann A, Rathke-Hartlieb S, Schulz JB, Grasshoff U, Bauer I, Vieira-Saecker AM, Paul M, Jones L, Lindenberg KS, Landwehrmeyer B, Bauer A, Li XJ, Riess O. Transgenic rat model of Huntington's disease. Hum Mol Genet. 2003;12:617–624. doi: 10.1093/hmg/ddg075. [DOI] [PubMed] [Google Scholar]
- Wheeler VC, Auerbach W, White JK, Srinidhi J, Auerbach A, Ryan A, Duyao MP, Vrbanac V, Weaver M, Gusella JF, Joyner AL, MacDonald ME. Length-dependent gametic CAG repeat instability in the Huntington's disease knock-in mouse. Hum Mol Genet. 1999;8:115–122. doi: 10.1093/hmg/8.1.115. [DOI] [PubMed] [Google Scholar]
- Wheeler VC, Gutekunst CA, Vrbanac V, Lebel LA, Schilling G, Hersch S, Friedlander RM, Gusella JF, Vonsattel JP, Borchelt DR, MacDonald ME. Early phenotypes that presage late-onset neurodegenerative disease allow testing of modifiers in Hdh CAG knock-in mice. Hum Mol Genet. 2002;11:633–640. doi: 10.1093/hmg/11.6.633. [DOI] [PubMed] [Google Scholar]
- Woodman B, Butler R, Landles C, Lupton MK, Tse J, Hockly E, Moffitt H, Sathasivam K, Bates GP. The Hdh(Q150/Q150) knock-in mouse model of HD and the R6/2 exon 1 model develop comparable and widespread molecular phenotypes. Brain Res Bull. 2007;72:83–97. doi: 10.1016/j.brainresbull.2006.11.004. [DOI] [PubMed] [Google Scholar]
- Zimbelman JL, Paulsen JS, Mikos A, Reynolds NC, Hoffmann RG, Rao SM. fMRI detection of early neural dysfunction in preclinical Huntington's disease. J Int Neuropsychol Soc. 2007;13:758–769. doi: 10.1017/S1355617707071214. [DOI] [PubMed] [Google Scholar]