

Abstract
CD4+ regulatory T (Treg) cells have been involved in impaired immunity and persistence of viral infections. Herein, we report the level, phenotype and activation status of Treg cells in patients chronically infected with human immunodeficiency virus (HIV) and/or hepatitis C virus (HCV). Expression of CD25, CD45RA, CD27, CD127 and CD38 was assessed on these cells using polychromatic flow cytometry in 20 healthy controls, 20 HIV-monoinfected, 20 HCV-monoinfected and 31 HIV/HCV-co-infected patients. Treg cells were defined as CD4+forkhead box P3 (FoxP3)+. The percentage of Treg cells was increased significantly in HIV patients compared with controls. Moreover, there was a significant inverse correlation between CD4 counts and Treg cell levels. Fewer than 50% of Treg cells expressed CD25, with differences in terms of CD127 expression between CD25+ and CD25(–) Treg cells. CD4+Foxp3+ Treg cells displayed predominantly a central memory phenotype (CD45RA–CD27+), without differences between patients and healthy controls. Activated Treg cells were increased in HIV patients, particularly considering the central memory subset. In summary, HIV infection, but not HCV, induces an up-regulation of highly activated Treg cells, which increases in parallel with CD4 depletion. Hypothetically, this might contribute to the accelerated course of HCV-related liver disease in HIV-immunosuppressed patients.
Keywords: Regulatory T cells, HIV/HCV co-infection, FoxP3, activation
Introduction
Human immunodeficiency virus (HIV) and hepatitis C virus (HCV) are two of the most relevant persistent infections afflicting the human population. Control of viral replication in both HIV and HCV infections has been associated with the cellular component of the host immune response [1–4]. However, a hallmark of chronic HIV and HCV infections is an impaired specific effector T cell response [5–8]. Several mechanisms have been proposed to explain this abnormal effector immune response [9,10], an altered activity of regulatory T (Treg) cells being the most recently postulated [11–13]. These cells play a critical role in maintaining the delicate balance between preventing immunopathology and allowing the immune response to clear infections. Certain viruses have evolved mechanisms to alter the immunosuppressive role of Treg cells, helping them to evade immunological destruction [14].
Regulatory T cells have been defined previously as a subset of CD4+ T lymphocytes, expressing CD25 (interleukin-2 receptor α-chain) on the cell surface [15–18]. This cell subset represents 5–10% of peripheral CD4+ T lymphocytes in humans [19–21]. Experimental findings support that an altered function of CD4+CD25+ Treg cells may be an important factor for the establishment of chronicity in some viral infections [11], including HIV and HCV. They may suppress virus-specific CD8+ T cell effector immune responses, such as cellular proliferation and interferon (IFN)-γ production [13,22–24]. In this way, Treg cell responses appear to favour the pathogen and be detrimental to the host. In agreement, different groups have analysed levels of Treg cells in both HIV [22,23,25,26] and HCV infections [13,24,27,28]. Most have found an increased frequency of CD4+CD25+ Treg cells in chronically HIV- [23,25,26] and HCV-infected patients [13,24,27], supporting an important role for Treg cells in HIV and HCV persistence.
Although CD25 has been the most used marker to enumerate Treg cells [13,22–28], the CD4+CD25+ phenotype is not Treg cell-specific, because CD25 can also be expressed by activated T cells during immune responses associated with infections [29,30]. Moreover, some CD25(–) T cells also display regulatory activity [31,32].
Currently, the most definitive/unambiguous marker available to identify naturally occurring Treg cells is the forkhead box transcription factor FoxP3 [33–36], which is expressed by CD25+ Treg cells, as well as by CD25(–) T cells with regulatory activity. This transcription factor is thought to programme the development and function of this cell subset [32–36]. Considering Treg cells to be the subset of CD4+ T cells expressing FoxP3 may avoid the inconvenience of including non-regulatory CD25+ effector T cells within the Treg cell subset.
Herein, we evaluated levels, phenotype and activation status of Treg cells, using FoxP3 as its specific marker, in patients infected chronically with HIV and/or HCV. Furthermore, the phenotype of this cell subset was characterized based on CD25 and CD127 markers; the maturation stage was assessed based on the expression of CD27 and CD45RA and its activation status by expression of CD38.
Materials and methods
Study population
A cross-sectional study was conducted on 91 individuals attending Carlos III Hospital (Madrid, Spain). The study population included HIV-monoinfected (n = 20), HCV-monoinfected (n = 20) and HIV/HCV-co-infected (n = 31) patients, as well as healthy controls (n = 20). HCV patients in both mono- and co-infected groups were IFN-naive and positive for serum HCV-RNA. Overall, 67% of HIV patients were on anti-retroviral therapy. Healthy controls were HIV- and HCV-seronegative. To participate in the study, written informed consent was obtained from all individuals, and the study protocol was evaluated and approved by the hospital ethical committee.
Viral load measurements
Plasma HCV-RNA was measured using a real-time polymerase chain reaction assay (COBAS TaqMan 48; Roche, Barcelona, Spain), which has a lower limit of detection of 15 IU/ml. Plasma HIV-RNA was measured using Versant HIV-1 RNA version 3.0 (Siemens, Barcelona, Spain), which has a lower limit of detection of 50 copies/ml.
T lymphocyte subsets
Peripheral blood mononuclear cells (PBMC) were isolated from fresh ethylenediamine tetraacetic acid-anti-coagulated blood by density gradient centrifugation using Ficoll-Hypaque (Sigma Chemical Co., St Louis, MO, USA) and frozen in fetal calf serum plus 10% dimethylsulphoxide. Cells were kept frozen in liquid nitrogen until the moment of the study. The viability of thawed PBMC was always greater than 85%.
Regulatory T cells were defined as CD4+ T cells expressing FoxP3. Level, phenotype and activation status of this cell subset were examined ex vivo in PBMC from HCV-monoinfected, HIV-monoinfected and HCV/HIV-co-infected patients and from healthy controls by five-colour flow cytometry. Their phenotype was characterized based on CD25 and CD127 markers, their maturation stage based on the expression of CD27 and CD45RA, and their activation status considering the expression of CD38.
Peripheral blood mononuclear cells were stained for surface and intracellular markers with the following antibodies for flow-cytometry analysis: anti-CD4–phycoerythin (PE)CY7 (SFCI12T4D11; Beckman Coulter, Fullerton, CA, USA), anti-CD25–PECY5 (M-A251; BD Biosciences, San Diego, CA), anti-FoxP3-fluorescein isothiocyanate (PCH101; e-Bioscience, San Diego, CA, USA), anti-CD127-PE (R34.34; Beckman Coulter, Fullerton, CA, USA), anti-CD45RA-energy-coupled dye (2H4; Beckman Coulter, Fullerton, CA, USA), anti-CD27-PE (M-T271; BD Biosciences) and anti-CD38-PECY5 (LS198-4-3; Beckman Coulter).
One million PBMC were washed with 2 ml of phosphate-buffered saline (PBS) and stained for surface markers by incubation with the appropriate antibody for 30 min at 4°C. Cells were then washed with 2 ml of PBS and resuspended in 250 µl Cytofix/Cytoperm solution (BD Biosciences) for 20 min at 4°C. The permeabilized cells were washed with 2 ml of Perm/Wash Buffer (BD Biosciences) and stained for intracellular FoxP3 marker at 4°C for 30 min. After intracellular marker staining, cells were washed with 2 ml of Perm/Wash Buffer and resuspended in 250 µl PBS. Five-colour acquisition was performed on Cytomics FC 500 flow cytometer (Beckman Coulter). For each sample, a minimum of 50 000 CD4+ events were acquired. Data analysis was performed using cxp software (Beckman Coulter). Figure 1 shows a representative example of flow cytometry.
Fig. 1.
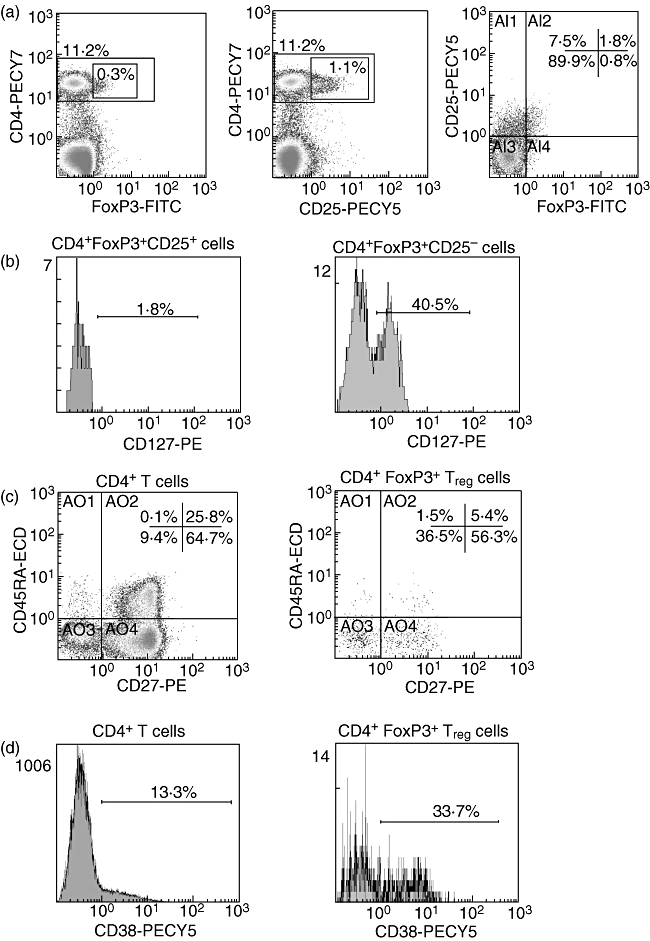
Representative example of flow cytometry. (a) Dot plots showing expression of forkhead box P3 (Foxp3) (left), CD25 (middle) and co-expression of both CD25 and FoxP3 (right) on CD4+ T cells. (b) Histograms showing the expression of CD127 on two different subsets of T regulatory (Treg) cells, CD25+ (left) and CD25– (right). (c) Dot plots showing the co-expression of CD45RA and CD27 on total CD4+ T cells (left) and on CD4+FoxP3+ Treg cells (right). (d) Histograms showing the expression of the activation marker CD38 on total CD4+ T cells (left) and on CD4+FoxP3+ Treg cells (right). FITC, fluorescein isothiocyanate; ECD, energy-coupled dye.
Statistical analyses
Characteristics of the study population and the different immune parameters were recorded as median (interquartile range) and comparisons between groups were made using non-parametric tests, such as the Mann–Whitney U-test, Wilcoxon's test or Kruskall–Wallis test, when appropriate. Correlations between quantitative parameters were explored using the Spearman’ rho test. All statistical analyses were performed using spss software version 13 (SPSS Inc., Chicago, IL, USA). All P-values were two-tailed, and were considered significant when lower than 0·05.
Results
Study population
Table 1 summarizes the main characteristics of the study population. Overall, healthy controls had significantly lower median age compared with patients. HCV-monoinfected and HCV/HIV-co-infected patients were not comparable in terms of median plasma HCV-RNA levels [6·0 (5·2–6·3) and 6·5 (5·8–6·9) log IU/ml respectively; P = 0·02]. Half the HIV-monoinfected and 77·4% of HIV/HCV-co-infected patients were on anti-retroviral therapy, and had undetectable plasma HIV viraemia. In untreated HIV patients, median plasma HIV-RNA was similar in HIV-monoinfected and HIV/HCV-co-infected groups [4·5 (4·3–5·1) and 4·3 (4·0–4·8) log copies/ml respectively]. Median CD4 counts in HIV-monoinfected and HIV/HCV-co-infected patients were 572 (296–682) and 420 (234–640) cells/µl, respectively, with no significant differences.
Table 1.
Main characteristics of the study population.
| Healthy controls (n = 20) | Patients (n = 71) | P | |||
|---|---|---|---|---|---|
| Healthy controls (n = 20) | HCV-monoinfected (n = 20) | HIV-monoinfected (n = 20) | HIV/HCV-co-infected (n = 31) | P | |
| Median age (years) | 31·0 (25·0–41·0) | 48·5 (40·0–57·5) | 39·0 (36·5–46·8) | 41·0 (39·0–45·0) | 0·005 |
| Median serum HCV-RNA (log IU/ml) | n.a.* | 6·0 (5·2–6·3) | n.a. | 6·5 (5·8–6·9) | 0·02 |
| Median CD4 count (cells/µl) | n.a. | n.a. | 572 (296–682) | 420 (234–640) | n.s.† |
| Median CD4 count (%) | n.a. | n.a. | 26 (21·0–32·0) | 22 (13·0–27·0) | n.s. |
| Patients receiving HAART (%) | n.a. | n.a. | 10/20 (50%) | 24/31 (77·4%) | n.s. |
| Median plasma HIV-RNA (log copies/ml) in patients without HAART | n.a. | n.a. | 4·5 (4·3–5·1) | 4·3 (4·0–4·8) | n.s. |
n.a., not available or not applicable;
n.s., no significant difference. HIV, human immunodeficiency virus; HCV, hepatitis C virus; HAART, highly active antiretroviral therapy.
CD4+FoxP3+ Treg cells frequency
Regulatory T cells were defined as CD4+ T cells expressing FoxP3. Using this definition the highest level of Treg cells was observed in HIV-infected patients (Kruskall–Wallis test, P = 0·01). As shown in Fig. 2, the percentage of Treg cells was increased significantly in HIV-infected patients [1·6% (0·7–4·1)] compared with controls [0·75% (0·4–1·8); P = 0·02] and HCV-monoinfected patients (0·9% (0·3–1·9); P = 0·02). Finally, there were no significant differences between HIV-monoinfected [1·6% (0·6–2·2)] and HIV/HCV-co-infected patients [1·6% (0·8–4·3)].
Fig. 2.
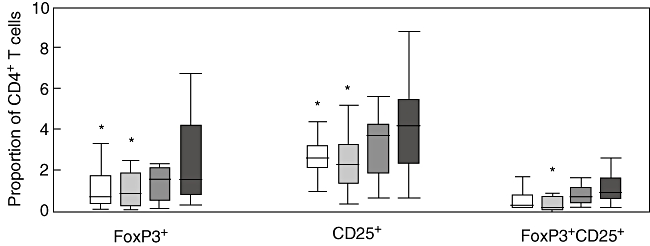
Percentages of T regulatory cells using three different phenotypic definitions [as CD4+ T cells expressing forkhead box P3 (FoxP3), CD25, or both FoxP3 and CD25] in four different groups of subjects: seronegative controls (open boxes), patients monoinfected with hepatitis C virus (light grey boxes), patients monoinfected with human immunodeficiency virus (HIV) (dark grey boxes) and patients co-infected with both HIV and HCV (solid boxes). (*) P < 0·05 with respect to HIV-infected patients.
Given that others have relied upon CD25 expression to identify Treg cells and more recently upon the co-expression of CD25 and FoxP3, levels of CD4+CD25+ were also examined in the different groups and the results were identical to those obtained considering CD4+Foxp3+. Furthermore, similar results were obtained testing the levels of CD4+CD25+FoxP3+ cells in the different groups. In all cases, HIV-infected patients (either monoinfected or co-infected with HCV) showed higher levels of CD4+CD25+FoxP3+ cells compared with HCV-monoinfected patients and healthy controls.
Expression of CD25 and CD127 on CD4+FoxP3+ Treg cells
Not all CD4+FoxP3+ Treg cells expressed CD25; in fact, only 34% (22–52) of Treg cells in patients and 45% (32–59) in controls expressed this marker, with no significant differences between both groups. Similarly, when considering separately distinct patients, there were no significant differences in the level of CD25 expression comparing HCV-monoinfected [31% (10–45)], HIV-monoinfected [34% (26–55)] and HIV/HCV-co-infected [39% (23–55)] individuals.
With respect to CD127 expression, only a small fraction of CD4+FoxP3+ Treg cells [considering both CD25+ and CD25(–) subsets] expressed this marker: 27% (17–43) in patients and 28% (17–49) in controls. Interestingly, there was a significant increase of CD127 expression in HCV-monoinfected patients [43% (27–58)] compared with controls [28% (17–49)] and to HIV-infected patients [24% (15–37)] (Kruskall–Wallis test, P = 0·001). There were no significant differences between HIV-monoinfected [27% (14–42)] and HIV/HCV co-infected patients [23% (15–33)].
When CD127 expression was examined separately in CD25+ and CD25(–) Treg cells, significant increases of CD127 were recognized only in Treg cells not expressing CD25 compared with those expressing CD25 [39% (23–57) versus 2·2% (0·8–3·6) in HCV-monoinfected; 26% (14–39) versus 0·9% (0·1–1·5) in HIV-monoinfected; 20% (13–30) versus 1·8% (0·7–2·5) in HIV/HCV co-infected patients and 27% (16–47) versus 0·95% (0·3–2·3) in healthy controls; Wilcoxon's test P < 0·0001 for all comparisons] (Fig. 3).
Fig. 3.

Levels of CD127 expression on T regulatory cells expressing CD25 (open boxes) or not (grey boxes) in four different groups of subjects: seronegative controls, patients monoinfected with hepatitis C virus (HCV), patients monoinfected with HIV and patients co-infected with both human immunodeficiency virus and HCV. (*) P < 0·0001 with respect to CD25 negative T regulatory cells.
CD4+FoxP3+ Treg cells display a central memory phenotype
The maturation status of CD4+FoxP3+ Treg cells was examined using CD45RA and CD27 markers. Treg cells displayed predominantly a central memory phenotype (CD45RA–CD27+), with no differences between healthy controls [68% (61–75)], HCV-monoinfected [57% (49–73)], HIV-monoinfected [65% (53–82)] and HIV/HCV co-infected patients [72% (64–81)] (Fig. 4). Levels of effector and effector memory Treg cells were also similar in the different groups. However, naive (CD45RA+CD27+) Treg cells were less frequent in all patient groups [HCV-monoinfected: 4% (2·7–8·4); HIV-monoinfected: 3% (1·0–9·4) and HIV/HCV co-infected patients: 2·1% (1·3–6·2)] than in healthy controls: 7·9% (3·6–12); Kruskall–Wallis test, P = 0·04 (Fig. 4). The dominance of the central memory phenotype was also observed in the total population of CD4+ T cells (66% (59–73) in controls and 68% (57–75) in patients). Thus, no significant differences in maturation status were seen overall when comparing Treg cells and total CD4+ T cells.
Fig. 4.
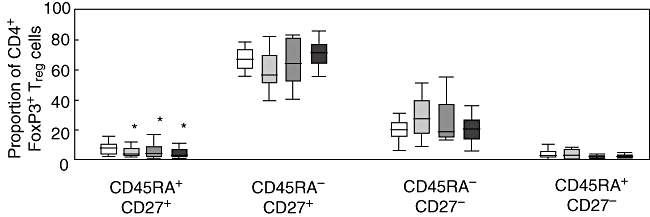
Maturation status of CD4+forkhead box P3 (Foxp3)+ T regulatory (Treg) cells according to CD45RA and CD27 expression in four different groups of subjects: seronegative controls (open boxes), patients monoinfected with HCV (light grey boxes), patients monoinfected with human immunodeficiency virus (HIV) (dark grey boxes) and patients co-infected with both HIV and hepatitis C virus (solid boxes). Vertical axis represents the proportion of Treg cells expressing each of the four different phenotypes. (*) P < 0·05 with respect to controls.
CD4+FoxP3+ Treg cell activation status
CD38 expression was analysed in CD4+FoxP3+ Treg cells as well as in total CD4+ T cells (Fig. 5). In both controls and patients, activation of Treg cells was higher than activation of total CD4+ T cells. In healthy controls, expression of CD38 was 24% (19–30) in Treg cells versus 11% (9·6–12) in CD4+ T cells. Similarly, in HCV-monoinfected patients, expression of CD38 was 21% (14–26) in Treg cells versus 8% (6·8–11) in CD4+ T cells. In HIV-infected patients, these figures were 41% (34–55) versus 15% (12–22) (Wilcoxon's test, P < 0·005 for all comparisons). When activation of CD4+FoxP3+ Treg cells was compared between groups, a significantly higher level was noted for HIV-infected patients [41% (34–55)] with respect to HCV-monoinfected patients [21% (14–26)] and healthy controls [24% (19–30)]; Kruskall–Wallis test, P < 0·0001 (Fig. 5). There were no significant differences when comparing activation of Treg cells between HIV-monoinfected [35% (26–54)] and HIV/HCV-co-infected patients [42% (35–55)].
Fig. 5.
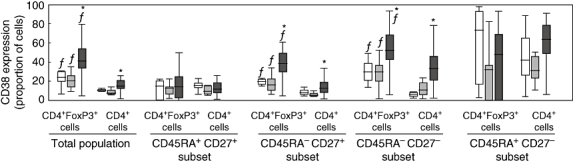
Level of CD38 expression on different subsets of CD4+forkhead box P3 (FoxP3)+ T regulatory cells and of CD4+ T lymphocytes in three different groups: seronegative controls (open boxes), patients monoinfected with hepatitis C virus (HCV) (light grey boxes) and patients infected with human immunodeficiency virus (co-infected or not with HCV, dark grey boxes). (*) P < 0·001 with respect to controls and HCV-monoinfected patients; (f) P < 0·005 with respect to total CD4+ T cells within the same group of subjects.
A more in-depth analysis was carried out by measuring the level of CD38 expression on the four different subsets of Treg cells defined by CD45RA and CD27 markers (Fig. 5). In all groups, activation was significantly higher in central memory and effector memory subsets of Treg cells in comparison with total CD4+ cells. In contrast, activation in naive subsets was similar when comparing Treg cells and total CD4+ T cells. Finally, activation of central memory and effector memory Treg cells was increased significantly in HIV-infected patients compared with healthy controls and HCV-monoinfected patients (Kruskall–Wallis test, P < 0·0001).
Associations between Treg cells, CD4 counts and T cell activation
In HIV-infected patients, either monoinfected or co-infected with HCV, there was a significant inverse correlation between CD4 counts and Treg cell proportions (Spearman's rho = −0·54; P < 0·0001). When patients were stratified according to HIV-RNA level (detectable or undetectable), similar results were obtained in the subset of patients with undetectable viral load.
When patients were stratified according to CD4 counts (stages 1–3 of CDC), significantly higher levels of Treg cells (expressed as proportion of CD4+ T cells) were observed in patients with CD4 counts < 500 cells/µl (stages 2 and 3) than in patients with CD4 counts > 500 cells/µl [0·8% (0·6–1·8), 2·2% (1·1–5·3) and 4·3% (2·6–10) in CDC stages 1, 2 and 3 respectively; Kruskall–Wallis test, P = 0·005]. In fact, Treg cell proportions in HIV patients with CD4 counts > 500 cells/µl did not differ significantly from those in healthy controls. Moreover, a higher proportion of Treg cells was seen in patients with detectable HIV-RNA, although there was no significant association between Treg cell percentages and viraemia in this group of patients.
It is noteworthy that absolute numbers of Treg cells did not increase with HIV disease progression but remained fairly stable [6 (4–13), 6 (4–13) and 4 (3–14) cells/µl in CDC stages 1, 2 and 3 respectively].
In a bivariate analysis, the proportion of Treg cells was also associated positively and significantly with the level of CD4+ T cell activation (Spearman's rho = 0·46; P = 0·009). However, because CD4+ T cell activation was also associated significantly with CD4 counts (Spearman's rho = –0·38; P = 0·03), a multivariate analysis was conducted to discern if Treg cell proportion was associated with CD4+ T cell activation, regardless of CD4 counts. In a linear regression analysis, using CD4 counts and proportion of Treg cells as independent variables and CD4+ T cell activation as dependent variable, only CD4 counts correlated positively with CD4+ T cell activation (R =0·46; P = 0·03). Finally, the level of Treg cell activation was correlated positively and significantly with the level of CD4+ T cell activation (Spearman's rho = 0·68; P < 0·0001).
Discussion
The level and phenotypic characteristics of CD4+ T regulatory cells were examined in a group of patients with chronic HIV and/or HCV infections. Based on the close association between FoxP3 expression and T cell regulatory activity [33–36], we defined Treg cells as those CD4+ T cells expressing this marker independently of CD25 expression, as opposed to previous studies which had used both CD25 and FoxP3 to define this cell population [37–41]. Using this definition, we observed a significant increase in the percentage of Treg cells in patients infected with HIV compared with seronegative controls, in agreement with previous studies [23,25,26]. It could be argued that the significantly younger age of the control group could bias the results, as age may influence Treg cell levels [42]. However, in young and middle-aged adults, as in our study population, the proportion of this cell subset remains fairly stable. Indeed, we did not find an association between age and Treg levels.
The increase in Treg cells in HIV patients compared with the rest was observed similarly when CD25 expression was used to define Treg cells, as in most previous studies [23,25,26]. This increase, however, was observed only when the level of Treg cells was expressed as a proportion of CD4+ T cells, whereas Treg cell absolute counts remained fairly stable throughout HIV disease progression. Most previous studies conducted in HIV patients reporting an increase of Treg cells analysed frequency [23,25–26,43], but only a few reported absolute counts of Treg cells [23,43]. Because the results may vary profoundly depending upon how Treg cell levels are expressed, it is important to highlight whether Treg cells are expressed as a proportion or absolute numbers when interpreting the results. Treg cells are a small fraction of CD4+ T cells and thus exert their function over the majority of non-Treg cells, meaning that changes in their ratio may impact their regulatory activity profoundly. Therefore, the increased proportion of Treg cells we noted in HIV-infected patients most probably alter the ability to elicit a virus-specific effector T cell response, as has been suggested previously [35]. It should be noted, however, that in our study, as in others [22,26], the proportion of this population was not increased in HIV-infected patients with normal CD4 counts, while impaired HIV-specific T cell responses are already known to be present at early stages of HIV infection [9]. Thus, our results suggest a role for Treg cells only in advanced stages of HIV infection, where the increased ratio of Treg cells could potentiate an impairment of HIV-specific immune responses. However, this hypothesis could not be tested, given that we did not perform functional studies on Treg cells. In fact, an increased ratio of Treg cells does not necessarily imply higher down-regulation of HIV-specific immune responses, as pointed out recently [26]. A lower proportion of Treg cells could be enough to induce maximal suppression of the effector function, and the higher proportion of this subset observed in our study may simply reflect a population of cells more resilient to elimination by HIV. This hypothesis, however, is challenged by a recent report in a humanized murine model of infection showing that Treg cells are infected preferentially by HIV [44]. If this observation is confirmed, the increased ratios we have observed in HIV patients could be explained by a high replenishment of this cell population, either by peripheral expansion and/or by central production. This would explain the maintenance of the absolute numbers of Treg cells in the face of decreasing CD4+ counts as disease progresses.
In contrast with previous findings [13,24,27], no differences in Treg cell proportions were seen when comparing HCV-monoinfected patients and healthy controls. As the majority of previous studies relied upon CD25 expression and not FoxP3 to identify Treg cells, this could explain the discordance. However, as we have not analysed liver tissue samples, we cannot rule out the possibility of an alteration of Treg cells in this compartment. Moreover, the stage of liver fibrosis in the different cohorts of patients could influence the results, as some authors have suggested that Treg cell levels in chronic hepatitis C might vary according to HCV-related liver disease stage [45]. Because we found a negative association between Treg cells and CD4 counts in HIV patients, the normal proportions of Treg cells we observed in HCV-monoinfected patients are concordant with the stable CD4 counts seen in these patients. In fact, in HIV/HCV-co-infected patients we found a significant increase of Treg cell percentages compared with HCV-monoinfected patients which, interestingly, could be an underlying factor contributing to the accelerated course of liver disease seen characteristically in HIV/HCV-co-infected patients [46].
A remarkable finding in our study was the existence of two subsets of CD4+FoxP3+ Treg cells with a different phenotypic profile on the basis of CD25 expression. In fact, only 34% of CD4+FoxP3+ Treg cells in patients and 45% in healthy controls expressed CD25. These results are in agreement with a recent study which has shown that part of the CD4+FoxP3+ cells are low or even negative for CD25 [32]. Moreover, CD4+FoxP3+ lacking CD25 expression display a similar regulatory activity to cells expressing CD25 [32]. Previous studies [23,25,26] which defined Treg cell subsets as CD4+CD25+ could have underestimated this cell population [22,30]. Thus, our results support the use of FoxP3 as the most reliable marker to identify the Treg cell subset.
CD4+CD25+ cells with regulatory activity have recently been characterized further as cells lacking expression of CD127, and a close correlation has been observed between the absence of CD127 and FoxP3 expression [32]. Moreover, CD127 could be used to discriminate between human regulatory and activated effector CD4+ T cells [47]. Our results confirm these observations for the CD4+FoxP3+CD25+ subset of Treg cells, while this was not the case for the CD4+Foxp3+CD25(–) subset, given that more than 20% of these cells expressed CD127 in all groups of subjects. The functional significance of the CD4+FoxP3+CD25(–)CD127+ subset has to be determined.
In our study population, CD4+FoxP3+ Treg cells displayed a predominantly central memory phenotype (CD45RA–CD27+), which is in agreement with previous studies [13,25–26,40,45]. The dominance of the central memory phenotype was also observed in the total population of CD4+ T cells. Thus, there were no major differences in the maturation status when comparing Treg cells and total CD4+ T cells. The predominance of the central memory phenotype might indicate that the population of Treg cells includes antigen-primed cells, as the existence of antigen-induced CD4+FoxP3+ Treg cells has been shown recently [48]. At this point, we can speculate that the higher proportion of Treg cells in patients with more advanced HIV disease could be the expected response of this cell population to a massive exposure to different antigens, in line with the recently proposed hypothesis of microbial translocation that may explain immune hyperactivation in HIV infection [49]. Activation was higher in CD4+FoxP3+ Treg cells than in total CD4+ cells in all groups of patients, but it was increased more in HIV-infected patients than in the rest, particularly considering the central memory cell subset. Moreover, there were no differences when comparing HIV-monoinfected and HIV/HCV-co-infected patients. The positive correlation between CD4+ T cell activation and Treg cell activation suggests that Treg cells are highly activated as a consequence of the generalized state of immune activation observed in HIV infection. On the other hand, this supports that Treg cells are prone to apoptosis, as a direct correlation between T cell activation and apoptosis has been demonstrated in HIV+ patients [50], and previous studies have shown an increase in the expression of apoptosis markers on Treg cells [13].
A beneficial role for Treg cells limiting the onset of T cell activation has been suggested previously in the context of HIV infection. Supporting this hypothesis, some authors have found an inverse correlation between Treg cell levels and T cell activation [41,51], although others have not confirmed this finding [52]. We did not find an association between CD4+ T cell activation and Treg cell proportions after adjusting for CD4 counts. In fact, the inverse correlation reported by others could be a spurious association, as no adjustment was made for CD4 counts and/or plasma HIV-RNA [51]. Differences in markers used to define Treg cells could also explain the discordant results reported previously when testing associations with T cell activation [41].
In conclusion, there is an increase in the frequency of CD4+FoxP3+ Treg cells in patients with advanced HIV infection but not in those with preserved CD4 counts or in patients monoinfected with HCV. Interestingly, the increase in Treg cells frequency seen in HIV/HCV-co-infected patients could be involved in faster liver disease progression seen characteristically in this population. The lack of association between CD4+ T cell activation and Treg cell proportions do not support a critical role for Treg cells in immune activation phenomena. In all situations, Treg cells displayed a predominantly central memory phenotype and were highly activated. Based on CD25 expression, two subsets of CD4+FoxP3+ cells were identified, with differences in CD127 expression. Further studies are needed to delineate if different subsets of CD4+FoxP3+ cells may have different functional properties.
Acknowledgments
This work was supported in part by grants from FIPSE, Fundación IES, FIS (ISCIII-RETIC RD06/006), CIBEREHD and Agencia Lain Entralgo. Norma I. Rallón is funded by FIPSE grant number 36617/06. The authors declare that they do not have any financial/commercial or other association that might pose a conflict of interest.
Glossary
Abbreviations
- CDC
Centers for disease control
- Foxp3
forkhead box transcription factor
- Log
logarithm
References
- 1.Koup RA, Safrit JT, Cao Y, et al. Temporal association of cellular immune responses with the initial control of viremia in primary HIV type 1 syndrome. J Virol. 1994;68:4650–5. doi: 10.1128/jvi.68.7.4650-4655.1994. [DOI] [PMC free article] [PubMed] [Google Scholar]
- 2.Schmitz J, Schmitz JE, Kuroda MJ, et al. Control of viremia in simian immunodeficiency virus infection by CD8+ lymphocytes. Science. 1999;283:857–60. doi: 10.1126/science.283.5403.857. [DOI] [PubMed] [Google Scholar]
- 3.Missale G, Bertoni R, Lamonaca V, et al. Different clinical behaviors of acute hepatitis C virus infection are associated with different vigor of the anti-viral cell-mediated immune response. J Clin Invest. 1996;98:706–14. doi: 10.1172/JCI118842. [DOI] [PMC free article] [PubMed] [Google Scholar]
- 4.Thimme R, Oldach D, Chang KM, Steiger C, Ray SC, Chisari FV. Determinants of viral clearance and persistence during acute hepatitis C virus infection. J Exp Med. 2001;194:1395–406. doi: 10.1084/jem.194.10.1395. [DOI] [PMC free article] [PubMed] [Google Scholar]
- 5.Shankar P, Russo M, Harnisch B, Patterson M, Skolnik P, Lieberman J. Impaired function of circulating HIV-specific CD8+ T-cells in chronic HIV infection. Blood. 2000;96:3094–101. [PubMed] [Google Scholar]
- 6.Benito JM, López M, Lozano S, et al. Phenotype and functional characteristics of HIV-specific cytotoxic CD8+ T-cells in chronically infected patients. Dual effects of highly active antiretroviral therapy. J Acquir Immune Defic Syndr. 2003;34:255–66. doi: 10.1097/00126334-200311010-00001. [DOI] [PubMed] [Google Scholar]
- 7.Wedemeyer H, He XS, Nascimbeni M, et al. Impaired effector function of hepatitis C virus-specific CD8-T cells in chronic hepatitis C virus infection. J Immunol. 2002;169:3447–58. doi: 10.4049/jimmunol.169.6.3447. [DOI] [PubMed] [Google Scholar]
- 8.Ulsenheimer A, Gerlach JT, Gruener NH, et al. Detection of functionally altered hepatitis C virus-specific CD4 T cells in acute and chronic hepatitis C. Hepatology. 2003;37:1189–98. doi: 10.1053/jhep.2003.50194. [DOI] [PubMed] [Google Scholar]
- 9.Benito JM, López M, Soriano V. The role of CD8+ T-cell response in HIV infection. AIDS Rev. 2004;6:79–88. [PubMed] [Google Scholar]
- 10.Tortorella D, Gewurz BE, Furman MH, Schust DJ, Ploegh HL. Viral subversion of the immune system. Annu Rev Immunol. 2000;18:861–926. doi: 10.1146/annurev.immunol.18.1.861. [DOI] [PubMed] [Google Scholar]
- 11.Baecher-Allan C, Viglietta V, Hafler D. Human CD4+CD25+ regulatory T cells. Semin Immunol. 2004;16:89–98. doi: 10.1016/j.smim.2003.12.005. [DOI] [PubMed] [Google Scholar]
- 12.Dittmer U, He H, Messer RJ, et al. Functional impairment of CD8+ T cells by regulatory T cells during persistent retroviral infection. Immunity. 2004;20:293–303. doi: 10.1016/s1074-7613(04)00054-8. [DOI] [PubMed] [Google Scholar]
- 13.Cabrera R, Tu Z, Xu Y, et al. An immunomodulatory role for CD4(+)CD25(+) regulatory T lymphocytes in hepatitis C virus infection. Hepatology. 2004;40:1062–71. doi: 10.1002/hep.20454. [DOI] [PubMed] [Google Scholar]
- 14.Robertson S, Hasenkrug K. The role of virus-induced regulatory T cells in immunopathology. Springer Semin Immunopathol. 2006;28:51–62. doi: 10.1007/s00281-006-0019-2. [DOI] [PMC free article] [PubMed] [Google Scholar]
- 15.Dieckmann D, Plottner H, Berchtold S, Berger T, Schuler G. Ex vivo isolation and characterization of CD4(+)CD25(+) T cells with regulatory properties from human blood. J Exp Med. 2001;193:1303–10. doi: 10.1084/jem.193.11.1303. [DOI] [PMC free article] [PubMed] [Google Scholar]
- 16.Jonuleit H, Schmitt E, Stassen M, Tuettenberg A, Knop J, Enk AH. Identification and functional characterization of human CD4(+)CD25(+) T cells with regulatory properties isolated from peripheral blood. J Exp Med. 2001;193:1285–94. doi: 10.1084/jem.193.11.1285. [DOI] [PMC free article] [PubMed] [Google Scholar]
- 17.Stephens LA, Mottet C, Mason D, Powrie F. Human CD4(+)CD25(+) thymocytes and peripheral T cells have immune suppressive activity in vitro. Eur J Immunol. 2001;31:1247–54. doi: 10.1002/1521-4141(200104)31:4<1247::aid-immu1247>3.0.co;2-m. [DOI] [PubMed] [Google Scholar]
- 18.Baecher-Allan C, Brown JA, Freeman GF, Hafler DA. CD4+CD25 high regulatory cells in human peripheral blood. J Immunol. 2001;167:1245–53. doi: 10.4049/jimmunol.167.3.1245. [DOI] [PubMed] [Google Scholar]
- 19.O’Garra A, Vieira P. Regulatory T cells and mechanisms of immune system control. Nat Med. 2004;10:801–5. doi: 10.1038/nm0804-801. [DOI] [PubMed] [Google Scholar]
- 20.Bluestone JA, Abbas AK. Natural versus adaptive regulatory T cells. Nat Rev Immunol. 2003;3:253–7. doi: 10.1038/nri1032. [DOI] [PubMed] [Google Scholar]
- 21.Vigouroux S, Yvon E, Biagi E, Brenner MK. Antigen-induced regulatory T cells. Blood. 2004;104:26–33. doi: 10.1182/blood-2004-01-0182. [DOI] [PubMed] [Google Scholar]
- 22.Aandahl EM, Michaëlsson J, Moretto WJ, Hecht FM, Nixon DF. Human CD4+ CD25+ regulatory T cells control T-cell responses to HIV and cytomegalovirus antigens. J Virol. 2004;78:2454–9. doi: 10.1128/JVI.78.5.2454-2459.2004. [DOI] [PMC free article] [PubMed] [Google Scholar]
- 23.Kinter AL, Hennessey M, Bell A, et al. CD25(+)CD4(+) regulatory T cells from the peripheral blood of asymptomatic HIV-infected individuals regulate CD4(+) and CD8(+) HIV-specific T cell immune responses in vitro and are associated with favorable clinical markers of disease status. J Exp Med. 2004;200:331–43. doi: 10.1084/jem.20032069. [DOI] [PMC free article] [PubMed] [Google Scholar]
- 24.Sugimoto K, Ikeda F, Stadanlick J, Nunes FA, Alter HJ, Chang KM. Suppression of HCV-specific T cells without differential hierarchy demonstrated ex vivo in persistent HCV infection. Hepatology. 2003;38:1437–48. doi: 10.1016/j.hep.2003.09.026. [DOI] [PubMed] [Google Scholar]
- 25.Weiss L, Donkova-Petrini V, Caccavelli L, et al. V-driven expansion of CD4+CD25+ regulatory T cells, which suppress HIV-specific CD4 T-cell responses in HIV-infected patients. Blood. 2004;104:3249–56. doi: 10.1182/blood-2004-01-0365. [DOI] [PubMed] [Google Scholar]
- 26.Tsunemi S, Iwasaki T, Imado T, et al. Relationship of CD4+CD25+ regulatory T cells to immune status in HIV-infected patients. AIDS. 2005;19:879–86. doi: 10.1097/01.aids.0000171401.23243.56. [DOI] [PubMed] [Google Scholar]
- 27.Boettler T, Spangenberg HC, Neumann-Haefelin C, et al. T cells with a CD4+CD25+ regulatory phenotype suppress in vitro proliferation of virus-specific CD8+ T cells during chronic hepatitis C virus infection. J Virol. 2005;79:7860–7. doi: 10.1128/JVI.79.12.7860-7867.2005. [DOI] [PMC free article] [PubMed] [Google Scholar]
- 28.Boyer O, Saadoun D, Abriol J, et al. CD4+CD25+ regulatory T-cell deficiency in patients with hepatitis C-mixed cryoglobulinemia vasculitis. Blood. 2004;103:3428–30. doi: 10.1182/blood-2003-07-2598. [DOI] [PubMed] [Google Scholar]
- 29.Banham AH. Cell-surface IL-7 receptor expression facilitates the purification of FOXP3(+) regulatory T cells. Trends Immunol. 2006;27:541–4. doi: 10.1016/j.it.2006.10.002. [DOI] [PubMed] [Google Scholar]
- 30.Eggena MP, Barugahare B, Jones N, et al. Depletion of regulatory T cells in HIV infection is associated with immune activation. J Immunol. 2005;174:4407–14. doi: 10.4049/jimmunol.174.7.4407. [DOI] [PubMed] [Google Scholar]
- 31.Annacker O, Pimenta-Araujo R, Burlen-Defranoux O, Barbosa TC, Cumano A, Bandeira A. CD25+CD4+ T cells regulate the expansion of peripheral CD4 T cells through the production of IL-10. J Immunol. 2001;166:3008–18. doi: 10.4049/jimmunol.166.5.3008. [DOI] [PubMed] [Google Scholar]
- 32.Liu W, Putnam AL, Xu-Yu Z, et al. CD127 expression inversely correlates with FoxP3 and suppressive function of human CD4+ Treg cells. J Exp Med. 2006;203:1701–11. doi: 10.1084/jem.20060772. [DOI] [PMC free article] [PubMed] [Google Scholar]
- 33.Hori S, Nomura T, Sakaguchi S. Control of regulatory T cell development by the transcription factor Foxp3. Science. 2003;299:1057–61. doi: 10.1126/science.1079490. [DOI] [PubMed] [Google Scholar]
- 34.Fontenot JD, Gavin MA, Rudensky AY. Foxp3 programs the development and function of CD4+CD25+ regulatory T cells. Nat Immunol. 2003;4:330–6. doi: 10.1038/ni904. [DOI] [PubMed] [Google Scholar]
- 35.Fontenot JD, Rasmussen JP, Williams LM, Dooley JL, Farr AG, Rudensky AY. Regulatory T cell lineage specification by the forkhead transcription factor Foxp3. Immunity. 2005;22:329–41. doi: 10.1016/j.immuni.2005.01.016. [DOI] [PubMed] [Google Scholar]
- 36.Khattri R, Cox T, Yasayko SA, Ramsdell F. An essential role for Scurfin in CD4+CD25+ T regulatory cells. Nat Immunol. 2003;4:337–42. doi: 10.1038/ni909. [DOI] [PubMed] [Google Scholar]
- 37.Montes M, Lewis DE, Sanchez C, et al. Foxp3+ regulatory T cells in antiretroviral-naive HIV patients. AIDS. 2006;20:1669–71. doi: 10.1097/01.aids.0000238415.98194.38. [DOI] [PubMed] [Google Scholar]
- 38.Kinter AL, Horak R, Sion M, et al. CD25+ regulatory T cells isolated from HIV-infected individuals suppress the cytolytic and nonlytic antiviral activity of HIV-specific CD8+ T cells in vitro. AIDS Res Hum Retroviruses. 2007;23:438–50. doi: 10.1089/aid.2006.0162. [DOI] [PubMed] [Google Scholar]
- 39.Sereti I, Imamichi H, Natarajan V, et al. In vivo expansion of CD4CD45RO-CD25 T cells expressing foxP3 in IL-2-treated HIV-infected patients. J Clin Invest. 2005;115:1839–47. doi: 10.1172/JCI24307. [DOI] [PMC free article] [PubMed] [Google Scholar]
- 40.Manigold T, Shin EC, Mizukoshi E, et al. Foxp3+CD4+CD25+ T cells control virus-specific memory T cells in chimpanzees that recovered from hepatitis C. Blood. 2006;107:4424–32. doi: 10.1182/blood-2005-09-3903. [DOI] [PMC free article] [PubMed] [Google Scholar]
- 41.Ndhlovu L, Loo C, Spotts G, Nixon D, Hecht F. FOXP3 expressing CD127lo CD4+ T cells inversely correlate with CD38+CD8+ T cell activation levels in primary HIV-1 infection. J Leukoc Biol. 2008;83:254–62. doi: 10.1189/jlb.0507281. [DOI] [PubMed] [Google Scholar]
- 42.Dejaco C, Duftner C, Schirmer M. Are regulatory T-cells linked with aging? Exp Gerontol. 2006;41:339–45. doi: 10.1016/j.exger.2006.01.008. [DOI] [PubMed] [Google Scholar]
- 43.Epple HJ, Loddenkemper C, Kunkel D, et al. Mucosal but not peripheral FOXP3+ regulatory T cells are highly increased in untreated HIV infection and normalize after suppressive HAART. Blood. 2006;108:3072–8. doi: 10.1182/blood-2006-04-016923. [DOI] [PubMed] [Google Scholar]
- 44.Jiang Q, Zhang L, Wang R, et al. Foxp3+CD4+ Treg cells play an important role in acute HIV-1 infection in humanized rag2−/−(gamma)C−/− mice in vivo. Blood. 2008;112:2858–68. doi: 10.1182/blood-2008-03-145946. Epub ahead of print. [DOI] [PMC free article] [PubMed] [Google Scholar]
- 45.Bolacchi F, Sinistro A, Ciaprini C, et al. Increased hepatitis C virus (HCV)-specific CD4+CD25+ regulatory T lymphocytes and reduced HCV-specific CD4+ T cell response in HCV-infected patients with normal versus abnormal alanine aminotransferase levels. Clin Exp Immunol. 2006;144:188–96. doi: 10.1111/j.1365-2249.2006.03048.x. [DOI] [PMC free article] [PubMed] [Google Scholar]
- 46.Hasenkrug K. CD4+ regulatory T cells in chronic viral infection. Novartis Found Symp. 2003;252:194–9. [PubMed] [Google Scholar]
- 47.Seddiki N, Santner-Nanan B, Martinson J, et al. Expression of interleukin (IL)-2 and IL-7 receptors discriminates between human regulatory and activated T cells. J Exp Med. 2006;203:1693–700. doi: 10.1084/jem.20060468. [DOI] [PMC free article] [PubMed] [Google Scholar]
- 48.Li S, Jones KL, Woollard DJ, et al. Defining target antigens for CD25+ FOXP3 + IFN-gamma- regulatory T cells in chronic hepatitis C virus infection. Immunol Cell Biol. 2007;85:197–204. doi: 10.1038/sj.icb.7100020. [DOI] [PubMed] [Google Scholar]
- 49.Brenchley JM, Price DA, Schacker TW, et al. Microbial translocation is a cause of systemic immune activation in chronic HIV infection. Nat Med. 2006;12:1365–71. doi: 10.1038/nm1511. [DOI] [PubMed] [Google Scholar]
- 50.Benito JM, López M, Martín JC, et al. Differences in cellular activation and apoptosis in HIV-infected patients receiving protease inhibitors or nonnucleoside reverse transcriptase inhibitors. AIDS Res Hum Retroviruses. 2002;18:1379–88. doi: 10.1089/088922202320935456. [DOI] [PubMed] [Google Scholar]
- 51.Oswald-Richter K, Grill SM, Shariat N, et al. HIV infection of naturally occurring and genetically reprogrammed human regulatory T-cells. PLoS Biol. 2004;2:E198. doi: 10.1371/journal.pbio.0020198. [DOI] [PMC free article] [PubMed] [Google Scholar]
- 52.Ondoa P, De Puydth H, Vereecken C, et al. CD4+ T cell nadir and reconstitution of T regulatory cells in HIV-1-infected persons receiving HAART. 15th Conference on Retroviruses and Opportunistic Infections. Boston, 3–6 February 2008 [abstract 460.