

Abstract
This study determines levels of regulatory T cells (Tregs), naive Tregs, immune activation and cytokine patterns in 15 adult human immunodeficiency virus (HIV)-infected patients receiving prolonged highly active anti-retroviral therapy (HAART) who have known thymic output, and explores if naive Tregs may represent recent thymic emigrant Tregs. HIV-infected patients treated with HAART with a median of 1 and 5 years were compared with healthy controls. Percentages of Tregs (CD3+CD4+CD25+CD127low), naive Tregs (CD3+CD4+CD25+CD45RA+) and activation markers (CD38+human leucocyte antigen D-related) were determined by flow cytometry. Forkhead box P3 mRNA expression and T cell receptor excision circles (TREC) content in CD4+ cells were determined by polymerase chain reaction and cytokines analysed with Luminex technology. Levels of Tregs were significantly higher in HIV-infected patients compared with controls, both after 1 and 5 years of HAART (P < 0·001), despite fully suppressed HIV-RNA and normalization of both CD4 counts, immune activation and cytokine patterns. Furthermore, levels of naive Tregs were elevated significantly in HIV-infected patients (P < 0·001) and were associated with thymic output measured as the TREC frequency in CD4+ cells (P = 0·038). In summary, Treg levels in HIV-infected patients are elevated even after 5 years of HAART. Increased thymic production of naive Tregs may contribute to higher Treg levels in HIV-infection.
Keywords: anti-retroviral therapy, HIV, naive regulatory T cells, regulatory T cells, thymus
Introduction
Recently, a subpopulation of CD4+ cells named naturally regulatory T cells (Tregs) has gained attention, as they are believed to play a central role in regulation of immune responses in chronic viral infections such as human immunodeficiency virus (HIV) [1–3]. HIV is characterized by a progressive loss of CD4+ cells leading to immune deficiency. Chronic immune activation is an important cause of CD4+ cell depletion in HIV infection and a strong prognostic marker for disease progression [4,5]. The function of Tregs is down-regulation of the immune response, and as such down-regulation of the chronic immune activation. Thus, the number and function of Tregs in HIV infection may be crucial for disease progression [1].
In HIV infection most studies demonstrate increased levels of Tregs compared with healthy controls [1,3,6–8]. Treg levels are not normalized after a short course of highly active anti-retroviral therapy (HAART) [7,9]. Whether or not Treg levels in HIV-infected patients remain high even after long-term HAART is as yet not clear. Neither has the precise mechanism leading to higher Treg levels in HIV infection been examined.
Peripheral Tregs have been defined primarily as belonging to the memory T cell population, and maintenance of the Treg pool is dependent on peripheral proliferation [10]. However, evidence of Tregs with naive CD4+CD25+CD45RA+ phenotype and immunosuppressive properties within the peripheral Treg pool exists [11–13]. Whether or not naive Tregs represent recent thymic Tregs has not been clarified. In adults naive Tregs decline with age, as do thymic output and other naive T cells [11,12,14,15]. Understanding the importance of naive Tregs is only just beginning. Naive Tregs seem to represent a subpopulation of Tregs with unique self-generating capacities, and also seem to be more resistant to apoptosis [16]. Furthermore, naive Treg levels may be critical for the suppressive function of the entire Treg pool [17].
The objective of the present study was to determine levels of Tregs during long-term HAART. Levels of Tregs, percentages of activated cells and cytokine patterns were determined in adult HIV-infected patients after 1 and 5 years of HAART. Furthermore, the study determined levels of naive Tregs in HIV-infected patients and investigated the association between naive Tregs and thymic output.
Materials and methods
Human immunodeficiency virus-infected patients and healthy blood donors
A total of 25 male HIV-infected patients were included. Data on CD4 counts and thymic output have been presented previously [18,19]. Of the 25 patients frozen blood samples were available in 15 patients, and the present study demonstrates data on these 15 patients only. Patients were enrolled after 6–18 months (median 1 year) of HAART, all were naive to any anti-retroviral treatment prior to HAART. In nine of the 15 patients additional frozen blood samples were available after 54–66 months (median 5 years) of HAART. Clinical characteristics of the 15 patients at time of inclusion and at follow-up are presented in Table 1. For comparison 20 male HIV-negative age-matched controls were recruited from hospital personnel. A total of 10 controls were recruited for measurements of Tregs and naive Tregs, and an additional 10 controls were recruited for measurements of activation markers and cytokine profiles. The study was approved by the local ethics committee (KFE 01-181/00 and 11-142/04) and informed consent was obtained from all participants. Ethylenediamine tetraacetic acid blood was used to obtain a full blood count and for flow cytometry. Plasma was used to determine cytokine levels. Plasma HIV-RNA levels were measured with a polymerase chain reaction (PCR) quantitative kit (Amplicore Monitor HIV-1 PCR; Roche, Branchburg, NJ, USA) according to the manufacturer's instructions. Detection threshold was 20 copies/ml. Heparin blood was used to obtain peripheral blood mononuclear cells (PBMC) by means of density gradient centrifugation. Freshly isolated PBMCs were used for enrichment of CD4+ cells, determination of T cell receptor (TCR) excision circles (TRECs) and quantification of forkhead box P3 (FoxP3) mRNA expression by PCR. Remaining PBMCs were frozen. Thawed PBMC samples were used for flow cytometric analysis of Tregs and naive Tregs.
Table 1.
Clinical characteristics of 15 human immunodeficiency virus (HIV)-infected patients at initiation of highly active anti-retroviral therapy (HAART), at inclusion in the study (1 year of HAART) and at follow-up (5 years of HAART).
| Patient ID | CD4 count at initiation of HAART, cells/µl | Viral load at initiation of HAART, copies/ml | Age at inclusion, years | CD4 count at inclusion, cells/µl | Viral load at inclusion, copies/ml | HIV-related illness | HAART at inclusion | Months of HAART treatment at inclusion | CD4 count at follow-up, cells/µl | Viral load at follow-up, copies/ml | Months of treatment at follow-up |
|---|---|---|---|---|---|---|---|---|---|---|---|
| 1 | 17 | 123 000 | 38 | 91 | 20 | Herpes zoster, HIV-wasting | 3TC, AZT, IND, RTV | 9 | n.f.d. | n.f.d. | n.f.d. |
| 2 | 212 | Missing | 32 | 623 | 20 | 3TC, AZT, RTV, SQV | 12 | 1023 | <20 | 60 | |
| 3 | 238 | 16 900 | 45 | 324 | 20 | 3TC, AZT, NEV | 12 | n.f.d. | n.f.d. | n.f.d. | |
| 4 | 24 | 78 500 | 45 | 116 | 20 | Kaposi's sarcoma | 3TC, AZT, NEV, NFV | 17 | 247 | <20 | 65 |
| 5 | 42 | 90 300 | 47 | 160 | 275 | AIDS-dementia | 3TC, D4T, RTV, SQV | 15 | 502 | 20 | 63 |
| 6 | 234 | >150 000 | 35 | 414 | 20 | HIV-encephalitis | 3TC, AZT, RTV, SQV | 16 | n.f.d. | n.f.d. | n.f.d. |
| 7 | 264 | 48 400 | 28 | 409 | 20 | Herpes zoster | 3TC, D4T, NEV, NFV | 18 | 489 | <20 | 66 |
| 8 | 96 | >150 000 | 37 | 410 | 20 | 3TC, AZT, NFV | 16 | 1374 | <20 | 64 | |
| 9 | 136 | >150 000 | 41 | 366 | 20 | DDI, D4T, EFV | 9 | 707 | <20 | 57 | |
| 10 | 66 | >150 000 | 38 | 322 | 44 | 3TC, AZT, RTV, SQV | 18 | 737 | <20 | 66 | |
| 11 | 288 | >150 000 | 47 | 506 | 20 | 3TC, AZT, NEV, NFV | 15 | n.f.d. | n.f.d. | n.f.d. | |
| 12 | 289 | 21 000 | 30 | 515 | 263 | DDI, D4T, ABV | 18 | n.f.d. | n.f.d. | n.f.d. | |
| 13 | 230 | 8 870 | 29 | 150 | 20 | 3TC, AZT, NEV | 11 | 293 | <20 | 59 | |
| 14 | 5 | >150 000 | 33 | 95 | 20 | Kaposi's sarcoma, PCP | 3TC, AZT, EFV | 6 | 457 | <20 | 54 |
| 15 | 119 | 77 600 | 45 | 472 | 47 | Kaposi's sarcoma | 3TC, AZT, ABV | 9 | n.f.d. | n.f.d. | n.f.d. |
| Mean | N.D. | 37·9 | 324 | 57 | 13·4 | 617 | N.D. | 61·4 | |||
| SEM | N.D. | 1·7 | 45 | 22 | 1 | 112 | N.D. | 1·3 |
3TC, lamivudine; ABV, abacavir; AZT, zidovudine; D4T, stavudine; DDI, didanosine; EFV, efavirenz; IND, indinavir; n.d., not done; n.f.d., no follow-up data; NEV, nevirapine; NFV, nelfinavir; RTV, ritonavir; SQV, saquinavir.
Flow cytometry
Determination of activated lymphocyte subsets was performed on full blood, as described previously [19]. Percentages of CD4+ and CD8+ cells co-expressing CD69+, CD25+ or CD38+human leucocyte antigen D-related (HLA-DR+) were determined. Samples were analysed using a fluorescence activated cell sorter (FACScan) (Becton Dickinson (BD), San Jose, CA, USA) equipped with a 488 nm argon-ion laser. Data were processed using cellquest software (BD) and analysed using an isotype control strategy.
Determination of Tregs and naive Tregs was conducted on freshly thawed PBMC samples. Tregs were determined as CD3+CD4+CD25+CD127low cells and naive Tregs as CD3+CD4+CD45RA+CD25+ cells (Fig. 1a, b). Approximately 100 000 cells were incubated with 10 µl of fluorescence-conjugated monoclonal antibodies at room temperature for 15 min. Cells were washed with phosphate-buffered saline (PBS) and resuspended in PBS supplemented with 10% CellFIX. Samples were analysed using a FACSCalibur (BD) equipped with a 488 nm argon-ion laser and a 635 nm red diode laser. Data were processed using cellquestpro software (BD) and analysed using a flourescence-minus-one strategy. The fluorescence of 50 000 cells was measured.
Fig. 1.

Representative flow cytometric panels showing the gating strategy on regulatory T cells (Tregs) and naive Tregs. (a) The expression of CD25 and CD127 gated on CD3+CD4+ lymphocytes. The R4 region includes CD25+CD127low Tregs. (b) Naive Tregs were defined as CD3+CD4+ lymphocytes co-expressing CD25 and CD45RA. This is equivalent to region R5.
Monoclonal antibodies used were isotype control γ1-fluorescein isothiocyanate (FITC)/γ1-phycoerythrin (PE)/γ1-peridinin chlorophyll (PerCP)/γ1-allophycocyanin (APC), CD3-APC, CD4-PerCP, CD8-PerCP, CD25-FITC, CD38-PE CD45RA-PE, CD69-PE, CD127-PE and HLA-DR-FITC, all purchased from BD.
Enrichment of CD4+ cells
CD4+ cells were enriched from freshly collected PBMC using a magnetic affinity cell separator (Miltenyi Biotec, Bergisch Gladbach, Germany), as described previously [19]. The purity of sorted populations was determined by flow cytometry and was always >90%. Enriched CD4+ cells were used for PCR.
FoxP3 by reverse transcription–PCR
Measurement of Foxp3 mRNA and CD4 mRNA in separated CD4+ cells was performed by a reverse-transcribed real-time quantitative PCR (Taqman) assay. Preparation of mRNA was performed using an automated procedure (KingFisher), based on magnetic beads coated with oligo-dT. The eluted mRNA was reverse-transcribed using random hexamer priming and the Taqman assay was performed using the following intron-spanning primer probe sets: FoxP3 forward primer minus; GCTACGATGCAGCAGGAGC, FoxP3 reverse primer minus; CTGGGAAAATGGGACTGACC; FoxP3 Taqman probe: 6-FAM-AGGCTTCATCTGTGGCATCATCCGAC-TAMRA; CD4 forward prime minus; TCTTTCCCTGAGTGGCTGCT, CD4 reverse primer minus; GTCCCTTTTAGGCACTTGCTTCT; and CD4 Taqman probe: 6-FAM-TGCTGCAACTGGCGCTCCTCC-TAMRA [20]. Threshold cycle during the exponential phase of amplification was determined by real-time monitoring of fluorescence emission after cleavage of the sequence-specific probes by nuclease activity of the Taq polymerase. Equal amplification efficiency in the FoxP3 and CD4 assay was assessed by titration yielding essentially parallel tendency lines. As FoxP3 is expressed mainly by CD4+ cells, the FoxP3 signal was expressed relative to the CD4 signal [20] by the delta Ct method [21] and converted into relative units (RU). All measurements were performed in duplicate.
Determination of TRECs in purified CD4+ cells
DNA was extracted from CD4+ cells using a salting-out procedure [22], and quantification of signal-joint TRECs was performed by real-time quantitative PCR with the 5′-nuclease (TaqMan) assay, as described previously [19]. Samples were analysed in triplicate that did not vary by more than 10%, and the results were averaged.
Luminex
Cytokine analysis [interleukin (IL)-2, IL-4, IL-5, IL-10, interferon (IFN)-gamma] was performed with Luminex technology using an in-house assay as described previously [23], with some alterations. In brief, 50 µl plasma or standard diluted 1 : 10 in assay buffer (PBS containing 0·5% Tween 20 and 1% bovine serum albumin) were incubated for 1·5 h with a 50 µl suspension of capture-antibody-conjugated beads, 1500 beads per analysis per sample diluted in assay buffer. The beads were washed twice with 200 µl washing buffer (PBS containing 0·5% Tween) per well and incubated for 1·5 h with a mixture (50 µl) of biotinylated detection antibodies, each diluted 1:600 in assay buffer. Fifty µl of streptavidin–PE 20 µg/ml (Molecular Probes, Leiden, the Netherlands) were added to the wells and the incubation continued for additional 30 min. The beads were washed twice and resuspended in 100 µl washing buffer. After 15 min of shaking, samples were analysed on Luminex 100(tm) (Luminex, Austin, TX, USA) according to the manufacturer's instructions. The results are given in median fluorescence intensities.
Statistical analysis
Data are given as means (±standard error of the mean) or medians (25%; 75% quartiles). Comparisons between HIV-infected patients and controls were made using Student's t-test or Wilcoxon's two-sample test. Assumptions for using Student's t-test were evaluated using the Shapiro–Wilks test for normality and visual inspection of residual plots for evaluating equal variances. Some of the outcome variables were log-transformed prior to the analysis because of skewed distribution. Correlations between efficacy measures were calculated using Spearman's correlation coefficient. A linear regression model was used to evaluate the association between thymic output and naive Tregs. A 5% significance level was used. The analyses were performed using Statistical Analysis Systems (version 9.1.3).
Results
Elevated levels of Tregs in HIV-infected patients after 1 and 5 years of HAART
The Treg levels in 12 HIV-infected patients after 1 year of HAART were determined as percentages (%) of CD4+ cells co-expressing CD3+CD4+CD25+CD127low as well as absolute numbers and for comparison in seven controls. In HIV-infected patients median % Tregs was 6·9% (6·3; 9·5%) versus 2·0% (1·4; 2·7%) of CD4+ cells in controls, (P < 0·001). Median absolute number of CD4+CD25+CD127low cells in HIV-infected patients tended to be higher than in controls [23 cells/µl (11; 37 cells/µl) versus 10 cells/µl (7; 16 cells/µl), P = 0·090] (Fig. 2a, b). Higher absolute numbers of Tregs in patients were found despite significantly higher CD4 counts in controls [740 cells/µl (±59 cells/µl) versus 324 cells/µl (±45 cells/µl) in HIV-infected patients, P < 0·001] (Fig. 2c). No association was found between % Tregs and CD4 counts or months of treatment.
Fig. 2.
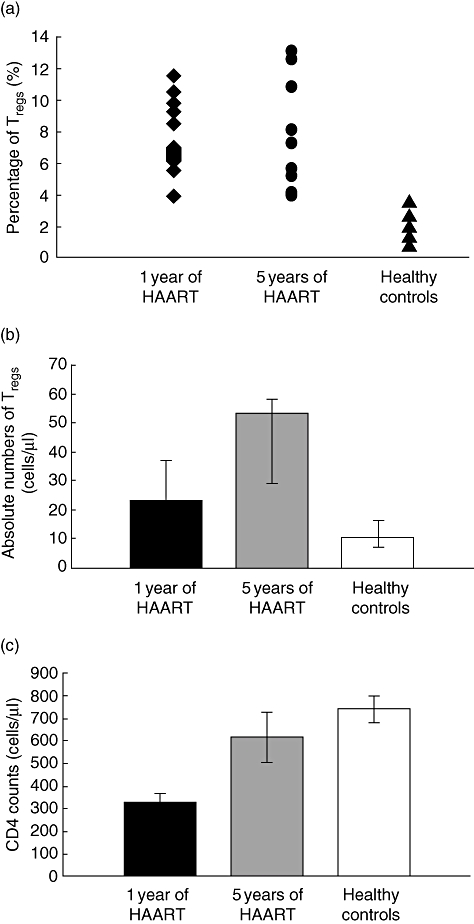
Regulatory T cells (Tregs) and CD4 counts in human immunodeficiency virus (HIV)-infected patients after 1 and 5 years of highly active anti-retroviral therapy (HAART). Percentages (a) and absolute numbers (b) of Tregs measured as CD3+CD4+CD25+CD127low of CD4+ cells and CD4 counts (c) in HIV-infected patients after 1 year of HAART, after 5 years of HAART and for comparison in healthy controls. (a) Percentages of Tregs in HIV-infected patients were significantly different from controls both after 1 and 5 years of HAART (P < 0·001). (b, c) Absolute numbers of Tregs tended to be higher in HIV-infected patients after 1 year of HAART (P = 0·090) despite significantly higher CD4 counts in controls (P < 0·001). After 5 years of HAART CD4 counts in patients were normalized compared with control (P = 0·36) and absolute numbers of Tregs were significantly higher than controls (P = 0·011). Data in (b) and (c) are given as medians (25%; 75% quartiles). Differences between patients and controls were calculated using Student's t-test.
Furthermore, FoxP3 mRNA levels were measured in 13 HIV-infected patients and 10 controls. The median FoxP3 mRNA RU in HIV-infected patients was 0·31 (0·19; 0·35) and in controls 0·11 (0·09; 0·14, P = 0·038). No association was found between FoxP3 levels and CD4 counts or months of treatment.
To investigate if Treg levels normalize after prolonged HAART, we measured CD3+CD4+CD25+CD127low cells in nine patients after 5 years of HAART. Both median percentage of Tregs and absolute number of CD4+CD25+CD127low cells at 5 years of HAART were significantly different from controls, 7·3% of CD4+ cells (5·2; 10·8%, P < 0·001) and 53 cells/µl (29; 58 cells/µl, P = 0·0011) (Fig. 2a, b). CD4 counts at 5 years of HAART had a mean of 617 cells/µl (±112 cells/µl) and were not different from controls (P = 0·36) (Fig. 2c).
Elevated levels of naive Tregs in HIV-infected patients after 1 year of HAART
Percentages and absolute numbers of naive Tregs were measured in 12 HIV-infected patients and 10 controls. The median percentage of naive Tregs in HIV-infected patients was significantly higher than in controls [2·6% (1·6; 3·1%) versus 0·7% (0·4; 0·8%) of CD4+ cells, P < 0·001] (Fig. 3a).
Fig. 3.

Naive regulatory T cells (Tregs) and thymic output in human immunodeficiency virus (HIV)-infected patients. Percentages of naive Tregs in HIV-infected patients after 1 year of highly active anti-retroviral therapy (HAART) compared with controls (a) and the association between thymic output and percentages (b) and absolute numbers (c) of naive Tregs. (a) Percentages of naive Tregs were higher in patients than controls (P < 0·001). (b) In a linear regression model a trend that percentages of naive Tregs depend on T cell receptor excision circles (TRECs) frequency was found (P = 0·077). (c) Taking into account CD4 counts, the multiple regression showed absolute numbers of naive Tregs to depend significantly on both CD4 count (P < 0·001) and TREC frequency (P = 0·036). The difference between patients and controls in (a) was calculated using Student's t-test.
The median absolute number of naive Tregs in patients was 8 cells/µl (4; 15 cells/µl) compared with controls, 5 cells/µl (3; 6 cells/µl, P = 0·18). No association was found between percentage of naive Tregs and CD4 counts.
Higher levels of naive Tregs in HIV-infected patients depend on thymic output
To examine if naive Tregs may represent recent thymic emigrant Tregs, the TREC frequency in CD4+ cells was determined (published previously in [19]). In a regression model a trend that proportions of naive Tregs depend on TREC frequency was found (P = 0·077) (Fig. 3b). Analysing absolute numbers and taking into account CD4 counts, the multiple regression showed absolute numbers of naive Tregs to depend significantly on both CD4 count (P < 0·001) and TREC frequency (P = 0·036) (Fig. 3c). In both regression models, however, one observation was very influent on the result.
Immune activation
Immune activation was measured in all 15 HIV-infected patients after 1 year of HAART and in 10 controls (Table 2). Because Tregs inhibit activated T cells, the association between Treg levels and immune activation was investigated. A negative correlation was found between FoxP3 RU and percentage of CD4+CD38+HLA-DR+ cells (r = −0·57; P = 0·041) (Fig. 4), but no association was found between percentage of Tregs and CD4+CD38+HLA-DR+ cells or between percentage of Tregs or FoxP3 levels and percentage of CD8+CD38+HLA-DR+ cells. Duration of treatment (months) was associated negatively with percentage of CD8+CD38+HLA-DR+ cells (r = −0·65; P = 0·008) and tended to be associated with percentage of CD4+CD38+HLA-DR+ cells (r = −0·49; P = 0·063).
Table 2.
Activation markers and cytokine levels in 15 human immunodeficiency virus (HIV)-infected patients after 1 year of highly active anti-retroviral therapy and in 10 controls.
| Activation markers | Patients, % | Controls, % | P |
|---|---|---|---|
| CD4+CD25+ cells | 4·4 (3·4; 10) | 4·8 (3·1; 6·6) | 0·96 |
| CD4+CD69+ cells | 4·8 (3·2; 10) | 4·2 (4·2; 8·5) | 0·98 |
| CD4+CD38+HLA-DR+ cells | 3·4 (2·4; 9·7) | 3·1 (2·7; 5·4) | 0·31 |
| CD8+CD25+ cells | 0·4 (0·02; 1·1) | 1·3 (0·5; 2·1) | 0·96 |
| CD8+CD69+ cells | 3·4 (2·3; 5·7) | 5·7 (3·3; 6·8) | 0·24 |
| CD8+CD38+HLA-DR+ cells | 5·5 (3; 6·4) | 3·1 (1·9; 4) | 0·21 |
| Cytokine | Patients, MFI | Controls, MFI | P |
| IFN-γ | 116 (92; 192) | 148 (95; 181) | 0·64 |
| IL-2 | 160 (113; 223) | 226 (131; 259) | 0·31 |
| IL-4 | 208 (163; 246) | 245 (201; 302) | 0·18 |
| IL-5 | 214 (176; 277) | 298 (184; 351) | 0·71 |
| IL-10 | 163 (139; 243) | 224 (126; 244) | 0·68 |
All activation markers are given as medians (25%; 75% quartiles). Cytokine levels are given as medians (25%; 75% quartiles) of median fluorescence intensity (MFI). IFN, interferon; IL, interleukin; HLA-DR, human leucocyte antigen D-related.
Fig. 4.

Forkhead box P3 relative unit (RU) levels in human immunodeficiency virus (HIV)-positive patients after 1 year of highly active antiretroviral therapy were negatively associated with the percentage of activated CD4+ cells (r = −0·57; P = 0·041). Spearman's correlation coefficient was used.
Cytokine profiles in HIV-infected patients and healthy controls
To investigate cytokine profiles in HIV-infected patients after 1 year of HAART plasma levels of the T helper type 1 (Th1) cytokines IL-2 and IFN-γ and the Th2 cytokines IL-4, IL-5 and IL-10 were measured in 15 patients and in 10 controls (Table 2). Th1 and Th2 cytokine patterns may be controlled by Tregs, which themselves act in a cytokine-dependent manner. We found no association between Treg levels measured by flow cytometry or FoxP3 expression and the cytokines IFN-γ, IL-2, IL-4, IL-5 or IL-10.
Discussion
The purpose of the present study was to determine levels of Tregs in adult HIV-infected patients receiving prolonged HAART. We demonstrate elevated levels of Tregs despite 5 years of HAART, suppressed viral loads and normalized CD4 counts, immune activation and cytokine patterns. Thus, the reason for higher Treg levels is not known and does not seem to be driven by immune activation or viraemia. Furthermore, significantly higher levels of naive Tregs in HIV-infected patients compared with healthy controls were found. Levels of naive Tregs were associated with thymic output, suggesting higher Treg levels in HIV-infection explained in part by increased thymic production of naive Tregs.
In recent years Tregs have become acknowledged as important players in maintaining immunological self-tolerance [10,24]. Tregs share many characteristics with activated CD4+ cells and both cell types express the IL-2 receptor CD25+[25]. Tregs, however, express CD25 with higher intensity and can hereby be distinguished from activated cells [26]. Recently, lower levels of the α-chain of the IL-7 receptor CD127 have been shown to distinguish Tregs more accurately [7,27]. Another method for quantifying Treg content is measuring the expression of the transcription factor FoxP3 responsible for the regulatory capabilities of the cells [28–31].
In HIV infection immune activation is a strong prognostic marker of disease progression [4]. Immune activation set point during early HIV infection has been shown to predict CD4 decline [5]. Tregs may therefore play a central role in HIV disease pathogenesis [1–3]. Most studies demonstrate increased levels of Tregs in blood and lymphoid tissue of HIV-infected patients compared with healthy controls [1,3,6–8,32]. However, the suppressive capacity of Tregs isolated from HIV-infected patients does not seem altered [1,3,29], even if it has been suggested that the function of Tregs in HIV-infected patients with more advanced disease is impaired [1]. Absolute numbers of Tregs decline with CD4 depletion in HIV infection, as Tregs are themselves infected by HIV. Thus, proportions of Tregs reflect the kinetics in HIV infection more clearly, and Tregs seem to decline independently from other CD4+ cells [29]. Higher proportions of Tregs have been found both in treatment-naive patients and patients treated with HAART. Interestingly, two recent studies of initiation of HAART with a median follow-up period of 24 and 36 weeks, respectively, showed no effect on Treg level despite immunological recovery and viral suppression [7,9]. Our data are in line with these findings. We show elevated levels of Tregs measured both as percentages of CD3+CD4+CD25+CD127low cells and FoxP3 mRNA RU in HIV-infected patients after 1 year of HAART. In the previously published studies, immune activation remained significantly higher in patients compared with controls. Interestingly, in this study, immune activation was normalized in patients. We did, however, find a negative association between FoxP3 RU and percentage of CD4+CD38+HLA-DR+ cells, but not between percentage of CD3+CD4+CD25+CD127low cells and activated CD4+ or CD8+ cells. We found that proportions of Tregs after 5 years of HAART were unchanged despite normalization of CD4 counts. Thus, the expansion of Tregs in HIV infection may be irreversible and may not reflect viral load, CD4 depletion or level of immune activation.
During HIV infection, dysregulation of the cytokine network has been suggested with a shift towards type 2 cytokines associated with disease progression. In contrast, a balanced cytokine pattern may be associated with long-term non-progression [29,33,34]. Type 1 and type 2 cytokine patterns have been proposed to be controlled by Tregs, which themselves may depend upon cytokines [6,35]. We did not find any association between types 1 or 2 cytokines and Treg levels; nor did we find different levels of cytokines in patients and controls, indicating that the patients investigated in this study are not so immunologically disturbed.
The precise mechanism underlying Treg expansion in HIV infection is not yet known. The expansion of Tregs may be a result of increased peripheral proliferation in the Treg pool, prolonged survival of existing Tregs, or may be due to increased generation of recent thymic emigrant Tregs. Traditionally, peripheral Tregs are considered as belonging to the memory T cell population and the majority of Tregs in adults do express the memory marker CD45RO [10,12]. However, a subpopulation of Tregs with the naive phenotype CD4+CD25+CD45RA+ is detectable within the peripheral Treg pool and with suppressive capacity comparable with memory Tregs[11–13]. Naive Tregs may be de novo generated cells released recently from the thymus, supported by the demonstration of both longer telomeres and higher TREC contents in naive Tregs, similar to telomere length and TREC contents of other naive CD4+ cells [10,11]. TRECs are generated as a by-product of the TCR rearrangement process in the thymus, and are enriched in newly generated cells [14]. However, the TREC frequency is dependent not only upon thymopoiesis, but also on peripheral T cell proliferation and cell death and therefore must be interpreted with caution [36]. Interestingly, naive Tregs seem to represent a subpopulation of Tregs with special proliferative activity and unique self-generating capacities being more resistant to apoptosis [10,16]. In fact, naive Treg levels may be critical for the suppressive function of the entire population of Tregs. In patients with relapsing–remitting multiple sclerosis, Tregs are functionally impaired and less potent suppressors of T cells, and this Treg defect has been proposed to be explained by low numbers of naive Tregs[17]. Thus, naive Tregs from the thymus may be essential to maintain full suppressive capacity of the entire Treg pool.
The thymus retains some ability to generate T cells in adults. Thus, in HIV-infected patients, higher TREC frequencies correlate with higher absolute and naive CD4 counts and are found in patients with a better immunological response to anti-retroviral therapy [14,15,19,37–41]. Whether or not the adult thymus also plays a role in maintaining Treg levels contributing with naive Tregs has not been clarified. We found increased levels of naive Tregs in HIV-infected patients compared with controls, and naive Tregs were associated with increased thymic output, suggesting that the adult thymus exports both naive CD4+ cells and naive Tregs to the periphery. Pregnancy supports the theory that the thymus is involved in regulating both central and peripheral tolerance even in adulthood. Here an immunosuppressing state develops in the maternal immune system in order to secure tolerance of fetal paternal antigens [42,43]. The thymus may be responsible for the development of this tolerance undergoing temporary changes in size and function and modulating both thymic export of naive T cells (central tolerance) and Tregs (peripheral tolerance) [42,44–46].
In conclusion, we found elevated levels of Tregs even after 5 years of HAART in HIV-infected patients with suppressed viral replication and normalization of both CD4 counts and immune activation. We present data suggesting that elevated levels of Tregs may be due to increased thymic production of naive Tregs. Thus, levels of naive Tregs were associated with thymic output measured as the TREC frequency. However, it still remains unanswered whether Tregs in HIV-infection play a harmful or useful role: harmful if Tregs suppress HIV-specific effectors and thereby limit the body's immune response to HIV; useful if Tregs help to down-regulate the chronic immune activation characteristic of HIV infection. Further studies to enlighten this are warranted. Such studies may include studies on long-term non-progressors or on HIV-infected women during pregnancy.
Acknowledgments
We gratefully acknowledge the patients who made this study possible and Bente Scherfig for excellent technical assistance. We thank the Ebba Celinders Foundation and Copenhagen University Hospital, Hvidovre for financial support and Jens Ole Nielsen for critical revision of the manuscript and general support.
References
- 1.Kinter AL, Hennessey M, Bell A, et al. CD25(+)CD4(+) regulatory T cells from the peripheral blood of asymptomatic HIV-infected individuals regulate CD4(+) and CD8(+) HIV-specific T cell immune responses in vitro and are associated with favorable clinical markers of disease status. J Exp Med. 2004;200:331–43. doi: 10.1084/jem.20032069. [DOI] [PMC free article] [PubMed] [Google Scholar]
- 2.Nixon DF, Aandahl EM, Michaelsson J. CD4+CD25+ regulatory T cells in HIV infection. Microbes Infect. 2005;7:1063–5. doi: 10.1016/j.micinf.2005.03.026. [DOI] [PubMed] [Google Scholar]
- 3.Weiss L, Donkova-Petrini V, Caccavelli L, Balbo M, Carbonneil C, Levy Y. Human immunodeficiency virus-driven expansion of CD4+CD25+ regulatory T cells, which suppress HIV-specific CD4 T-cell responses in HIV-infected patients. Blood. 2004;104:3249–56. doi: 10.1182/blood-2004-01-0365. [DOI] [PubMed] [Google Scholar]
- 4.Hazenberg MD, Otto SA, van Benthem BH, et al. Persistent immune activation in HIV-1 infection is associated with progression to AIDS. AIDS. 2003;17:1881–8. doi: 10.1097/00002030-200309050-00006. [DOI] [PubMed] [Google Scholar]
- 5.Deeks SG, Kitchen CM, Liu L, et al. Immune activation set point during early HIV infection predicts subsequent CD4+ T-cell changes independent of viral load. Blood. 2004;104:942–7. doi: 10.1182/blood-2003-09-3333. [DOI] [PubMed] [Google Scholar]
- 6.Tsunemi S, Iwasaki T, Imado T, et al. Relationship of CD4+CD25+ regulatory T cells to immune status in HIV-infected patients. AIDS. 2005;19:879–86. doi: 10.1097/01.aids.0000171401.23243.56. [DOI] [PubMed] [Google Scholar]
- 7.Lim A, Tan D, Price P, et al. Proportions of circulating T cells with a regulatory cell phenotype increase with HIV-associated immune activation and remain high on antiretroviral therapy. AIDS. 2007;21:1525–34. doi: 10.1097/QAD.0b013e32825eab8b. [DOI] [PubMed] [Google Scholar]
- 8.Montes M, Lewis DE, Sanchez C, et al. Foxp3+ regulatory T cells in antiretroviral-naive HIV patients. AIDS. 2006;20:1669–71. doi: 10.1097/01.aids.0000238415.98194.38. [DOI] [PubMed] [Google Scholar]
- 9.Gaardbo JC, Nielsen SD, Vedel SJ, et al. Regulatory T-cells in human immunodeficiency virus infected patients are elevated and independent of immunological and virological status, as well as initiation of highly active anti-retroviral therapy. Clin Exp Immunol. 2008;154:80–6. doi: 10.1111/j.1365-2249.2008.03725.x. [DOI] [PMC free article] [PubMed] [Google Scholar]
- 10.Akbar AN, Vukmanovic-Stejic M, Taams LS, Macallan DC. The dynamic co-evolution of memory and regulatory CD4+ T cells in the periphery. Nat Rev Immunol. 2007;7:231–7. doi: 10.1038/nri2037. [DOI] [PubMed] [Google Scholar]
- 11.Valmori D, Merlo A, Souleimanian NE, Hesdorffer CS, Ayyoub M. A peripheral circulating compartment of natural naive CD4 Tregs. J Clin Invest. 2005;115:1953–62. doi: 10.1172/JCI23963. [DOI] [PMC free article] [PubMed] [Google Scholar]
- 12.Seddiki N, Santner-Nanan B, Tangye SG, et al. Persistence of naive CD45RA+ regulatory T cells in adult life. Blood. 2006;107:2830–8. doi: 10.1182/blood-2005-06-2403. [DOI] [PubMed] [Google Scholar]
- 13.Antons AK, Wang R, Oswald-Richter K, et al. Naive precursors of human regulatory T cells require FoxP3 for suppression and are susceptible to HIV infection. J Immunol. 2008;180:764–73. doi: 10.4049/jimmunol.180.2.764. [DOI] [PubMed] [Google Scholar]
- 14.Douek DC, McFarland RD, Keiser PH, et al. Changes in thymic function with age and during the treatment of HIV infection. Nature. 1998;396:690–5. doi: 10.1038/25374. [DOI] [PubMed] [Google Scholar]
- 15.Haynes BF, Markert ML, Sempowski GD, Patel DD, Hale LP. The role of the thymus in immune reconstitution in aging, bone marrow transplantation, and HIV-1 infection. Annu Rev Immunol. 2000;18:529–60. doi: 10.1146/annurev.immunol.18.1.529. [DOI] [PubMed] [Google Scholar]
- 16.Fritzsching B, Oberle N, Pauly E, et al. Naive regulatory T cells: a novel subpopulation defined by resistance toward CD95L-mediated cell death. Blood. 2006;108:3371–8. doi: 10.1182/blood-2006-02-005660. [DOI] [PubMed] [Google Scholar]
- 17.Haas J, Fritzsching B, Trubswetter P, et al. Prevalence of newly generated naive regulatory T cells (Treg) is critical for Treg suppressive function and determines Treg dysfunction in multiple sclerosis. J Immunol. 2007;179:1322–30. doi: 10.4049/jimmunol.179.2.1322. [DOI] [PubMed] [Google Scholar]
- 18.Kolte L, Strandberg C, Dreves AM, et al. Thymic involvement in immune recovery during antiretroviral treatment of HIV infection in adults; comparison of CT and sonographic findings. Scand J Infect Dis. 2002;34:668–72. doi: 10.1080/00365540210147705. [DOI] [PubMed] [Google Scholar]
- 19.Kolte L, Dreves AM, Ersboll AK, et al. Association between larger thymic size and higher thymic output in human immunodeficiency virus-infected patients receiving highly active antiretroviral therapy. J Infect Dis. 2002;185:1578–85. doi: 10.1086/340418. [DOI] [PubMed] [Google Scholar]
- 20.Mocellin S, Provenzano M, Rossi CR, Pilati P, Nitti D, Lise M. Use of quantitative real-time PCR to determine immune cell density and cytokine gene profile in the tumor microenvironment. J Immunol Methods. 2003;280:1–11. doi: 10.1016/s0022-1759(03)00274-6. [DOI] [PubMed] [Google Scholar]
- 21.Yuan JS, Wang D, Stewart CN., Jr Statistical methods for efficiency adjusted real-time PCR quantification. Biotechnol J. 2008;3:112–23. doi: 10.1002/biot.200700169. [DOI] [PubMed] [Google Scholar]
- 22.Miller AS, Dykes DD, Polesky HF. A simple salting out procedure for extracting DNA from human nucleated cells. Nucleic Acids Res. 1998;16:1215. doi: 10.1093/nar/16.3.1215. [DOI] [PMC free article] [PubMed] [Google Scholar]
- 23.Skogstrand K, Thorsen P, Norgaard-Pedersen B, Schendel DE, Sorensen LC, Hougaard DM. Simultaneous measurement of 25 inflammatory markers and neurotrophins in neonatal dried blood spots by immunoassay with xMAP technology. Clin Chem. 2005;51:1854–66. doi: 10.1373/clinchem.2005.052241. [DOI] [PubMed] [Google Scholar]
- 24.Sakaguchi S. The origin of FOXP3-expressing CD4+ regulatory T cells: thymus or periphery. J Clin Invest. 2003;112:1310–2. doi: 10.1172/JCI20274. [DOI] [PMC free article] [PubMed] [Google Scholar]
- 25.Sakaguchi S, Setoguchi R, Yagi H, Nomura T. Naturally arising Foxp3-expressing CD25+CD4+ regulatory T cells in self-tolerance and autoimmune disease. Curr Top Microbiol Immunol. 2006;305:51–66. doi: 10.1007/3-540-29714-6_3. [DOI] [PubMed] [Google Scholar]
- 26.Baecher-Allan C, Brown JA, Freeman GJ, Hafler DA. CD4+CD25high regulatory cells in human peripheral blood. J Immunol. 2001;167:1245–53. doi: 10.4049/jimmunol.167.3.1245. [DOI] [PubMed] [Google Scholar]
- 27.Hartigan-O’Connor DJ, Poon C, Sinclair E, McCune JM. Human CD4+ regulatory T cells express lower levels of the IL-7 receptor alpha chain (CD127), allowing consistent identification and sorting of live cells. J Immunol Methods. 2007;319:41–52. doi: 10.1016/j.jim.2006.10.008. [DOI] [PubMed] [Google Scholar]
- 28.Sakaguchi S, Ono M, Setoguchi R, et al. Foxp3+ CD25+ CD4+ natural regulatory T cells in dominant self-tolerance and autoimmune disease. Immunol Rev. 2006;212:8–27. doi: 10.1111/j.0105-2896.2006.00427.x. [DOI] [PubMed] [Google Scholar]
- 29.Eggena MP, Barugahare B, Jones N, et al. Depletion of regulatory T cells in HIV infection is associated with immune activation. J Immunol. 2005;174:4407–14. doi: 10.4049/jimmunol.174.7.4407. [DOI] [PubMed] [Google Scholar]
- 30.Zheng Y, Rudensky AY. Foxp3 in control of the regulatory T cell lineage. Nat Immunol. 2007;8:457–62. doi: 10.1038/ni1455. [DOI] [PubMed] [Google Scholar]
- 31.Hori S, Nomura T, Sakaguchi S. Control of regulatory T cell development by the transcription factor Foxp3. Science. 2003;299:1057–61. doi: 10.1126/science.1079490. [DOI] [PubMed] [Google Scholar]
- 32.Nilsson J, Boasso A, Velilla PA, et al. HIV-1-driven regulatory T-cell accumulation in lymphoid tissues is associated with disease progression in HIV/AIDS. Blood. 2006;108:3808–17. doi: 10.1182/blood-2006-05-021576. [DOI] [PMC free article] [PubMed] [Google Scholar]
- 33.Imami N, Pires A, Hardy G, Wilson J, Gazzard B, Gotch F. A balanced type 1/type 2 response is associated with long-term nonprogressive human immunodeficiency virus type 1 infection. J Virol. 2002;76:9011–23. doi: 10.1128/JVI.76.18.9011-9023.2002. [DOI] [PMC free article] [PubMed] [Google Scholar]
- 34.Clerici M, Shearer GM. A TH1 → TH2 switch is a critical step in the etiology of HIV infection. Immunol Today. 1993;14:107–11. doi: 10.1016/0167-5699(93)90208-3. [DOI] [PubMed] [Google Scholar]
- 35.Wan YY, Flavell RA. The roles for cytokines in the generation and maintenance of regulatory T cells. Immunol Rev. 2006;212:114–30. doi: 10.1111/j.0105-2896.2006.00407.x. [DOI] [PubMed] [Google Scholar]
- 36.Hazenberg MD, Verschuren MC, Hamann D, Miedema F, van Dongen JJ. T cell receptor excision circles as markers for recent thymic emigrants: basic aspects, technical approach, and guidelines for interpretation. J Mol Med. 2001;79:631–40. doi: 10.1007/s001090100271. [DOI] [PubMed] [Google Scholar]
- 37.Douek DC, Koup RA. Evidence for thymic function in the elderly. Vaccine. 2000;18:1638–41. doi: 10.1016/s0264-410x(99)00499-5. [DOI] [PubMed] [Google Scholar]
- 38.Jamieson BD, Douek DC, Killian S, et al. Generation of functional thymocytes in the human adult. Immunity. 1999;10:569–75. doi: 10.1016/s1074-7613(00)80056-4. [DOI] [PubMed] [Google Scholar]
- 39.Richardson MW, Sverstiuk A, Hendel H, Cheung TW, Zagury JF, Rappaport J. Analysis of telomere length and thymic output in fast and slow/non-progressors with HIV infection. Biomed Pharmacother. 2000;54:21–31. doi: 10.1016/s0753-3322(00)88637-0. [DOI] [PubMed] [Google Scholar]
- 40.Zhang L, Lewin SR, Markowitz M, et al. Measuring recent thymic emigrants in blood of normal and HIV-1-infected individuals before and after effective therapy. J Exp Med. 1999;190:725–32. doi: 10.1084/jem.190.5.725. [DOI] [PMC free article] [PubMed] [Google Scholar]
- 41.Mussini C, Pinti M, Borghi V, et al. Features of ‘CD4-exploders’, HIV-positive patients with an optimal immune reconstitution after potent antiretroviral therapy. AIDS. 2002;16:1609–16. doi: 10.1097/00002030-200208160-00006. [DOI] [PubMed] [Google Scholar]
- 42.Zenclussen AC. Regulatory T cells in pregnancy. Springer Semin Immunopathol. 2006;28:31–9. doi: 10.1007/s00281-006-0023-6. [DOI] [PubMed] [Google Scholar]
- 43.Zenclussen AC, Schumacher A, Zenclussen ML, Wafula P, Volk HD. Immunology of pregnancy: cellular mechanisms allowing fetal survival within the maternal uterus. Expert Rev Mol Med. 2007;9:1–14. doi: 10.1017/S1462399407000294. [DOI] [PubMed] [Google Scholar]
- 44.Clarke AG, Kendall MD. The thymus in pregnancy: the interplay of neural, endocrine and immune influences. Immunol Today. 1994;15:545–51. doi: 10.1016/0167-5699(94)90212-7. [DOI] [PubMed] [Google Scholar]
- 45.Kendall MD, Clarke AG. The thymus in the mouse changes its activity during pregnancy: a study of the microenvironment. J Anat. 2000;197:393–411. doi: 10.1046/j.1469-7580.2000.19730393.x. [DOI] [PMC free article] [PubMed] [Google Scholar]
- 46.Kendall MD, Clarke AG. The female thymus and reproduction in mammals. Oxf Rev Reprod Biol. 1994;16:165–213. [Google Scholar]