

Abstract
Malnutrition continues to be a major public health problem throughout the developing world. Nutritional deficiencies may be the most common cause of secondary immunodeficiency states in humans. It has been suggested that nutritional imbalances can induce apoptosis in a variety of cell types. The purpose of this study was to examine the effect of severe malnutrition on cell subsets and the frequency of spontaneous and/or dexamethasone-induced cell death in vivo in the thymus and spleen from severely malnourished, lactating rats. Apoptosis frequency was estimated by flow cytometry using annexin-V and terminal transferase-mediated dUTP nick-end labelling assay assays. The results obtained in the present study indicate that malnutrition is associated with a significant increase of spontaneously apoptotic cells in the thymus (9·8-fold) and spleen (2·4-fold). Increase in apoptosis was associated largely with CD4+CD8+ double-positive thymocytes. Unexpectedly, similar frequencies of spontaneous apoptosis of these cells were found in both well-nourished and malnourished rats. In contrast, consistent increases in the apoptosis of CD4−CD8− double-negative thymocytes were observed in malnourished rats. In addition, single-positive CD8+ and single-positive CD4+ thymocytes had higher frequencies of apoptosis in malnourished rats. The frequency of total dexamethasone-induced apoptosis was found to be similar in both groups of animals. Nevertheless, in malnourished dexamethasone-treated animals, the percentage of apoptotic double-negative thymocytes was significantly higher than in well-nourished animals, while the rate of apoptosis was lower among double-positive cells. In general, the thymus appears more sensitive to the effects of malnutrition and dexamethasone than the spleen. Furthermore, double-negative thymocytes appear to be the most affected.
Keywords: apoptosis, cell death, lymphoid atrophy, malnourished, spleen, thymus
Introduction
More than 10 million children under the age of 5 years die each year, most from preventable causes and almost all in poor countries [1]. Malnutrition is globally the most important risk factor for illness and death, and it particularly affects hundreds of millions of pregnant women and young children. Diets in these populations are frequently deficient in macronutrients [protein, carbohydrates and fat, leading to protein energy malnutrition (PEM)], micronutrients (electrolytes, minerals and vitamins, leading to specific micronutrient deficiencies) or both [2]. PEM is usually found in these at-risk populations and is a critical, yet underestimated factor in the susceptibility to infection [3]. PEM is an important health determinant for critically ill patients and increases susceptibility to infections in malnourished elderly patients, patients suffering from neoplasia or chronic disease, patients with anorexia, patients undergoing chemotherapy, or even patients under parenteral nutrition. In addition, malnutrition is an independent risk factor for nosocomial infections [4].
Several studies have shown that malnourished individuals frequently possess a greater susceptibility to infection with high mortality indices [5]. Malnutrition is an important cause of immune suppression and increases host susceptibility to infectious diseases. It has been proposed that malnutrition modifies the organism's defence processes, impairing lympho-haematopoietic organs and modifying the immune response. While the implications of haematopoietic modifications in malnutrition states are still obscure, they appear to be responsible for inefficient haematopoiesis, and they seem to be irreversible over the short term [6].
Experimental animal models have been useful in studying the effects of malnutrition at different levels and in different age populations [7]. Lymphoid atrophy is a well-recognized consequence of nutritional deprivation in animals, including man. The loss of lymphoid tissue associated with malnutrition is particularly pronounced in the thymus. Regardless of the origin of the malnutritional state, the thymus is largely affected [8].
The thymus is a primary lymphoid organ in which bone marrow-derived T cell precursors undergo differentiation, leading ultimately to the migration of positively selected thymocytes to peripheral lymphoid organs [9]. This process involves the sequential expression of various proteins and rearrangements of the T cell receptor (TCR) genes. It has been established that most immature thymocytes express neither the TCR complex nor the CD4 or CD8 accessory molecules. These cells are called double-negative (DN) thymocytes, and represent nearly 5% of total thymocytes. Maturation progresses with the acquisition of CD4 and CD8 markers generating CD4+CD8+ double-positive (DP) cells, which comprise nearly 80% of the thymocyte population. Only about 4% of DP cells are selected positively to generate mature CD4+ or CD8+ cells. Once this phenotype is acquired, thymocytes enter the medulla, where they remain for a few days before being released into the peripheral lymphoid pool [10].
Nutritional deficiencies have been demonstrated to induce programmed cell death, known as apoptosis, readily in a variety of cell types. Enhanced apoptosis in peripheral blood lymphocytes from malnourished children has been reported [11]. Several studies were carried out in an experimental zinc deficiency model. These studies proved that deficiencies in zinc and protein calorie intake cause elevated production of glucocorticoids, which initiate apoptosis in thymocytes. Because thymic atrophy and lymphopenia accompanied these deficiencies, it seemed probable that apoptosis might well play a key role in the disruption of lymphopoiesis in these two common forms of malnutrition [12].
For the study of the apoptotic process, we used the following flow cytometric techniques: phosphatidylserine translocation by annexin-V labelling and DNA fragmentation by the terminal transferase-mediated dUTP nick-end labelling assay (TUNEL assay), along with propidium iodide (PI) staining. Both techniques were used because phosphatidylserine translocation is assumed to be an early feature of programmed cell death and therefore may not imply inevitable cell death, while DNA internucleosomal fragmentation is one of the hallmarks of apoptotic cell death and is assumed to be a late feature associated clearly with cell death [13].
The aim of this study was to determine if malnutrition is associated with alterations of cell subsets and with an increased frequency of spontaneous and/or dexamethasone-induced cell death in vivo in the thymus and spleen of experimentally malnourished rats fed by lactation.
Materials and methods
Animals
Wistar rats were housed under a 12-h light/12-h dark cycle at 22–25°C and 45% relative humidity. Females with two previous litters were bred in acrylic boxes with Betachips bedding (Northeastern Products, Warrensburg, NY, USA). The nursing mothers were fed a balanced diet for rodents (Purina Mills International 5001, Richmond, VA, USA) and given filtered water ad libitum.
Experimental malnutrition and treatment regimen
The experiments were performed according to the guidelines for the use of experimental animals of the Autonomous Metropolitan University of Iztapalapa, which are in accordance with those approved by the National Institutes of Health (Bethesda, MD, USA). One-day-old Wistar rats from different litters were assigned randomly to two groups. In the well-nourished group, nursing mothers were each given six to eight pups. In the experimental or malnourished group, each nursing mother fed 15–16 pups. In the latter group, malnutrition was produced in the nursing pups due to food competition. Nursing mothers cannot feed 15–16 pups adequately, even with adequate milk production, so this feeding group results in lower weight gains and malnourishment.
Four groups of 17 rats each were studied. Group I contained well-nourished rats without treatment; group II contained well-nourished rats treated with dexamethasone for 20 h; group III contained malnourished rats without treatment; group IV contained malnourished rats treated with dexamethasone for 20 h. Well-nourished and malnourished rats were selected randomly from different litters. Four animals were processed simultaneously, one from each group.
Cell suspension and treatment
Treated rats were injected intraperitoneally with water soluble dexamethasone (Sigma Chemical Co., St Louis, MO, USA), 25 mg/kg body weight, 20 h before they were euthanized by an ether overdose. Control animals (without treatment) received only buffered saline solution. Thymus and spleen cells were obtained by sieving the tissue through a nylon screen and resuspending the resulting cells in phosphate-buffered saline (PBS) solution (Ca2+- and Mg2+-free PBS solution; Microlab, DF, México).
Cell surface antigen staining
Commercially available conjugated anti-rat antibodies were used: Cy-Chrome-anti-CD4 and phycoerythrin-anti-CD8 (BD-Pharmingen, San Jose, CA, USA). Briefly, 100 µl of cell suspension was incubated with 10 µl of a fluorescence-conjugated antibody for 30 min at 4°C. After incubation, cells were washed with 1% bovine serum albumin prepared in PBS. Subsequently, the cells were stained for the TUNEL or annexin-V assays.
The TUNEL assay
The in situ cell death kit (Boehringer Mannheim Biochemica, Germany) was used to perform the TUNEL assay. Briefly, cell suspensions were placed on ice, fixed, permeabilized, washed and incubated at 37°C for 60 min in the dark with the TUNEL reaction mixture containing terminal deoxynucleotidyl transferase (TdT) and fluorescein-dUTP. The label incorporated at the DNA break sites was visualized by flow cytometry.
Annexin-V assay
Measurements were made with the annexin-V–FLUOS staining kit (Roche Diagnostics, Germany). Staining was performed according to the manufacturer's instructions. Briefly, cell suspensions were washed in ice-cold PBS and incubated at room temperature in the dark for 15 min with the binding buffer containing annexin-V–FLUOS and PI. Samples were analysed by flow cytometry immediately after washing. Samples for the subset analysis were stained with only annexin-V–FLUOS.
Flow cytometry analysis
Two-colour flow cytometry analysis was performed for early and late apoptosis, and three-colour flow cytometry analysis was performed for apoptosis in subpopulations. A fluorescence activated cell sorter (FACSCalibur) flow cytometer [Becton Dickinson, Immunocytometry Systems (BDIS), San Jose, CA, USA] was used for all analyses. List mode data of 10 000 events were collected for each sample, and data analysis was performed using CELLQuest software (BDIS). The markers for determining positive and negative cells were set according to negative controls in all cases to account for background fluorescence.
Statistical analysis
Results are expressed as arithmetic means ± standard error. Differences between groups were analysed using the Mann–Whitney U-test for unpaired samples. Differences with P-values < 0·05 were considered statistically significant.
Results
Table 1 shows the means and standard deviations of body weight, thymus and spleen weights and the number of cells per thymus and spleen for all groups of rats. The average body weight of rats 1 day after birth was similar in both groups. At weaning, the malnourished (MN) rats weighed 49·9% less than the well-nourished animals (WN), implying severe protein–calorie malnutrition.
Table 1.
Body weight, thymic and splenic weight and number of cells per organ in well-nourished and malnourished rats.
| Non-treated | Dexamethasone-treated | |||||||
|---|---|---|---|---|---|---|---|---|
| Well-nourished | Malnourished* | Well-nourished | Malnourished† | |||||
| Mean | s.e. | Mean | s.e. | Mean | s.e. | Mean | s.e. | |
| Body weight (g) | 52·2 | 0·9 | 25·7 | 0·8 | 50·8 | 1·4 | 24·4 | 1·2 |
| Body weight deficit (%) | 49·9 | 1·7 | 52·0 | 2·5 | ||||
| Spleen weight (mg) | 179·1 | 15·1 | 77·3 | 7·9 | 177·2 | 13·0 | 72·6 | 12·1 |
| Spleen weight deficit (%) | 54·7 | 5·3 | 62·5 | 5·5 | ||||
| Cells/spleen (×106) | 159·5 | 20·0 | 65·6 | 7·7 | 148·0 | 20·5 | 59·8 | 12·1 |
| Spleen cell deficit (%) | 64·9 | 4·1 | 69·2 | 6·0 | ||||
| Thymus weight (mg) | 135·4 | 16·6 | 67·9 | 11·3 | 128·3 | 7·4 | 61·7 | 5·1 |
| Thymus weight deficit (%) | 55·2 | 7·0 | 54·2 | 3·7 | ||||
| Cells/thymus (×106) | 234·7 | 31·4 | 131·2 | 8·3 | 216·1 | 33·2 | 113·1 | 16·6 |
| Thymus cell deficit (%) | 44·1 | 3·6 | 52·7 | 9·1 | ||||
Significant difference between well-nourished versus malnourished non-treated rats:
P < 0:05. Significant difference between well-nourished versus malnourished dexamethasone-treated rats:
P < 0·05.
No significant difference between non-treated versus dexamethasone-treated rats; s.e., standard error.
In MN rats there was a 55·2% decrease in thymus weight versus the well-nourished animals, and a 44·1% decrease in the number of thymocytes per thymus in MN was observed. In addition, there was a 54·7% decrease in spleen weight and a 64·9% drop in the number of spleen cells per spleen in the malnourished group (Table 1). Dexamethasone-treated (DEX-treated) animals had slightly lower values in relation to non-treated animals. Lower values of cells were found in the thymus and spleen in both WN and MN DEX-treated rats, without significant differences in relation to non-treated animals (Table 1).
Effects of malnutrition and dexamethasone on thymocyte subpopulations
To study the impact of malnutrition on thymopoiesis, we examined its effect on the various CD4/CD8 subpopulations by flow cytometry using fluorescent antibodies against these cell surface markers.
Comparison of the CD4/CD8 subpopulations between WN and MN rats showed that in MN rats, the percentage of CD4−CD8− DN cells was greatly enhanced (3·6-fold increase; 8·8% and 2·4% for MN and WN respectively), and that single-positive (SP) CD4+ thymocytes were significantly less prevalent (reduction of 40·1%; 7·7% and 13·0% for MN and WN respectively). The percentages of CD4+CD8+ DP and SP CD8+ cells were similar in both groups of animals (Fig. 1a). In DEX-treated animals, a significant decrease in DP cells was found in both groups of rats (from 72·7% in WN to 62% in WN-DEX and 69·9 in MN to 56·8 in MN-DEX). The prevalence of DN cells was increased, which agrees with the difference between MN and WN (13·0% and 8·2% for MN-DEX and WN-DEX respectively). In addition, an increase in the percentage of SP CD4+ cells in MN-DEX (12·7%) rats was found compared with MN non-treated animals (7·7%) (Fig. 1b).
Fig. 1.
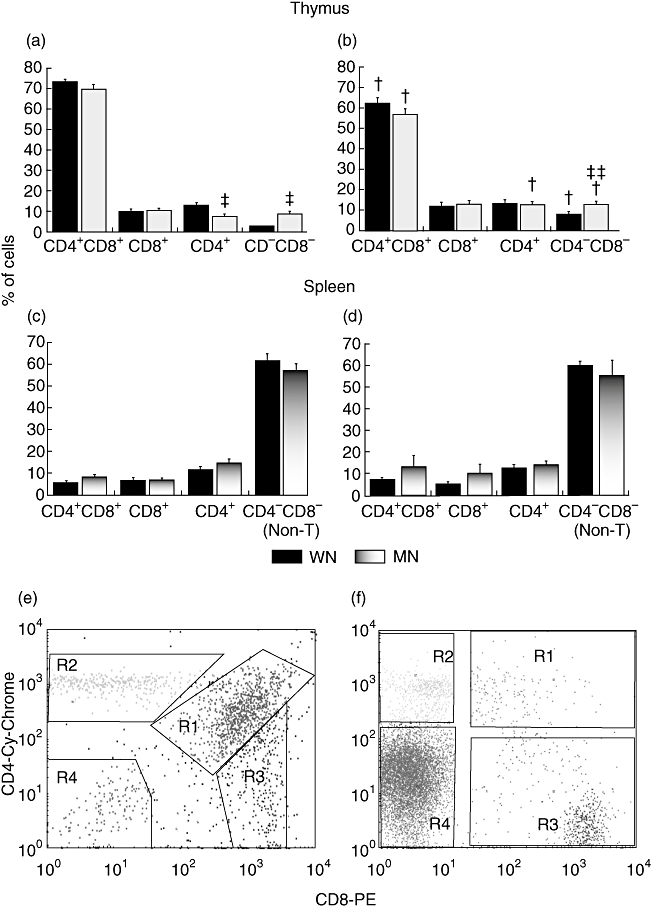
Effects of malnutrition and dexamethasone on thymocyte and splenocyte subpopulations. Percentages of thymocyte subsets in non-treated (a) and dexamethasone treated (b) well-nourished (WN, n = 16) and malnourished (MN, n = 16) rats. Percentages of splenocyte subsets in non-treated (c) and dexamethasone-treated (d) WN (n = 6) and MN (n = 6) rats. These data are based on the flow cytometric analysis of 10 000 events, and are presented as mean ± standard error. *P < 0·001, difference between the MN versus WN group. +P < 0·01, difference between DEX-treated and untreated cells. **P < 0·01, difference between MN-DEX versus WN-DEX groups. Representative flow cytometric analysis of CD4 and CD8 expression. Thymocytes (e) and splenocytes (f) stained with anti-CD8-phycoerythrin (PE) and anti-CD4-Cy-Chrome cell surface marker antibodies and then analysed by flow cytometry. R1 = DP, double-positive subpopulation (CD4+CD8+), R2 = single-positive CD4+, R3 = single-positive CD8+, R4 = DN, double-negative subset (CD4−CD8−) in the thymus, as well as non-T cells in the spleen.
Effects of malnutrition and dexamethasone on splenocytes
The main subpopulation found was the CD4−CD8− (non-T cells) population, which was 57·2% of the total population in MN and 61·6% in WN rats. The percentages of the CD4+ splenic T cell subpopulation were 14·9% and 11·6% respectively. For CD8+ cells, the percentages were practically the same in both groups (6·6%). No differences were found between MN and WN rats (Fig. 1c). In DEX-treated animals the percentages were similar between groups. A slight increase in CD4+CD8+ cells was found in MN-DEX (13·4%) in relation to MN non-treated animals (8·0%), with no differences between groups (Fig. 1d).
Representative flow cytometric analysis with CD4 and CD8 staining is shown in Fig. 1e for thymocyte subpopulations and Fig. 1f for splenocytes.
Early and late apoptosis
One of the earliest indications of apoptosis is the translocation of the membrane phospholipid phosphatidylserine from the cytosol to the outer monolayer of the plasma membrane. This process is detected using annexin-V conjugated to fluorescein isothiocyanate (FITC) [14]. Double-staining with annexin-V–FITC and PI creates a profile where live cells are negative for both dyes, early apoptotic cells are positive only for annexin-V–FITC, and cells that are positive for both dyes are either in the late stages of apoptosis or are already dead.
Early and late apoptosis in the thymus
Increased percentages of spontaneous early and late apoptosis were observed in thymocytes from non-treated MN rats (early: 32·9% and late: 14·1%) compared with WN rats (early: 18·8% and late: 3·2% respectively). In DEX-treated animals, significantly increased frequencies of early and late apoptosis were observed in both groups. For early apoptosis, the frequencies were 55·2% in MN-DEX and 52·5% in WN-DEX rats, with no differences between groups. The percentage of DEX-induced late apoptosis was significantly higher in MN (21·8%) than in WN rats (11·9%, P < 0·001; Fig. 2a).
Fig. 2.
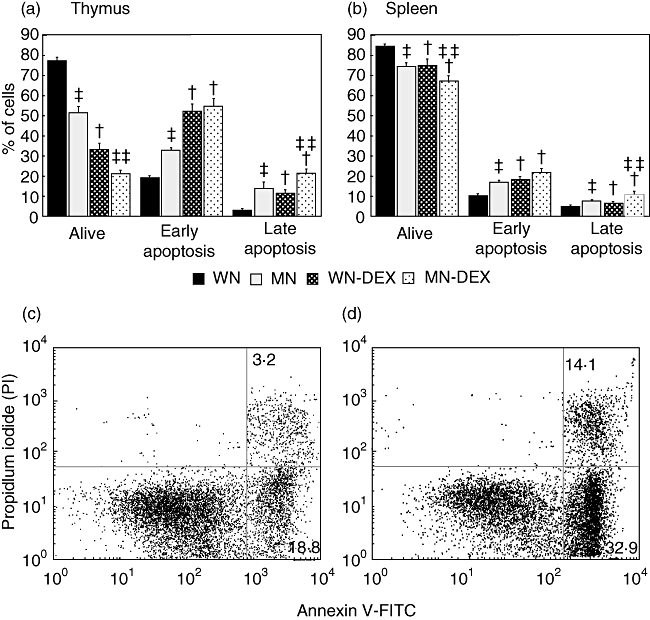
Effects of malnutrition and dexamethasone on early and late apoptosis in thymocytes and splenocytes. Total thymocytes were first analysed by flow cytometry for annexin-V binding and propidium iodide staining. A gate was set on the forward-scatter (FSC)–side-scatter (SSC) to restrict analysis to single cells and exclude debris. Percentages of alive, early and late apoptosis found in the thymus (a) and spleen (b) from the four study groups. Representative dot plot of the analysis in non-treated thymocytes, lower and upper right quadrants indicate early and late apoptotic cells respectively. Numbers indicate the average percentage in well-nourished (WN) (c) and malnourished (MN) (d) rats. Data are based on the flow cytometric analysis of 10 000 events and reported as mean ± standard error of nine rats per group (n = 9). WN = well-nourished without dexamethasone, MN = malnourished without dexamethasone, WN-DEX = well-nourished treated with dexamethasone for 20 h, MN-DEX = malnourished treated with dexamethasone for 20 h. *P < 0·02, difference between the MN and WN groups. **P < 0·02, difference between the MN-DEX and WN-DEX groups. +P < 0·03, difference versus untreated cells.
Early and late apoptosis in the spleen
In non-DEX-treated rats, increased percentages of spontaneous early and late apoptosis in splenocytes were observed in MN (early: 17·4% and late: 7·9%) compared with WN rats (early: 10·5% and late: 5·1%). In DEX-treated animals, significantly increased frequencies of early apoptosis were observed in both groups: 21·9% for MN-DEX and 18·2% for WN-DEX, with no difference between MN and WN rats. No differences were observed in late apoptosis DEX-treated rats compared with non-treated animals (7·9% in MN and 10·9% in MN-DEX; 5·1% in WN and 6·5% in WN-DEX). Nevertheless, a significant difference was found between MN-DEX in comparison with WN-DEX (Fig. 2b).
Representative dot plots of this analysis are shown in Fig. 2; Fig. 2c illustrates representative plots for WN animals and Fig. 2d shows data for MN rats.
Apoptosis (in thymocytes) by the TUNEL assay
To study the apoptotic process, we also analysed DNA fragmentation. One of the best-described characteristics of apoptosis is the selective degradation of the internucleosomal DNA linker regions. The flow cytometric TdT assay to detect apoptosis-associated DNA degradation is extremely sensitive compared with gel electrophoresis. In addition, the method of detection of DNA strand breaks (3′-hydroxyl termini) in individual cells offers several advantages and can be applied to clinical material [15].
Total (overall) apoptosis in the thymus
A 9·8-fold increase in spontaneously apoptotic thymocytes was found in MN rats in comparison with WN animals. The frequencies were 18·7% in MN (range 9·2–31·3%) and 1·9% in WN thymocytes (range 0·7–3·7%; Fig. 3a).
Fig. 3.
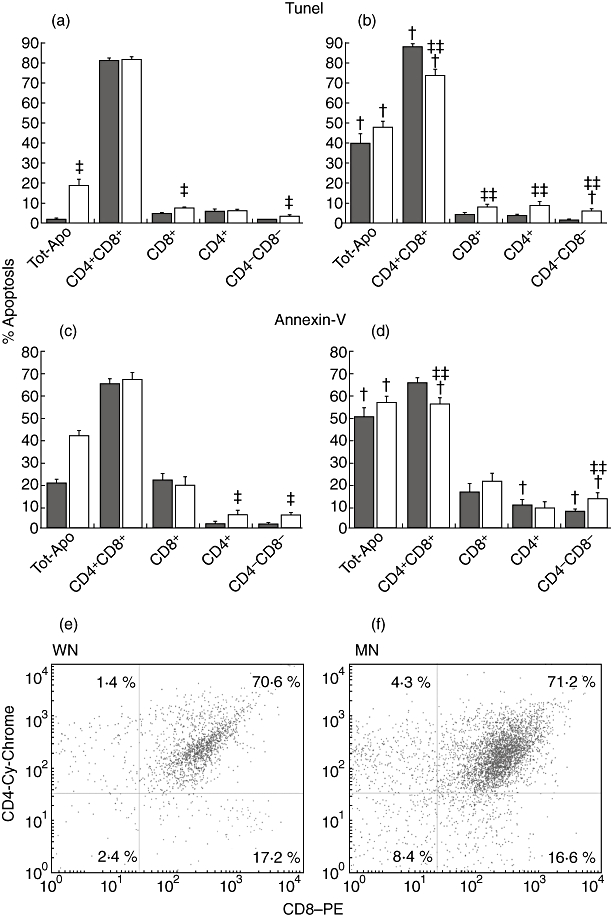
Effects of malnutrition and dexamethasone on the apoptosis of thymocyte subpopulations analysed by terminal transferase-mediated dUTP nick-end labelling (TUNEL) assay (a, b) and annexin-V assays (c, d). The percentage of spontaneous and dexamethasone-induced apoptosis determined by the TUNEL assay in thymocytes is shown in the upper panel (a, b). (a) Data obtained in untreated rats; (b) dexamethasone-treated rat data. Well-nourished (WN, n = 10) and malnourished (MN, n = 10) rats. *P < 0·02, difference between MN versus WN group (WN versus MN: CD8 P < 0·0294; CD4−CD8−P < 0·0001). **P < 0·003, difference between the MN-DEX and WN-DEX groups. (WN-DEX versus MN-DEX: CD4+CD8+, P < 0·0001; CD8, P < 0·0028; CD4, P < 0·0035; CD4−CD8−, P < 0·0004). +P < 0·02, difference versus untreated cells (WN versus WN-DEX CD4+CD8+, P < 0·0007; MN versus MN-DEX: CD4+CD8+, P < 0·0206; CD4−CD8−, P < 0·002). The middle panels (c, d) show the percentages of thymocyte subsets undergoing apoptosis as detected with the annexin-V assay for untreated (c) and dexamethasone-treated (d) WN (n = 7) and MN (n = 7) rats. The two columns on the left show the total percentage of apoptosis (Tot-Apo). Data are based upon flow cytometric analysis of 10 000 events and are presented as mean ± standard error. *P < 0·01, differences between the MN and WN groups (WN versus MN: CD4, P < 0·01; CD4−CD8−, P < 0·005). **P < 0·05, difference between the MN-DEX and WN-DEX groups (WN-DEX versus MN-DEX: CD4+CD8+, P < 0·01; CD4−–CD8−, P << 0·050). +P < 0·01, difference versus untreated cells (MN versus MN-DEX: CD4+CD8+, P < 0·01; CD4−CD8−, P < 0·01; WN versus WN-DEX: CD4+, P < 0·01; CD4−CD8−, P < 0·005). The lower panels (e, f) show representative dot plots of spontaneous apoptosis in thymocyte subsets from WN (e) and MN rats (f). The thymocyte gate was set using annexin-V–fluorescein isothiocyanate-positive cells; this gate was set to restrict the analysis to apoptotic thymocytes. Thymocytes highly labelled with annexin-V were analysed further on the basis of anti-CD8-phycoerythrin and anti-CD4 Cy-Chrome labelling. Numbers within each of the four outlined areas indicate the percentage of the respective subpopulation: upper right, CD4+CD8+ double-positive (DP) thymocytes; upper left, single-positive (SP) CD4+; lower right, single-positive (SP) CD8+, and lower left, CD4−CD8− double-negative thymocytes (DN). The percentage of fluorescence-positive cells that were detected from one rat from each of the WN and MN groups is indicated in the corresponding squares. Data are based upon flow cytometric analysis of 2154 events (21·54% of total cells were apoptotic) for the WN rats and 4930 events (49·3% of total cells were apoptotic) for the MN rats.
As expected, in vivo treatment with dexamethasone for 20 h increased the level of apoptosis in thymocytes in both groups of rats. Data obtained with the TUNEL assay show a 21-fold increase in WN DEX-treated (1·9–40·1%, range 22·2–60·9%) and a 2·6-fold increase in MN DEX-treated rats (18·7–47·9%, range 34·6–59·4%; Fig. 3b). Surprisingly, the percentages of apoptotic thymocytes in DEX-treated rats were similar in both the MN and WN groups.
To determine with which subpopulation of cells the increase in apoptosis was associated, we identified the percentage of CD4+CD8+ DP, SP CD4+, SP CD8+ and CD4−CD8− DN thymocytes within the TUNEL-positive population (Fig. 3). As expected, the apoptosis is associated largely with DP thymocytes. Unexpectedly, similar frequencies of spontaneous apoptotic DP thymocytes were found in both groups of rats (81%). In contrast, 2·2-fold increases of apoptotic DN cells in MN versus WN rats were observed (3·7% and 1·7% respectively). Additionally, significantly higher percentages of apoptotic SP CD8+ thymocytes were found in the MN group than in the WN group (7·7% and 4·9% respectively) (Fig. 3a).
In DEX-treated animals, there was an increased rate of apoptosis in SP CD4+, SP CD8+ and DN thymocytes in MN DEX-treated rats (9·2%, 8·5% and 6·5% respectively) compared with WN-DEX (4·0%, 4·7% and 1·7% respectively). In contrast, a decreased rate of apoptosis was observed in DP thymocytes in MN-DEX (73·9%) compared with WN-DEX rats (88·2%) (Fig. 3b).
In addition, MN-DEX animals showed significant increases in percentages of apoptosis in DN thymocytes (from 3·7% to 6·5%), and significantly decreased percentages (from 81·4% to 73·9%) of DP thymocytes in apoptosis compared with MN rats without treatment. In contrast, increased rates of apoptosis were found in DP cells in WN DEX-treated animals (88·2%) compared with non-treated WN rats (81·0%) (Fig. 3b).
Determination of apoptosis in thymocytes by the annexin-V assay
The annexin-V assay reported that the overall spontaneous apoptotic frequencies were twice as high in the thymocytes of MN rats (42·1%, range 34·4–51·8%) compared with WN rats (20·9%, range 16·2–25·9%) (Fig. 3c). As anticipated, the apoptosis is associated largely with DP thymocytes. Similar frequencies of spontaneous apoptotic DP thymocytes were found in both the MN and WN groups of rats (66·9% and 65·1% respectively). In contrast, 2·6-fold increases in the percentage of apoptotic DN and 2·7-fold increases of apoptotic SP CD4+ thymocytes were found in the MN group (6·3% and 6·5% respectively) compared with the WN group (2·4% in both cases; Fig. 3c).
An increased rate of apoptosis was found in DEX-treated animals. The data show a 2·4-fold increase in WN DEX-treated rats (from 20·9% to 50·2%, range 32·2–71·9%). An increase from 42·1% to 56·9% (range 48·2–67·9%) was found in MN DEX-treated animals. The percentages of DEX-induced apoptotic cells showed no statistically significant differences among the groups (Fig. 3d).
In DEX-treated animals, an almost twofold increase in the rate of apoptosis of DN thymocytes was observed in MN-DEX rats (13·2%) compared with WN-DEX rats (7·3%). In contrast, a decreased rate of apoptosis was observed in DP thymocytes in MN-DEX rats (56·1%) compared with WN-DEX rats (65·7%). There were also significant decreases in apoptosis in MN-DEX rats in comparison with MN-non-treated rats (66·9% versus 56·1%) (Fig. 3d).
Figure 3 shows representative dot plots of spontaneous apoptosis of thymocyte subsets from WN (Fig. 3e) and MN rats (Fig. 3f).
Determination of apoptosis in splenocytes by the TUNEL assay
A significant, 2·4-fold increase of spontaneous apoptosis in total splenic cells was found in MN (4·2 ± 0·2%) in relation to WN (1·7 ± 0·2%) rats (P < 0·05). The rate of spontaneous apoptosis in the different subsets was similar between MN and WN rats. For the CD4−CD8− subset (non-T cells), spontaneous apoptosis was 8·1 ± 2·3% in MN rats and 11·3 ± 3·7% in WN rats. For SP CD4+ cells, the apoptotic percentages were 10·8 ± 2·8% and 5·9 ± 1·6% respectively. SP CD8+ cells comprised 23·8 ± 5·2% of cells in MN rats and 20·9 ± 4·6% in WN rats, with no significant difference between the two groups (P > 0·05). In addition, increased rates of apoptosis were found in DEX-treated animals (5·9 ± 0·2% and 4·3 ± 0·5% for MN-DEX and WN-DEX animals respectively) (P < 0·05). Nevertheless, the frequencies of apoptosis in the splenic subpopulation were similar among study groups, and thus showed no significant difference (P > 0·05).
Determination of apoptosis in splenocytes by the annexin-V assay
A significant 34% increase in the rate of spontaneous apoptosis in total splenic cells was found in MN rats (24·2 ± 0·8%) in relation to WN rats (16·1 ± 0·5%) (P < 0·0001). In addition, increased rates of apoptosis were found in DEX-treated animals (32·9 ± 1·8% and 22·3 ± 1·7% for MN-DEX and WN-DEX groups respectively) (P < 0·0003). A significant difference was identified in the comparison of MN-DEX to WN-DEX rats (P < 0·001). Nevertheless, the frequencies of apoptosis in the splenic subpopulation were similar in the four study groups and were similar to those obtained with the TUNEL assay (data not shown).
Discussion
The present work studied the effect of malnutrition on the apoptosis of thymocytes and splenocytes from experimentally malnourished rats fed with lactation. Cells derived from malnourished rats showed higher spontaneous apoptosis than the rate observed in cells from well-nourished rats. This was a generalized phenomenon, found in the thymus and spleen and detected by both TUNEL and annexin-V assays. The enhanced level of spontaneous apoptosis may be related to the marked thymic and splenic atrophy found in the malnourished rats. In addition, the results show that double-negative thymocytes from malnourished rats are the most susceptible to spontaneous and dexamethasone-induced apoptosis. Furthermore, increased frequencies of apoptosis were observed in SP helper and cytotoxic thymocytes from 21-day-old malnourished rats.
The deficit in body weight, thymus and spleen weight and number of cells per thymus and spleen observed in malnourished rats shows that malnutrition induced during the lactation period is associated with a loss of lymphoid tissues. This finding agrees with previous observations which determined that thymocyte depletion is an outcome of both acute and chronic experimental protein malnutrition [8,16], and that experimental malnutrition in rodents is associated with bone marrow and splenic atrophy [17]. The slight decreases in these parameters found in DEX-treated animals support the idea that dexamethasone administration causes moderate involution and atrophy of the thymus with the simultaneous loss of cells and a fall in the mitotic activity of thymocytes [18].
It is important to point out that studies with this experimental model of malnutrition as induced by competition for maternal milk during lactation are significant, as malnourished rats show several symptoms that are similar to the clinical features of malnourished children (i.e. the model mimics the conditions of malnutrition in childhood) [7]. In addition, restricted intake of a complete diet or a low-protein diet for 6–14 days also causes acute malnutrition in weanling mice [19].
We have demonstrated previously that severe malnutrition induced in rats during lactation is associated with increased levels of total spontaneous thymocyte apoptosis. From these findings, we supposed that the greater levels of spontaneously apoptotic cells associated with malnutrition could be related to alterations of the microenvironment of the thymus and/or to an obstruction of early thymocyte maturation [20]. In addition, the data show that malnutrition results in a clear increase in apoptosis in the spleen. These observations agree with previous reports involving malnourished children and experimental malnutrition [6,11,21].
Effects of malnutrition on thymocyte subpopulations
The generation of various T cells in the thymus is a complex biological process that combines proliferation, differentiation, apoptosis, selection and commitment to different lineages [22].
The data in the present study show that malnutrition caused a 3·6-fold increase in the prevalence of the double-negative thymocytes (CD4−CD8−), the most immature population in the thymus that arises from stem cells. This DN subset differentiates into CD4+CD8+ DP thymocytes, the main subpopulation in the thymus, which unexpectedly showed no difference in prevalence with respect to malnutrition. DP cells differentiate further into SP CD4+ helper and CD8+ cytotoxic lineages. The data show that SP CD4+ thymocytes frequency was reduced significantly in malnourished rats. Under experimental conditions, the inhibition of thymocyte development caused an accumulation of immature CD4−CD8− thymocytes within the organ [23]. In addition, impairment of the transition switch of the CD45 isoforms from CD45RA+ (naive cells) to CD45RO+ (memory cells) was reported in CD4+ and CD8+ T cells from the spleen, mesenteric lymph nodes and blood of weaning malnourished mice [24] and in peripheral blood lymphocytes from malnourished children [25]. The data observed in malnourished rats suggest an impediment of early thymocyte maturation. The inadequate differentiation capability may be one of the mechanisms involved in the immunodeficiency observed in malnourished organisms, and this correlates with the apoptosis data.
A significant decrease in the prevalence of DP cells following dexamethasone-treatment was found in the thymus in both groups of rats. However, DN cells were increased in malnourished rats. In the spleen, the distribution of subpopulations was similar between malnourished and well-nourished rats. In general, the spleen appears to be less sensitive to dexamethasone and nutritional deficiencies than the thymus [26].
Analysis of apoptosis in subpopulations
Flow cytometric assays have the advantage of detecting apoptosis in single cells. Additionally, multi-parameter FACS allows for the simultaneous analysis of phenotype and apoptosis [27]. To study the apoptotic process, we first analysed the total cell sample for DNA fragmentation and annexin-V binding. The data revealed significantly higher frequencies of spontaneous apoptosis detected with annexin-V in than those observed with the TUNEL assay. This difference may be related to the observation that phosphatidylserine translocation, detected by annexin-V, is an early feature of programmed cell death that occurs before ‘the point-of-no-return’ and is not always associated with inevitable apoptosis, whereas DNA fragmentation is associated clearly with cell death [13].
In relation to the susceptibility of subpopulations to apoptosis, the main represented subpopulation was the double-positive thymocytes. Unexpectedly, similar frequencies of spontaneous apoptotic frequencies in DP thymocytes were found in well-nourished and malnourished rats. Indeed, the results of this study demonstrated that the DN thymocytes are more susceptible to spontaneous apoptosis in malnourished rats compared with well-nourished rats. Moreover, increased frequencies of apoptosis were observed in SP helper and cytotoxic thymocytes from 21-day-old malnourished rats. These observations differ from previous reports, where increased frequencies in the apoptosis rates of DP thymocytes were found to be associated with acute and chronic zinc deficiency in young adult mice [12,28]. The discrepancy may be due to nutritional deficiencies (i.e. zinc deficiency versus multiple deficiency) to experimental model (specie and age of the study animals) and conditions (in vitro versus in vivo).
The greater susceptibility of the DN thymocytes to apoptosis may indicate that malnutrition has an effect on early differentiation in the thymus. This may be associated with alterations in the physiology of the thymus and the thymic microenvironment observed in malnourished animals [8]. In vivo treatment with dexamethasone for 20 h caused increased levels of apoptotic thymocytes in both groups of rats. An increased susceptibility to dexamethasone-induced apoptosis in vivo in thymocytes from malnourished rats was not detected. This was a general phenomenon, because no differences were found with annexin-V or TUNEL assays. It seems that the same fraction of thymocytes is susceptible to activation of apoptosis, regardless of whether it is triggered by glucocorticoids or malnutrition at a certain time. When thymocytes were challenged with dexamethasone in malnourished rats, there were no more thymocytes with apoptotic propensity than were detected in well-nourished rats.
However, the data show an altered representation of thymocyte subpopulations in apoptosis in malnourished rats. Consistent increases were found in the apoptosis rate of DN thymocytes. In contrast, a decreased rate of apoptosis in DP thymocytes was observed in malnourished rats in relation to well-nourished animals. The data found in malnourished rats disagree with the well-established susceptibility of DP thymocytes to apoptosis following in vivo dexamethasone treatment [29]. At present we have no explanation for this discrepancy. It has been shown that resistance to glucocorticoid in vivo is not due to an alteration on the glucocorticoid receptor or to expression of Bcl-2, but rather to some exogenous thymic factor and/or cell–cell contact that probably alters glucocorticoid receptor/signalling [30]. Further studies are needed to define all the possible factors, exogenous and endogenous, which in different circumstances and environments may cause the variability of cell death.
Dexamethasone had less of an effect in the spleen. Nevertheless, a high frequency of overall apoptosis (as determined by the annexin-V assay) was found in the spleens of malnourished rats. Moreover, the frequencies of apoptosis in splenic subpopulations were similar between malnourished and well-nourished animals.
The mechanisms triggering the thymocyte depletion observed in nutritional deficiencies and malnutrition are not understood completely, although a stress-dependent glucocorticoid-related pathway seems to be involved. It has been established that these deficiencies are associated with increased production of glucocorticoids that accelerate apoptosis [8,19]. Glucocorticoids utilize the Bcl-2 modulated pathway of apoptosis. This pathway is also used when cells are deprived of sera or essential nutrients [9]. Knowledge of this pathway led to the supposition that the endogenously produced glucocorticoids, perhaps acting in synergy with nutritional deficiencies, would initiate this death pathway, causing accelerated death among cells with low levels of Bcl-2 expression [31].
The severe atrophy associated with malnutrition is due to apoptosis-induced thymocyte depletion as well as a decrease in cell proliferation in the thymus gland, and is linked apparently to a hormonal imbalance involving a decrease of leptin. Leptin has been reported to inhibit induction of apoptosis in fasted mice [32]. In addition, we have demonstrated recently that exogenous leptin modulates the synthesis of cytokines and improves the activation capability of peripheral blood CD4+ and CD8+ cells from malnourished children [33].
Malnourished individuals frequently have a greater susceptibility to infection with high morbidity and mortality indices, as malnutrition modifies the organism's defence processes [6]. The relationship between malnutrition and immune suppression and infection is complicated by the profound effects of a number of infections on nutrition itself. Furthermore, the relevance of overnutrition, a newly emerging public health problem in industrialized societies, has been recognized recently. Nutritional quality and composition have been determined as essential for anti-infectious immunity [3]. Further studies will be necessary to address the relationship between malnutrition and infection. For the study of these associations the use of a model of acute infection may be especially relevant [34].
Increased understanding of the organization of the immune system and the factors that regulate immune function have demonstrated a remarkable and close concordance between host nutritional status and immunity [3]. Because the thymus is responsible for the provision of T lymphocytes to the entire body and provides a unique microenvironment in which T cell precursors (thymocytes) undergo development, differentiation and clonal expansion [9], information regarding the physiology of the thymus is essential to understand more clearly the immunodeficiency seen in malnourished individuals [8].
The apoptotic mechanism of immunosuppression is becoming a subject of active consideration in analysing the pathogenesis of many human diseases, including cancer, viral infections, allergic diseases, autoimmune disorders and immunodeficiency conditions. Analysis of immunocompetent cells at the activation stage and of subsequent processes of excessive and insufficient apoptosis may be of importance in the knowledge of the immunopathogenesis of many diseases. Better understanding of the molecular and cellular changes made in response to inadequate nutrients should lead to the development of immunotherapeutic interventions [35]. The study of the inter-relationships between nutritional status and cell death is in its first phase, with much remaining to be learned.
In conclusion, the data in the present study are in agreement with the observation that malnutrition plays an important role in thymus and spleen atrophy by increasing the rate of spontaneous apoptosis. The results of this study indicate that, in rats, severe malnutrition induced during lactation affects DN thymocytes significantly. In addition, increased rates of apoptosis were observed in SP helper (CD4+), and cytotoxic (CD8+) thymocytes from 21-day-old malnourished rats.
The data show that the thymocyte and splenocyte fractions susceptible to dexamethasone-induced apoptosis were similar between malnourished and well-nourished rats. Nevertheless, malnourished rats show higher rates of apoptotic DN thymocytes, and in contrast, lower rates in DP thymocytes than those of well-nourished animals. These alterations may contribute to the immune suppression found in malnourished organisms.
Acknowledgments
We thank M. V. Z. Lourdes Pérez and Rocío González for the use of animal facilities. This work was supported in part by grants from CONACYT (México), grant 50804, and from PROMEP (México).
References
- 1.Caulfield LE, de Onis M, Blössner M, Black RE. Undernutrition as an underlying cause of child deaths associated with diarrhea, pneumonia, malaria, and measles. Am J Clin Nutr. 2004;80:193–8. doi: 10.1093/ajcn/80.1.193. [DOI] [PubMed] [Google Scholar]
- 2.Black RE, Allen LH, Bhutta ZA, et al. Maternal and child undernutrition: global and regional exposures and health consequences. Lancet. 2008;371:243–60. doi: 10.1016/S0140-6736(07)61690-0. [DOI] [PubMed] [Google Scholar]
- 3.Schaible UE, Kaufmann SH. Malnutrition and infection: complex mechanisms and global impacts. PLoS Med. 2007;4:e115. doi: 10.1371/journal.pmed.0040115. [DOI] [PMC free article] [PubMed] [Google Scholar]
- 4.Schneider SM, Veyres P, Pivot X, et al. Malnutrition is an independent factor associated with nosocomial infections. Br J Nutr. 2004;92:105–11. doi: 10.1079/BJN20041152. [DOI] [PubMed] [Google Scholar]
- 5.de Onis M. Measuring nutritional status in relation to mortality. Bull World Health Organ. 2000;78:1271–4. [PMC free article] [PubMed] [Google Scholar]
- 6.Borelli P, Blatt SL, Rogero MM, Fock RA. Haematological alterations in protein malnutrition. Rev Bras Hematol Hemoter. 2004;26:49–56. [Google Scholar]
- 7.Ortiz R, Cortés E, Pérez L, González C, Betancourt M. Assessment of an experimental method to induce malnutrition by food competition during lactation. Med Sci Res. 1996;24:843–46. [Google Scholar]
- 8.Savino W. The thymus gland is a target in malnutrition. Eur J Clin Nutr. 2002;56:S46–9. doi: 10.1038/sj.ejcn.1601485. [DOI] [PubMed] [Google Scholar]
- 9.Ribatti D, Crivellato E, Vacca A. Miller's seminal studies on the role of thymus in immunity. Clin Exp Immunol. 2006;144:371–5. doi: 10.1111/j.1365-2249.2006.03060.x. [DOI] [PMC free article] [PubMed] [Google Scholar]
- 10.Smaniotto S, de Mello-Coelho V, Villa-Verde DM, et al. Growth hormone modulates thymocyte development in vivo through a combined action of laminin and CXC chemokine ligand 12. Endocrinology. 2005;146:3005–17. doi: 10.1210/en.2004-0709. [DOI] [PubMed] [Google Scholar]
- 11.El-Hodhod MAA, Nassar MF, Zaki MM, Moustafa A. Apoptotic changes in lymphocytes of protein energy malnutrition patients. Nutr Res. 2005;25:21–9. [Google Scholar]
- 12.King LE, Osati-Ashtiani F, Fraker PJ. Apoptosis plays a distinct role in the loss of precursor lymphocytes during zinc deficiency in mice. J Nutr. 2002;132:974–9. doi: 10.1093/jn/132.5.974. [DOI] [PubMed] [Google Scholar]
- 13.Span LF, Pennings AH, Vierwinden G, Boezeman JB, Raymakers RA, de Witte T. The dynamic process of apoptosis analyzed by flow cytometry using Annexin-V/propidium iodide and a modified in situ end labeling technique. Cytometry. 2002;47:24–31. [PubMed] [Google Scholar]
- 14.Vermes I, Haanen C, Steffens-Nakken H, Reutelingsperger C. A novel assay for apoptosis. Flow cytometric detection of phosphatidylserine expression on early apoptotic cells using fluorescein labelled Annexin V. J Immunol Methods. 1995;184:39–51. doi: 10.1016/0022-1759(95)00072-i. [DOI] [PubMed] [Google Scholar]
- 15.Gorczyca W, Gong J, Darzynkiewicz Z. Detection of DNA strand breaks in individual apoptotic cells by the in situ terminal deoxynucleotidyl transferase and nick translation assays. Cancer Res. 1993;53:1945–51. [PubMed] [Google Scholar]
- 16.Slobodianik NH, Pallaro AN, Roux ME, Rio ME. Effect of low-quality dietary protein on the thymus of growing rats. Nutrition. 1989;5:417–18. [PubMed] [Google Scholar]
- 17.Borelli P, Blatt S, Pereira J, et al. Reduction of erythroid progenitors in protein-energy malnutrition. Br J Nutr. 2007;97:307–14. doi: 10.1017/S0007114507172731. [DOI] [PubMed] [Google Scholar]
- 18.Hussar P, Tokin I, Hussar U, Filimonova G, Suuroja T. Application of Photoshop-based image analysis and TUNEL for the distribution and quantification of dexamethasone-induced apoptotic cells in rat thymus. Medicina (Kaunas) 2006;42:504–12. [PubMed] [Google Scholar]
- 19.Monk JM, Makinen K, Shrum B, Woodward B. Blood corticosterone concentration reaches critical illness levels early during acute malnutrition in the weanling mouse. Exp Biol Med (Maywood) 2006;231:264–8. doi: 10.1177/153537020623100304. [DOI] [PubMed] [Google Scholar]
- 20.Ortiz R, Cortés L, González-Márquez H, Gómez JL, González C, Cortés E. Flow cytometric analysis of spontaneous and dexamethasone-induced apoptosis in thymocytes from severely malnourished rats. Br J Nutr. 2001;86:545–8. doi: 10.1079/bjn2001446. [DOI] [PubMed] [Google Scholar]
- 21.Shin SJ. High levels of apoptosis induced by total body irradiation in mice fed a low protein–low vitamin E diet. Food Chem Toxicol. 2003;41:665–70. doi: 10.1016/s0278-6915(02)00331-9. [DOI] [PubMed] [Google Scholar]
- 22.Kurebayashi S, Ueda E, Sakaue M, et al. Retinoid-related orphan receptor gamma (RORgamma) is essential for lymphoid organogenesis and controls apoptosis during thymopoiesis. Proc Natl Acad Sci USA. 2000;97:10132–7. doi: 10.1073/pnas.97.18.10132. [DOI] [PMC free article] [PubMed] [Google Scholar]
- 23.Moreno J, Varas A, Vicente A, Zapata AG. Role of prolactin in the recovered T-cell development of early partially decapitated chicken embryo. Dev Immunol. 1998;5:183–95. doi: 10.1155/1998/93086. [DOI] [PMC free article] [PubMed] [Google Scholar]
- 24.Woodward B, Hillyer L, Hunt K. T cells with a quiescent phenotype (CD45RA+) are overabundant in the blood and involuted lymphoid tissues in wasting protein and energy deficiencies. Immunology. 1999;96:246–53. doi: 10.1046/J.1365-2567.1999.00694.x. [DOI] [PMC free article] [PubMed] [Google Scholar]
- 25.Nájera O, González C, Toledo G, et al. CD45RA and CD45RO isoforms in infected malnourished and infected well-nourished children. Clin Exp Immunol. 2001;126:461–5. doi: 10.1046/j.1365-2249.2001.01694.x. [DOI] [PMC free article] [PubMed] [Google Scholar]
- 26.Ahmed SA, Sriranganathan N. Differential effects of dexamethasone on the thymus and spleen: alterations in programmed cell death, lymphocyte subsets and activation of T cells. Immunopharmacology. 1994;28:55–66. doi: 10.1016/0162-3109(94)90039-6. [DOI] [PubMed] [Google Scholar]
- 27.Dolzhanskiy A, Basch RS. Flow cytometric determination of apoptosis in heterogeneous cell populations. J Immunol Methods. 1995;180:131–40. doi: 10.1016/0022-1759(94)00309-k. [DOI] [PubMed] [Google Scholar]
- 28.King LE, Frentzel JW, Mann JJ, Fraker PJ. Chronic zinc deficiency in mice disrupted T cell lymphopoiesis and erythropoiesis while B cell lymphopoiesis and myelopoiesis were maintained. J Am Coll Nutr. 2005;24:494–502. doi: 10.1080/07315724.2005.10719495. [DOI] [PubMed] [Google Scholar]
- 29.Miyazaki T, Hirokami Y, Matsuhashi N, Takatsuka H, Naito M. Increased susceptibility of thymocytes to apoptosis in mice lacking AIM, a novel murine macrophage-derived soluble factor belonging to the scavenger receptor cysteine-rich domain superfamily. J Exp Med. 1999;189:413–22. doi: 10.1084/jem.189.2.413. [DOI] [PMC free article] [PubMed] [Google Scholar]
- 30.Oldenburg NB, Evans-Storms RB, Cidlowski JA. In vivo resistance to glucocorticoid-induced apoptosis in rat thymocytes with normal steroid receptor function in vitro. Endocrinology. 1997;138:810–18. doi: 10.1210/endo.138.2.4912. [DOI] [PubMed] [Google Scholar]
- 31.Fraker PJ, King LE. Reprogramming of the immune system during zinc deficiency. Annu Rev Nutr. 2004;24:277–98. doi: 10.1146/annurev.nutr.24.012003.132454. [DOI] [PubMed] [Google Scholar]
- 32.Fujita Y, Murakami M, Ogawa Y, et al. Leptin inhibits stress-induced apoptosis of T lymphocytes. Clin Exp Immunol. 2002;128:21–6. doi: 10.1046/j.1365-2249.2002.01797.x. [DOI] [PMC free article] [PubMed] [Google Scholar]
- 33.Rodríguez L, Graniel J, Ortiz R. Effect of leptin on activation and cytokine synthesis in peripheral blood lymphocytes of malnourished infected children. Clin Exp Immunol. 2007;148:478–85. doi: 10.1111/j.1365-2249.2007.03361.x. [DOI] [PMC free article] [PubMed] [Google Scholar]
- 34.Topouchian A, Kapel N, Larue-Achagiotis C, et al. Cryptosporidium infection impairs growth and muscular protein synthesis in suckling rats. Parasitol Res. 2005;96:326–30. doi: 10.1007/s00436-005-1369-8. [DOI] [PubMed] [Google Scholar]
- 35.Hillyer L, Whitley C, Olver A, Webster M, Steevels T, Woodward B. Adoptively transferred dendritic cells restore primary cell-mediated inflammatory competence to acutely malnourished weanling mice. Am J Pathol. 2008;172:378–85. doi: 10.2353/ajpath.2008.070456. [DOI] [PMC free article] [PubMed] [Google Scholar]