Abstract
The Anisotropic Network Model (ANM) is used to study motions of the 30S small ribosomal subunit. The effect of the absence of certain subunits on the motions of the remaining partial structures was investigated by removing one protein, pairs of proteins and selected sets of proteins at a time. Our results show that the removal of some proteins doesn’t change the large-scale dynamics of the partial structures, but the removal of certain subunits does cause significant changes in motion of the remaining structure, and these changes can be reverted by the removal of other subunits, which indicates interdependence between motions of various parts of the 30S ribosomal structure. We further found that the subunits showing such interdependence have strong positive correlation of their motions, which indicates that these subunits function as a unit block in the 30S small ribosomal subunit. Dynamically interdependent subunit pairs identified in this paper are consistent with previous experimental observations that suggested dimerization of those subunits.
Keywords: Anisotropic network model, protein removal experiment, ribosome, 30S subunit, dynamic interdependence
Introduction
Many biological functions of proteins are related to their large-scale domain motions. By treating a protein as a 3D collection of masses connected by springs and using a theoretical framework developed earlier for rubberlike polymer networks 1,2, Elastic Network Models of proteins have been proposed. The Gaussian Network Model (GNM) developed by Bahar et al. 3 assumes that fluctuations of residues (or atoms) in proteins around their mean equilibrium positions are spherically symmetric, while the Anisotropic Network Model (ANM) proposed by Atilgan et al. 4 takes into account the directionality of fluctuations and their anisotropy, measured by semi-axes of ellipsoids representing the fluctuations. Theoretical predictions of the extent of fluctuations of atoms and residues in biological structures agree surprisingly well with experimental temperature factors (B-factors) deposited in the Protein Data Base (PDB). Elastic Network Models have been used extensively to study large-scale functional motions of proteins and protein-protein complexes, as well as for oligonucleotides and protein-DNA/RNA complexes. Bahar and Jernigan applied GNM to calculate atomic fluctuations for tRNA in the isolated form and the bound to Gln synthetase form, and their results reproduce closely experimental B-factors 5. Another evidence of successfulness of the elastic network approach to protein-nucleic acid systems comes from the application of the GNM to HIV-1 reverse transcriptase (RT). The RTs in different forms (bound to DNA, or to inhibitors) were analyzed to infer the mechanism of function, and the predicted results were highly consistent with available experimental data 6–8. Ramaswamy et al. studied motions of the nucleosome core particles using the elastic network model and revealed higher mobility of nucleosomes with variant histones, in accord with existing experimental observations 9. Yang et al. studied recently 64 oligonucleotides and oligonucleotide-protein complexes, and represented each nucleotide by three GNM nodes with uniform interaction cut-offs defining contacts for all components of the complexes, and achieved a very good agreement between the values of computed fluctuations and the experimental B-factors 10. Tama et al. performed elastic network model computations for the ribosome, and found the ratchet-like motion rearrangements of the 70S ribosome and a hinge-like motion in the 30S ribosomal subunit, and such dynamical behavior of the ribosome was indeed observed in cryo-electron microscopy experiments 11. Wang et al. applied GNM and ANM to study global motions in the ribosome, and independently observed a similar ratchet-like motion in the 70S ribosome in agreement with experimental data 12. All these results clearly show enormous usefulness of GNM and ANM methods to study dynamics and function of DNA, RNA and protein-DNA/RNA complexes, especially for large structures where traditional molecular dynamics simulations, requiring enormous computational resources, usually fail.
Ribosomes are large protein/RNA complexes that perform protein biosynthesis in all forms of life. Bacteria ribosomes are composed of a small (30S) and a large (50S subunit) that associate to form the intact 70S ribosome. The 30S subunit of the ribosome consists of 16S rRNA and 20 proteins. In 1970, it was found that 30S subunit can reassemble from the 16S rRNA and a mixture of the 30S ribosomal proteins, and such a spontaneous reassembly process can produce a biologically active 30S structure13. Later it was shown that purified individual 30S subunit proteins and the naked 16S rRNA could also been reconstituted into active 30S particles in vitro. This shows that all the necessary information required for in vitro reassembly is contained within these molecular components. The 30S ribosomal subunit has been frequently used as a model system for studying ribosomal assembly. The reason for choosing the 30S ribosomal subunit as a model is due to its simplicity, and possibility of experimental control and manipulation of the assembly process in vitro 14–16. By using sequential and combinatorial addition of proteins, Normura and coworkers13 determined the assembly map of the 30S subunit. They divided the proteins into three categories, the primary binding proteins (S4, S7, S8, S16, S17 and S20) which bind 16S rRNA directly independent of other proteins, the secondary binding proteins (S5, S6, S11, S12, S13, S6, S18 and S19) which require at least one of the primary proteins to be bound to the 16S rRNA prior to binding, and the tertiary binding proteins (S2, S3, S10, S14 and S21) which require at least one protein from both of the previous sets be bound to the developing RNP core. Besides this assembly map determined by Normura and coworkers, another map based on the kinetics of assembly was obtained by Powers et al. 17. In this kinetic map, proteins are divided into early, mid, mid-late and late binding groups. The apparent agreement between the two maps is that the tertiary binding proteins are consistently found to be late binding proteins. These earlier experimental studies were performed before the structure of the 30S subunit was known. The availability of the X-ray crystal structure of 30S subunit from Thermus thermophilus18 now allows the researchers to examine the assembly process in light of the final end product. It is believed that the folding of 16S rRNA showed a 5′ to 3′ polarity (i.e., the 5′ domains fold before the 3′ domains). The early stage of the assembly involves the folding of individual domains of 16S rRNA, perhaps initiated by one of the primary binding proteins, and the late stage of the assembly involves the alignment of domain orientations, assisted by the binding of tertiary or late binding proteins19. Despite many years of investigation, understanding of the 30S assembly still remains elusive.
The availability of X-ray crystal structure of 30S subunit allows for computational investigation of the 30S assembly. Stagg et al. used coarse-grained Monte Carlo simulations to study the fluctuation changes upon the binding of proteins in the 3′ domain assembly for 30S ribosomal subunit from Thermus thermophilus (1FJG) and examined the contributions of individual proteins to the formation of binding sites for the sequential proteins in the S7 pathway20. Hamacher et al. studied the dependencies of protein binding to 16S rRNA for the Thermus thermophilus 30S small ribosomal subunit by removing one protein or a pair of proteins at a time from the intact 30S small subunit using self-consistent pair contact probability approximation method and produced a similar dependency map of proteins as that in Escherichia coli established earlier by the experimental methods 21. The challenge in applying computational tools to study the assembly process is how to account for chemical/structural specificity of such large macromolecular complexes, knowing that chemical specificity matters. Both Stagg et al. and Hamacher et al. did not include or at most accounted very minimally for chemical specificity (Cα atoms versus P atoms). Yet both studies have been able to reveal useful information of the assembly pathway and even in some cases obtain agreement with the experimental results. The success of these approaches could be ascribed, we believe, to the fact that individual molecular contacts in biological assembly all have interaction strength on the order of thermal motions. The profound example supporting this statement can be found in the free energy change per base pair formation during the duplex formation22. Therefore, by accounting for the contact pairs observed in the final assembled particle, in principle one may trace useful information about the assembly pathway.
Elastic network models (ANM or GNM) are based on a similar principle as those used by Stagg et al. and Hamacher et al., namely, that contacts within protein structures or their macromolecular assemblies determine their dynamics. However, Stagg et al. performed Monte Carlo simulations of the partial structures distorted far away from the equilibrium. Similarly, Hamacher et al. study also allowed examining partial structures far from the equilibrium. In this regard, simple elastic network model calculations will not reveal as much information as the two previous studies. Nevertheless, it is worth to apply simple elastic network model calculations to partial structures of the 30S assembly to examine the extent of information embedded in the partial structures that may reveal mechanisms of the assembly pathway.
Our ANM calculations were based on coarse-grained models of partial ribosome structures. A typical coarse-graining level is to use Cα (for proteins) and P atoms (for DNA or RNA) as the nodes of the network and neglect side chains and other atoms. Doruker et al. 23 have shown that for large biological structures the coarse-graining level can be significantly reduced by using only a small fraction of nodes along the backbone (n/10, n/20 or n/40 nodes where n is total number of residues) almost without any loss (over 95% correlation) of information on the large-scale dynamics. Our earlier results from comparison of different coarse-graining level models have shown that a removal of a part of the structure doesn’t cause significant changes in large-scale motions if the global shape of the molecule is maintained. In the present paper we extend this study to the small 30S ribosomal subunit and examine whether the removal of some protein subunits in the 30S changes large-scale functional motions of the remaining part of the 30S structure.
Materials and Methods
Structure used in this study
A 3.05 Å resolution crystal structure from T. thermophilus is used in this study. Its PDB entry code is 1J5E. This structure is a native form of the 30S subunit, and doesn’t bind with any ligand. This large biomolecule consists of 21 chains, each chain being a separate subunit. Among these subunits, chain A is the nucleic acid 16S rRNA, and all other chains are proteins. The organizations and interactions of these subunits and binding rate of the protein subunits to 16S rRNA can be found in Figure 2(b) and 2(c) in reference24.
Overlap matrix calculation
The similarities between two sets of vectors are measured by the overlap matrix. Each element in the overlap matrix is calculated by the following equation:
| (1) |
Here x and y are two vectors, |x| and |y| their lengths, xi and yi denote their i-th components, and θ is the angle between vectors x and y. If two vectors are exactly collinear, then their absolute overlap is 1. If they are orthogonal to each other, then the overlap is 0.
Correlation of substructure motions in the complete 30S subunit
In order to understand the relative motions of each structural subunits in 30S subunit, the orientation correlation between the center of mass of the displacement of the structure subunits are examined by using the following equation:
| (2) |
Here I and J denote indices of the subunits (16S rRNA, S2, S3, … S20, THX), k denotes the mode, is the center of the mass displacement for the I-th subunit in the k-th mode, which it is computed by summing up displacement vectors of all nodes for the I-th subunit in the k-th mode.
Calculation of the deformation energy
The deformation energy of each residue is calculated by using Wang et al. method12. This method is described by equation 3
| (3) |
Here nci is the number of nodes connected to the i-th node (number of contacts based on the assumed value of the cutoff distance Rc) and N is the number of nodes; λ(k) is the eigenvalue of the k-th normal mode, which is used as a weighting factor. is the average value of the distance between residues i and j, and ΔRj(k) is displacement vector of the j-th residue in the k-th mode; while Di(k) indicates the deformation energy for i-th residue in the k-th mode.
Protein removal method
As we have already mentioned, the 30S ribosomal structure used in this study contains 21 independent subunits. Among these subunits, chain A is the 16S rRNA, and is always included in all partial structures generated in our protein removal experiments. The numbers of all possible partial structures that are obtained by the removal of m out of 20 subunits can be computed from the formula
| (4) |
and are listed in the Table 7. If we try to remove all different combinations of proteins, the numbers of possible cases are too large, to be computationally treatable. Therefore we focus only on the simplest cases of removing all protein subunits, one protein, pairs of proteins and the selected sets of proteins at a time. After the partial structures are obtained, the following procedures are performed:
Table 7.
The number of partial structures in the protein removal experiments
| The number of proteins removed | The number of partial structures |
|---|---|
| 1 | 20 |
| 2 | 190 |
| 3 | 1140 |
| 4 | 4845 |
| 5 | 15504 |
| 6 | 38760 |
| 7 | 77520 |
| 8 | 125970 |
| 9 | 167960 |
| 10 | 184756 |
| 11 | 167960 |
| 12 | 125970 |
| 13 | 77520 |
| 14 | 38760 |
| 15 | 15504 |
| 16 | 4845 |
| 17 | 1140 |
| 18 | 190 |
| 19 | 20 |
| 20 | 1 |
We use ANM to calculate the mean-square fluctuations for the partial structure.
We use ANM to calculate the mean-square fluctuations for the complete structure.
We compare the difference in the mean-square fluctuation profiles between the partial structure and the corresponding part in the whole structure by calculating the root-mean-square error (RMSE) between them, which is shown in the following equation:
| (5) |
Here MSFPi is the mean-square fluctuation for residue i of the partial structure. MSFCi is the mean-square fluctuation for residue i of the the corresponding part in the whole structure. N is the number of residue in the partial structure.
To compare the deformation energy difference between the partial structures and the corresponding parts in the complete structure, the same procedures are used.
Computation Cost
In the ANM calculations, we used the positions of the P and the O4* atoms as nodes representing each nucleotide and the Cα to represent each residue. The spring constant is set to 1. The same model was used in our previous studies12 and our attempts to use different node representations or different values of the spring constant didn’t significantly affect the computed modes. For the complete 30S ribosomal structure, there are total 5422 nodes. Using this coarse-grained model, a 16266×16266 Hessian matrix is constructed. The full spectral decomposition of such large matrices is computationally very expensive. Since we are only interested the slowest modes, so we take the first 100 eigenvalue-eigenvector pairs into our consideration only. In order to calculate the first 100 eigenvalue-eigenvector pairs, we can use the Matlab function (eigs), but it takes about 2 hours to complete the computations. Therefore we have used BLZPACK to perform the spectral decomposition. BLZPACK stands for the Block LancZos PACKage and is a standard Fortran 77 implementation of the block Lanczos algorithm for the solution of the eigenvalue problem25. It takes 1 min for a complete computation on linux machine with 2.8GHz CPU.
Results
The influence of removing all protein subunits on the computed motions of 16S rRNA
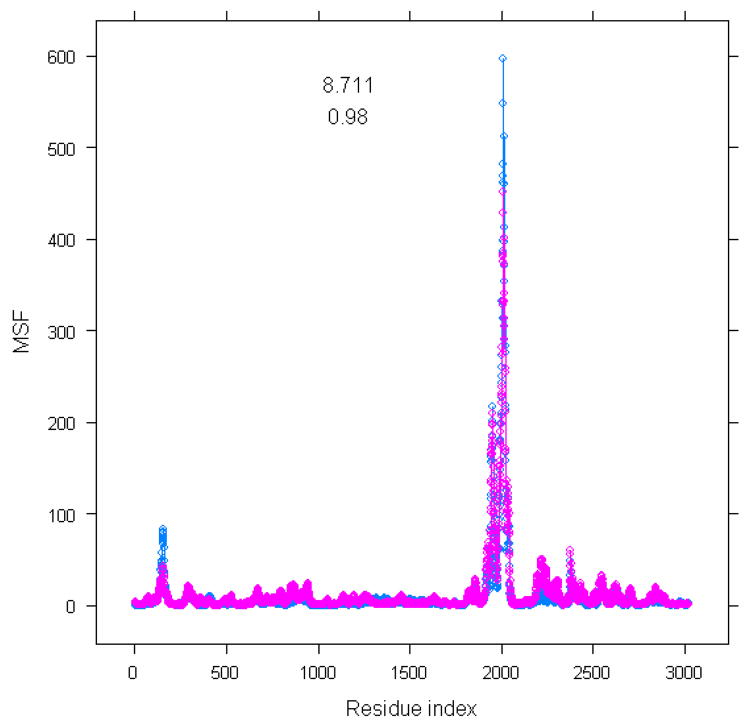
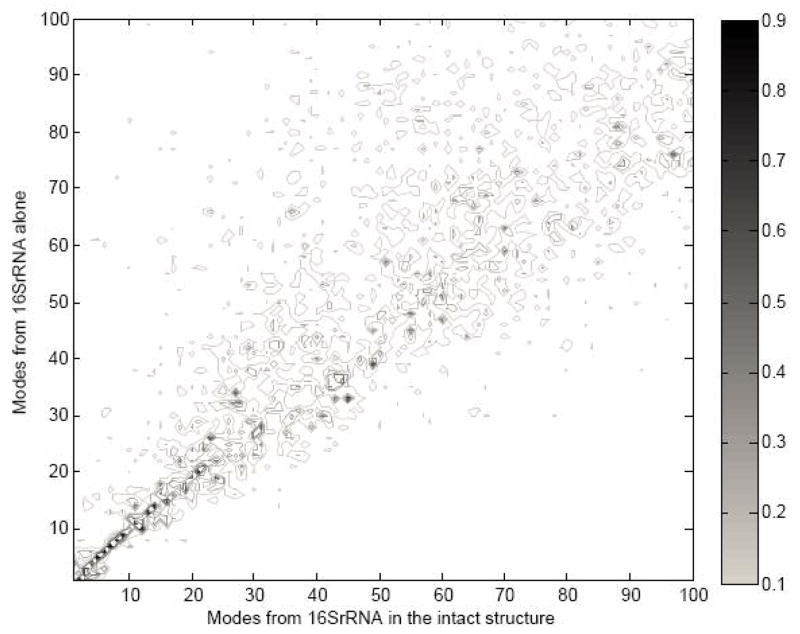
Wang et al. pointed out that the shape of the 30S subunit is determined mainly by the 16S rRNA 12, The dominant role of the molecular shape on the large-scale functional motions computed with the elastic network models was suggested by Ma 26,27. In this section, we discuss the importance of the shape of the 16S rRNA on functional motions of the 30S subunit of the ribosome. In order to estimate this effect, we removed all protein subunits from the 30S structure, and compared the mean-square fluctuations of the 16S rRNA subunit in the complete 30S structure with the 16S rRNA alone. Figure 1 shows this comparison in the slowest mode: we computed mean-square fluctuations profiles with corresponding root-mean-square errors and the correlation coefficient between them. The root-mean-square error and the correlation coefficient between two types of the mean-square fluctuations are 8.711 and 0.98, respectively, which indicates that the computed large-scale motions for 16S rRNA subunit using the complete 30S structure are very close to that based on the 16S rRNA structure alone. Furthermore we have checked for possible differences in the directionality of the normal modes of 16S rRNA between the complete 30S structure and the structure of a single 16S rRNA. The overlap matrix between the two sets of normal modes was calculated and is shown in Figure 2. From Figure 2, we can see that the first several slowest modes are highly overlapped, which indicates that the motion of the 16S rRNA subunit is mainly determined by the structure of 16S rRNA alone, and that intermolecular interactions between the 16S rRNA subunit and protein subunits have little effect on the dynamics of 16S rRNA in the 30S ribosomal structure.
Figure 1.
Comparison in the mean-square fluctuations between 16S rRNA part in the complete structure and using single 16S rRNA molecule only. X-axis is residue index. Y-axis is mean-square fluctuations for 16S rRNA alone (labeled by pink color) and 16S rRNA subunit in the whole structure (labeled by blue color)
Figure 2.
Overlap between modes unbinding 16S rRNA (Y-axis) and modes from binding 16S rRNA (X-aixs). The black color spectrum stands for the higher overlap value.
In addition, we were interested in the role of different protein subunits in the global dynamics of the 30S subunit. To answer this question, we performed single protein subunit removal experiments described in the next section.
Influence of the removal of single proteins from the 30S complex
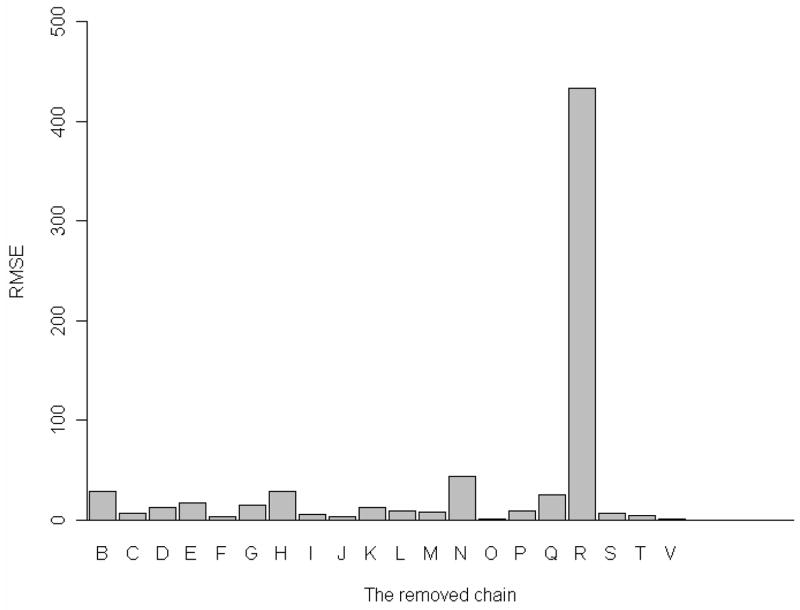
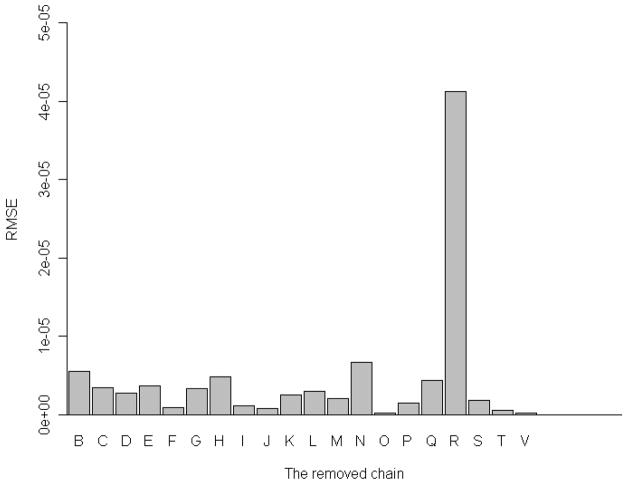
We have removed each one of the 20 constituent proteins at a time from the whole 30S complex, and then computed the mean-square fluctuations of the remaining part of the 30S structure, and the corresponding root-mean-square errors (RMSE). Figure 3 shows the root-mean-square error due to the removal of each of protein subunits. From Figure 3, it is clear that the removal of S18 will have the largest impact on the difference between mean-square fluctuations in the complete 30S structure and the incomplete structure with the removed chain. Removal of subunits S2, S8, S14, and S17 will also cause some noticeable changes in the global dynamics. The detailed values for these changes are listed in Table 1. In addition to the computations of changes in the mean-square fluctuations due to a protein chain removal we have also calculated corresponding changes in the deformation energy. (See the Methods section for computational details) Figure 4 shows these changes in the deformation energy. Figure 4 shows that the changes in the deformation energy are the largest for removing subunits S2, S8, S14, S17, and S18 which agrees with the results of the corresponding changes in the mean-square fluctuations. Table 2 lists all these changes in the deformation energy for removal of each of 20 proteins from the 30S structure. From Table 2, we see that the change caused by removing subunit S18 is the largest one, which is consistent with the results in Table 1 for the difference in the mean-square fluctuations.
Figure 3.
One protein removal experiment. X-axis: the removed protein subunit, Y-axis: RMSE for mean-square fluctuations profile.
Table 1.
Root mean square error for the mean square fluctuations between the partial structure and the corresponding parts in the whole complex structure in the slowest mode.
| Removed chain | Corresponding subunit | RMSE for MSF |
|---|---|---|
| B | S2 | 28.63* |
| C | S3 | 6.41 |
| D | S4 | 12.90 |
| E | S5 | 17.18 |
| F | S6 | 2.88 |
| G | S7 | 14.83 |
| H | S8 | 28.56* |
| I | S9 | 5.82 |
| J | S10 | 2.93 |
| K | S11 | 12.51 |
| L | S12 | 9.01 |
| M | S13 | 7.87 |
| N | S14 | 43.61* |
| O | S15 | 0.60 |
| P | S16 | 8.43 |
| Q | S17 | 25.30* |
| R | S18 | 433.60* |
| S | S19 | 6.91 |
| T | S20 | 3.79 |
| V | THX | 0.89 |
Figure 4.
One protein removal experiment. X-axis: the removed protein subunit, Y-axis: RMSE for the deformation energy profile.
Table 2.
Root mean square error for deformation energies between the partial structure and the corresponding parts in the whole complex structure in the slowest mode.
| Removed chain | Corresponding subunit | RMSE for deformation energy |
|---|---|---|
| B | S2 | 5.48e-06* |
| C | S3 | 3.46e-06 |
| D | S4 | 2.78e-06 |
| E | S5 | 3.65e-06 |
| F | S6 | 8.36e-07 |
| G | S7 | 3.26e-06 |
| H | S8 | 4.82e-06* |
| I | S9 | 1.180e-06 |
| J | S10 | 7.85e-07 |
| K | S11 | 2.50e-06 |
| L | S12 | 3.00e-06 |
| M | S13 | 2.07e-06 |
| N | S14 | 6.66e-06 |
| O | S15 | 1.82e-07 |
| P | S16 | 1.46e-06 |
| Q | S17 | 4.41e-06* |
| R | S18 | 4.13e-05* |
| S | S19 | 1.79e-06 |
| T | S20 | 5.70e-07 |
| V | THX | 2.36e-07 |
We generated a movie showing motions corresponding to the slowest mode of partial structure after removing S18. From this movie, we have clearly observed that the removal of the subunit S18 induces large amplitude motions of the terminal residues in subunit S6. Therefore we have removed the two terminal residues in S6, and then repeated the single-protein removal experiment. Similarly as before, we have calculated the root-mean-square error for the mean- square fluctuations and deformation energies between the two structures. Tables 3 and 4 show these results for the slowest mode. From the results of the computed mean-square fluctuations and deformation energies, it is obvious that by removing two terminal residues in S6 we cancel the effects caused by the removal of S18. These results indicate possible interdependence between different subunits in the global dynamics manifested in the single protein removal experiments. In order to better understand this interdependence we have extended our computational protein removal experiment to pairs of proteins at a time, and the results are shown in the following section.
Table 3.
Root mean square error for mean square fluctuations between the partial structure and the corresponding parts in the structure after removing two terminal residues in the subunit S6 in the slowest mode
| Removed chain | Corresponding subunit | RMSE for MSF |
|---|---|---|
| B | S2 | 28.65* |
| C | S3 | 6.44 |
| D | S4 | 12.87 |
| E | S5 | 17.26 |
| F | S6 | 2.86 |
| G | S7 | 14.89 |
| H | S8 | 28.59* |
| I | S9 | 5.77 |
| J | S10 | 2.76 |
| K | S11 | 12.54 |
| L | S12 | 9.05 |
| M | S13 | 7.78 |
| N | S14 | 43.46* |
| O | S15 | 0.63 |
| P | S16 | 8.44 |
| Q | S17 | 25.39* |
| R | S18 | 2.97** |
| S | S19 | 6.77 |
| T | S20 | 3.80 |
| V | THX | 0.74 |
Table 4.
Root mean square error for deformation energies between the partial structure and the corresponding parts in the structure after removing two terminal residues in the subunit S6 in the slowest mode.
| Removed chain | Corresponding subunit | RMSE for deformation energy |
|---|---|---|
| B | S2 | 5.48e-6* |
| C | S3 | 3.46e-6 |
| D | S4 | 2.78e-6 |
| E | S5 | 3.66e-6 |
| F | S6 | 8.28e-7 |
| G | S7 | 3.27e-6 |
| H | S8 | 4.83e-6* |
| I | S9 | 1.18e-6 |
| J | S10 | 7.86e-7 |
| K | S11 | 2.50e-6 |
| L | S12 | 3.00e-6 |
| M | S13 | 2.06e-6 |
| N | S14 | 6.66e-6* |
| O | S15 | 1.85e-7 |
| P | S16 | 1.47e-6 |
| Q | S17 | 4.43e-6* |
| R | S18 | 4.25e-7** |
| S | S19 | 1.79e-6 |
| T | S20 | 5.73e-7 |
| V | THX | 2.360e-7 |
Influence of the removal of pairs of proteins from the 30S complex
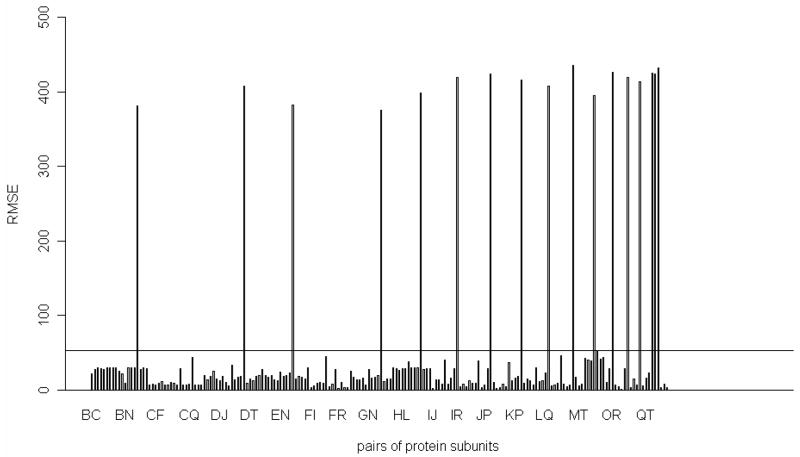
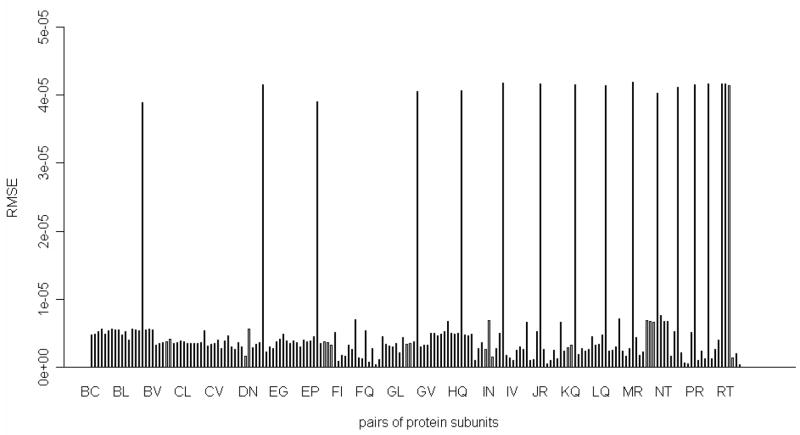
We have performed the removal of a pair of proteins at a time, and then computed the root-mean- square error of the mean-square fluctuations of residues in the partial remaining structure of the 30S ribosomal subunit and the complete 30S structure in the slowest mode. These results are shown in Figure 5. Figure 5 shows that out of the total of 190 investigated pairs there are 17 pairs of proteins that have significantly larger root-mean-square error than the rest. If we inspect all these 17 pairs of proteins, we see that subunit S18 is involved in all these pairs. We were also interested in the two remaining pairs of proteins containing the S18 subunit. In Table 5, we have listed all pairs of proteins that include the S18, and the corresponding RMSE in the slowest mode. From Table 5, it is clear that the root-mean-square error of the mean-square fluctuations of residues for the partial 30S structure and for the intact 30S structure are significantly reduced, respectively to all other cases, if we remove subunits S3 and S18 together (RMSE = 43.8), or remove together subunits S6 and S18 (RMSE = 2.15). We have also computed the root-mean-square error in the deformation energies for the remaining 30S structure and the intact 30S structure in the slowest mode. These results for all pairs or proteins containing the S18 subunit are plotted in Figure 6 and listed in Table 6. From the computations of the deformation energy in Table 6, we see that the removal of the S6 and the S18 subunits together will cause almost no changes in the deformation energy, which agrees with the computations of the difference of the mean-square fluctuations for the same pair of proteins in Table 5. In a single-protein removal experiments, removing of the subunit S18 significantly changes the large-scale dynamics of the remaining 30S structure relative to the intact 30S structure. We have also observed that the two terminal residues of the subunit S6 exhibit large fluctuations after the removal of the subunit S18. However, if we remove the subunit S18 and these two terminal residues of the subunit S6 together, the root-mean-square error of fluctuations of residues in the partial 30S structure and in the intact 30S structure lowers to 2.97 (see Table 3), which is similar to the RMSE value of 2.15 when we remove the whole subunits S6 and S18 together (see in Table 5). These results indicate that the subunit S18 serves a role of a spatial constraint that prevents the two terminal residues of the subunit S6 to have large fluctuations. After the subunit S18 is removed, this constraint is missing, and we observe large fluctuations of the two terminal residues of the subunit S6.
Figure 5.
The two proteins removal experiment. X-axis: the removed protein pairs (190 pairs), Y-axis: root-mean-square error (RMSE) for the mean-square fluctuations profile. The horizontal line in Figure indicates the position that RMSE is 53.1786.
Table 5.
Root-mean-square error for mean-square fluctuations between the partial structure and the corresponding parts in the complete structure after removing S18 involved pairs of proteins in the slowest mode
| Removed chains | Corresponding subunits | RMSE for MSF |
|---|---|---|
| BR | S2-S18 | 381.34 |
| CR | S3- S18 | 43.77** |
| DR | S4- S18 | 407.31 |
| ER | S5- S18 | 382.32 |
| FR | S6- S18 | 2.15** |
| GR | S7-S18 | 374.90 |
| HR | S8- S18 | 399.16 |
| IR | S9- S18 | 418.98 |
| JR | S10- S18 | 423.63 |
| KR | S11- S18 | 416.50 |
| LR | S12- S18 | 407.46 |
| MR | S13- S18 | 435.55 |
| NR | S14- S18 | 394.65 |
| OR | S15- S18 | 426.25 |
| PR | S16- S18 | 419.73 |
| QR | S17- S18 | 413.63 |
| RS | S18- S19 | 425.61 |
| RT | S18- S20 | 423.88 |
| RV | S18- THX | 431.56 |
Figure 6.
The two proteins removal experiment. X-axis: the removed protein pairs (190 pairs), Y-axis: root-mean-square error (RMSE) for deformation energy profile.
Table 6.
Root-mean-square error for deformation energies between the partial structure and the corresponding parts in the complete structure after removing S18 involved pairs of proteins in the slowest mode.
| Removed chains | Corresponding subunits | RMSE for Deformation Energy |
|---|---|---|
| BR | S2-S18 | 3.89e-05 |
| CR | S3- S18 | 5.31e-06** |
| DR | S4- S18 | 4.16e-05 |
| ER | S5- S18 | 3.90e-05 |
| FR | S6- S18 | 7.70e-07** |
| GR | S7-S18 | 4.06e-05 |
| HR | S8- S18 | 4.07e-05 |
| IR | S9- S18 | 4.18e-05 |
| JR | S10- S18 | 4.17e-05 |
| KR | S11- S18 | 4.15e-05 |
| LR | S12- S18 | 4.15e-05 |
| MR | S13- S18 | 4.19e-05 |
| NR | S14- S18 | 4.03e-05 |
| OR | S15- S18 | 4.12e-05 |
| PR | S16- S18 | 4.16e-05 |
| QR | S17- S18 | 4.16e-05 |
| RS | S18- S19 | 4.17e-05 |
| RT | S18- S20 | 4.17e-05 |
| RV | S18- THX | 4.14e-05 |
Remove the sets of protein subunits based on their binding order
Earlier work by Nomura et al. showed that 20 protein subunits bind with 16S rRNA in specific order. Using this order, these proteins are classified into the primary, secondary and tertiary binding proteins. The primary binding proteins are chains S17, S4, S20, S8, S15 and S7. The secondary binding proteins include S12, S16, S18, S6, S9, S19, S13, S5 and S11. The tertiary binding proteins contain chains S14, S10, THX, S3 and S2. We use Bp, Bs, Bt to indicate the different sets of protein subunits:
Bp={S4 S7 S8 S15 S17 S20}
Bs={S5 S6 S9 S11 S12 S13 S16 S18 S19}
Bt={S2 S3 S10 S14 THX}
The combinations of Bp, Bs and Bt are listed below:
BpBs={S4 S5 S6 S7 S8 S9 S11 S12 S13 S15 S16 S17 S18 S19 S20}
BpBt={S2 S3 S4 S7 S8 S10 S14 S15 S17 S20 THX}
BsBt={S2 S3 S5 S6 S9 S10 S11 S12 S13 S14 S16 S18 S19 THX}
BpBsBt=All protein subunits
Here we attempt to find how the removal of these sets of protein subunits affects motions of partial 30S structures. In order to answer this question, we perform the protein removal simulations by removing the groups of Bp, Bs, Bt, BpBs, BpBt and BsBt subunits separately, and calculating the mean deviations per residue of the mean-square fluctuations and deformation energies between the partial structure after the removal and the corresponding part in the intact structure. For the slowest mode, the mean deviations per residue are: 26.24, 12.65, 12.44, 33.40, 6.53 and 11.10 for removal of Bp, Bs, Bt, BpBs, BpBt and BsBt, respectively. It is clear that removing the primary and secondary binding proteins together causes the largest mean deviation, while removing both the primary and the tertiary binding proteins together leads to the smallest mean deviation.
The similar change patterns are also reflected from the mean deviation per residue for the deformation energy. The mean deviations per residue are 4.79e-06, 3.37e-06, 4.32e-06, 5.91e-06, 3.97e-06 and 4.60e-06 for removal of Bp, Bs, Bt, BpBs, BpBt and BsBt, respectively, which shows that removing the primary and secondary binding proteins together causes the largest mean deviation in the computed deformation energy.
Effects of the removal of protein subunits on motions of partial structures depend on contacts between the protein subunits and 16SrRNA subunit in the 30S structure
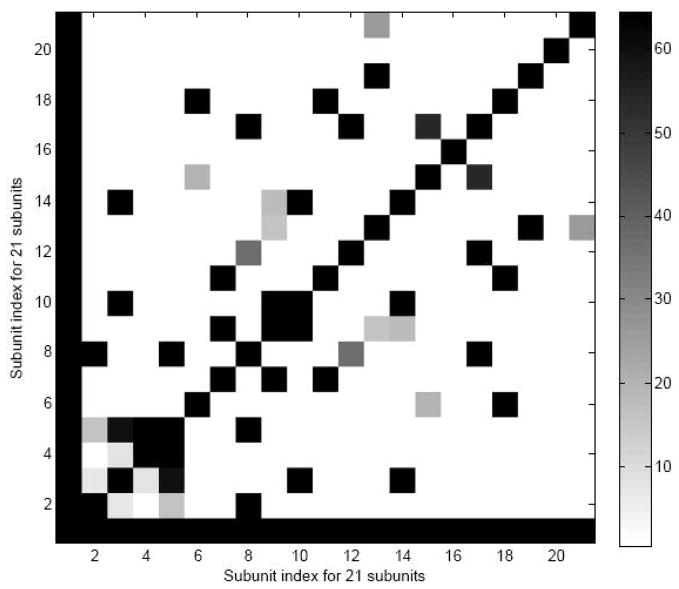
In the protein removal experiments, we observe that the removal of some proteins, pairs of proteins and subsets of proteins causes larger changes in the mean-square fluctuations for partial structures, while the removal of other proteins have smaller effects on the corresponding mean square fluctuations. We are especially interested whether the effects from removing the different protein subunits are related to the contacts between the protein subunits and 16S rRNA subunit. To answer this question, we calculate the contact numbers between subunits and construct a contact map (see Figure 10). We assume that two nodes (one from 16S rRNA subunit and another from the protein subunit) are being in contact if the distance between them is less than or equal to 15Å. From Figure 10, we calculate the average contact number for the primary, secondary and tertiary binding proteins. The average contact numbers for the primary, secondary and tertiary binding proteins are calculated by dividing the total contact numbers for each category by the number of subunits in this category. The average contact numbers for these three sets of proteins are 1669, 1414 and 1088, respectively, which indicates that the earlier the proteins bind with 16S rRNA, the more contact the proteins have with the 16S rRNA. In addition, the relationship between the contact numbers and the effects of the removal of the protein subunits on the motion of the partial 30S structure are also studied. We calculate the Pearson and Spearman rank correlation between the contact number and the RMSE in Table 1, and these values between the two measures are −0.34 and 0.009, respectively, which indicates that there is no obvious linear relationship between them. However we did observe that S6 has the smallest contact number, and the removal of S6 causes the smaller effect on the motion of the partial structure (RMSE for S6 in Table 1 is 2.88 only). For the removal of pairs of proteins always including S18, the average contact number for the pairs including S6–S18 is the smallest, and the RMSE in Table 5 is 2.15, which is the smallest RMSE for all pairs including S18. In addition, we are interested whether there is a linear relationship between contact ratios and the effects of the removal of the protein subunits on the motion of the partial 30S structure. The contact ratio between protein subunit and 16SrRNA is calculated by dividing the total contact number between two subunits by the product of numbers of residues of two subunits. We calculate the Pearson and Spearman rank correlation between the contact ratios and the RMSEs in Table 1, and these values between the two measures are −0.18 and −0.31, respectively, which again indicates that there is no obvious linear relationship between contact ratios and the effects of the removal of the protein subunits on the motion of the partial 30S structure. We also note that the Pearson and Spearman rank correlation between the contact numbers and the contact ratios are 0.27 and 0.46, respectively.
Figure 10.
Contact map between subunits in 30S ribosome structure, using 15 Å as cut off distance for defining contact. X-axis and Y-axis indicate 21 subunits. The black color spectrum stands for the larger contact number.
The correlation of motions of different subunits
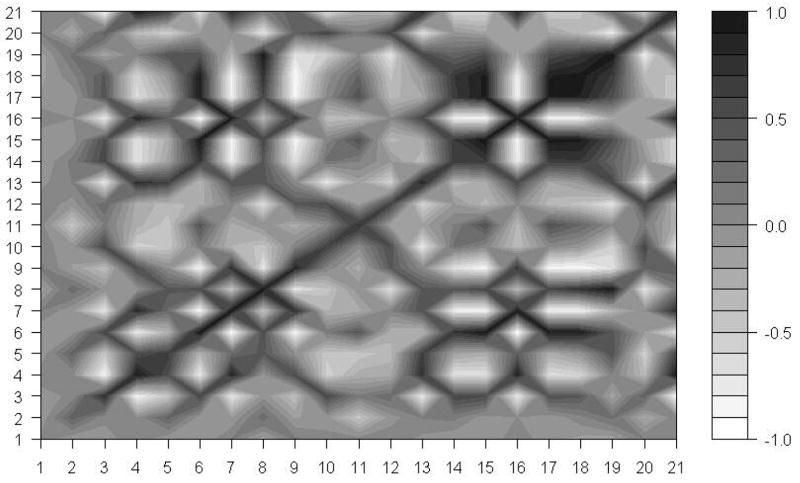
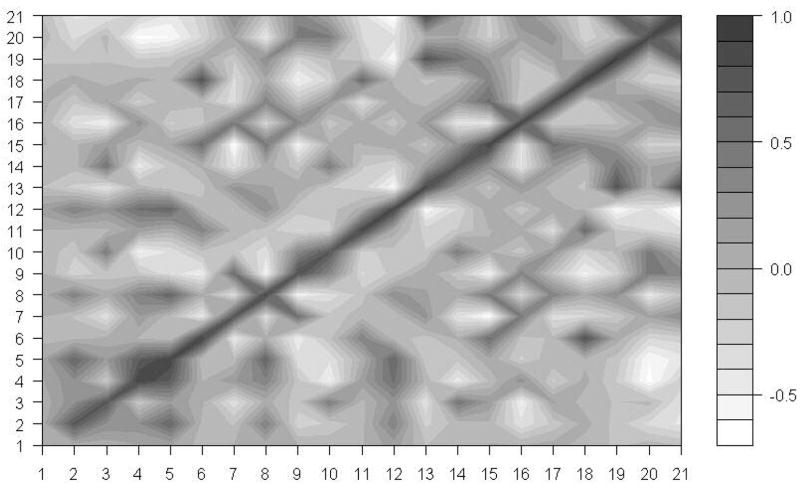
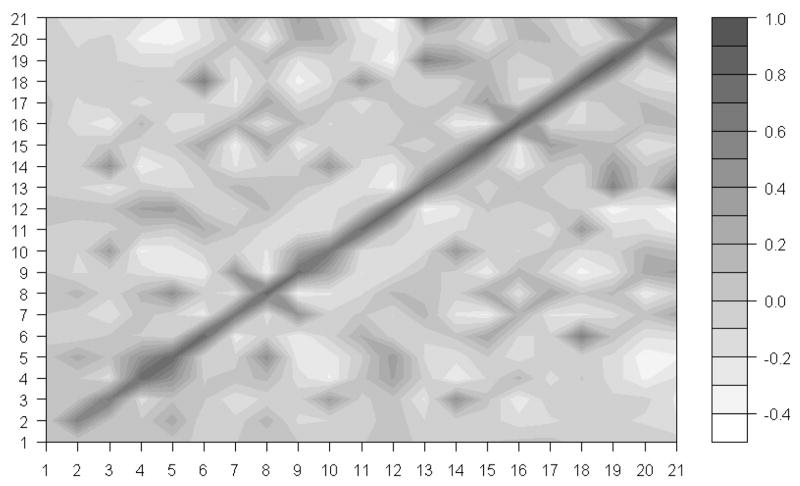
Since the ribosome is a biological machine for protein synthesis, we expect that motions of its different subunits are highly correlated to process the synthesis of proteins smoothly. Wang et al.12, studied the correlations of motions of different subunits in the whole 70S ribosome structure. However, they didn’t examine correlations of motions of various subunits in the 30S ribosomal structure. Our results of the removal of pairs of proteins at a time, suggest that the subunit S18 constrains motions of the subunit S6. We are especially interested how motions of S18 are correlated with motions of S6, and with other protein chains. We have computed correlations of motion among 21 subunits of the 30S structure. Figure 7 shows these results corresponding to the slowest mode. From Figure 7, it is obvious that there are strong positive correlations of motion between subunits S6 and S18. Furthermore, we have investigated the effect of higher modes by computing these correlations for the first 10 slowest and the first 100 slowest modes. Figures 8 and 9 show the results of our studies.
Figure 7.
The motion correlation between subunits in the 30S structure. X-axis and Y-axis indicate 21 subunits. The black color spectrum stands for the higher correlation value, and the correlations are calculated based on only the slowest mode.
Figure 8.
The motion correlation between subunits in the 30S structure. X-axis and Y-axis indicate 21 subunits. The black color spectrum stands for the higher correlation value and the correlations are calculated based the first 10 slowest mode.
Figure 9.
The motion correlation between subunits in the 30S structure. X-axis and Y-axis indicate 21 subunits. The black color spectrum stands for the higher correlation value, and the correlations are calculated based the first 100 slowest mode.
It is clear that there is a positive correlation between the motions of subunits S6 and S18 even if we take other slowest modes into the consideration. The correlation coefficients between the motions of subunits S6 and S18 in the first slowest mode, the first 10 slowest modes and the first 100 slowest modes are 0.91, 0.77 and 0.59, respectively. By combining this information on correlation coefficients with the results of the protein removal experiments, we lead to the conclusion that subunits S6 and S18 function together as a single block in the whole 30S ribosomal structure. The removal of the subunit S18 alone will significantly change the dynamics of the remaining structure; however the removal of both subunits S6 and S18 at once will eliminate the changes caused by the removal of the single chain S18.
Subunits that have more contacts have stronger correlated motions computed from ENM
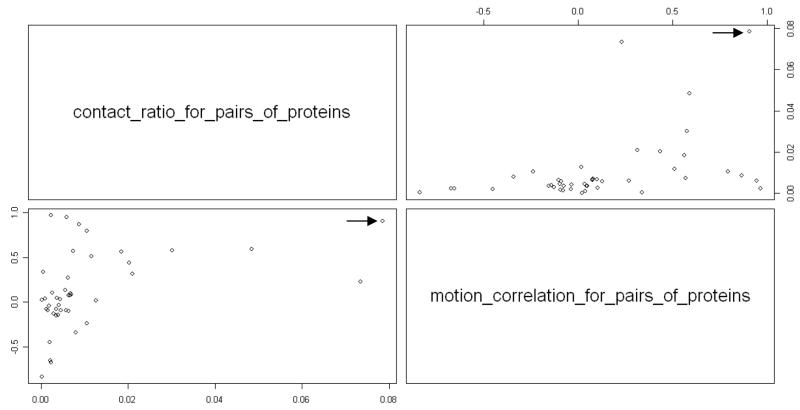
In this section, we study a relationship between contacts among subunits and the correlated motions of these subunits. We calculated the contact ratio of pairs of proteins and compared them with the correlated motions of these pairs. These results are shown in Figure11. The contact ratio for pair of proteins is calculated by dividing the total contact number between the two subunits by the product of numbers of residues of two subunits. Since there are 21 subunits, there are 210 different pairs of subunits. Among these 210 pairs, there are 44 pairs of subunits that have nonzero contact ratio. Therefore we only include these 44 pairs of subunits in Figure 11. The Pearson and Spearman correlation coefficient between the contact ratio of pairs of subunits and the motion correlation coefficient between subunits in Figure 12 are 0.42 and 0.52, respectively, which indicate the relationships between the contacts among subunits and their correlated motions. Particularly, subunit F and subunit R have the larger contact ratio, the motion correlation between them is also stronger (labeled by arrow in Figure 11).
Figure 11.
The relationship between the contact ratio for pairs of proteins and the motion correlation of pairs of proteins. Arrow indicates the pair of subunit S6 and S18.
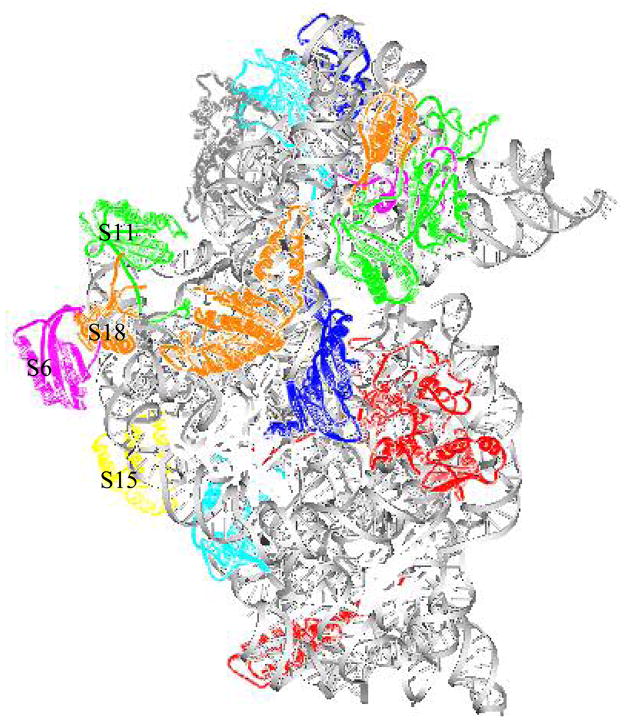
Figure 12.
Structure of the 30S ribosomal subunit (viewed using ViewerPro 4.2). Gray color indicates 16S rRNA. Protein subunits are represented by the different colors. Some proteins involved in S15 binding pathway are labeled (S6, S11, S15, S18).
Conclusions
In this study, we find that the slowest modes of 16S rRNA after removing all protein subunits are very similar to the slowest mode of 16S rRNA part in the whole 30S ribosome subunit. However, the slowest mode of partial structures obtained after removing S18 or some pairs of protein subunits containing S18 are very different from the slowest modes of the corresponding parts in the whole 30S ribosome. This should not be considered to be contradictory to what we indicated that the dynamics of the 16S rRNA alone is affected little by the interactions with the protein subunits. The partial structures obtained after removal of S18 or pairs of subunits containing chain S18 still contain other protein subunits and the slowest modes that are computed using ANM are strongly influenced by some of these remaining subunits. We have computed the extent of change of the mean-square fluctuations due to remaining chains after the removal of chain S18. Our calculations show that 99.52% of changes in the mean-square fluctuations profile is related to chain S6, and only 0.47% is due to 16S rRNA. Hamacher et al. studied the dependency map of proteins in the 30S small ribosomal subunit assembly by calculating the difference in the binding free energy performing a single protein removal and two proteins removal experiments 21. Their studies have shown that subunits S6 and S18 influence each other. Some early experimental studies indicated that chains S6 and S18 bind each other forming a dimer 14,17. Other experiments using the 30S ribosomal subunit from hyperthermophilic bacteria Aquifex aeolicus also suggested a possible dimerization of subunits S6 and S18 28,29. The previous studies showed that S6 and S18 are located in the central domain of 16S rRNA and the crystal structure of this domain is already solved by Williamson30. The principal interface protrusion of 50S subunit penetrates deeply into this domain and remains virtually unchanged in the 70S complex31. Some studies also showed that this domain includes S15 protein binding pathway29,30,32. The cooperative binding of S6 and S18 follows the binding of S15 to 16S rRNA and is required for binding of S11 and S2127. The location of these protein subunits can be seen in Figure 12. Thermodynamics and kinetic experiments of S6 and S18 binding to an S15-RNA complex indicates that S6 and S18 bind, forming a stable heterodimer in solution, and this S6:S18 heterodimer binds to the S15-rRNA complex29. Our present results obtained from elastic network model computations also indicate that S6 and S18 possibly function as a block and this result is consistent with the above experimental data. The purpose of our research was to apply the Anisotropic Network Model (ANM) to study the functional dynamics of the assembly of the 30S subunit of the ribosome. The optimal way to study this problem would be to compare normal modes of the crystal partial structures with the modes of the intact structure and explore conformational transitions between the open forms (partial structures) and the closed forms (in the intact structure). Although the crystal intact structure of 30S ribosome is available, the crystal partial structures are mostly unavailable in PDB. Therefore we computationally generated these partial structures from the intact structure by removing singe protein subunits, pairs of protein subunits and selected larger sets of protein subunits. We compared the slowest normal modes computed from the partial structures with the slowest modes from the corresponding parts in the intact structure. As more crystal partial structures will become available in PDB in the future it might be worthwhile to use such PDB data to reinvestigate the problem. We also hope that our present results may motivate further experimental studies on 30S ribosome assembly.
In summary, the effects of various subunits on the large-scale dynamics of the partial 30S ribosomal structure have been studied by removing single proteins, pairs of proteins or larger sets of proteins at a time. From these protein removal experiments, we have found that the S6 and S18 subunits behave as a single functional block in the 30S structure, exhibiting by a strong correlation of motions of S6 and S18. The existing experimental data provides additional support for our finding derived from elastic network model computations.
Acknowledgments
It is a pleasure to acknowledge the financial support provided by NIH grants 1R01GM073095, 1R01GM072014, and 1R01GM081680.
Reference List
- 1.Flory PJ. Proceedings of the Royal Society of London Series A-Mathematical Physical and Engineering Sciences. 1976;351:351–380. [Google Scholar]
- 2.Kloczkowski A, Mark JE, Erman B. Macromolecules. 1989;22:1423–1432. [Google Scholar]
- 3.Bahar I, Atilgan AR, Erman B. Fold Des. 1997;2:173–181. doi: 10.1016/S1359-0278(97)00024-2. [DOI] [PubMed] [Google Scholar]
- 4.Atilgan AR, Durell SR, Jernigan RL, Demirel MC, Keskin O, Bahar I. Biophys J. 2001;80:505–515. doi: 10.1016/S0006-3495(01)76033-X. [DOI] [PMC free article] [PubMed] [Google Scholar]
- 5.Bahar I, Jernigan RL. J Mol Biol. 1998;281:871–884. doi: 10.1006/jmbi.1998.1978. [DOI] [PubMed] [Google Scholar]
- 6.Bahar I, Erman B, Jernigan RL, Atilgan AR, Covell DG. J Mol Biol. 1999;285:1023–1037. doi: 10.1006/jmbi.1998.2371. [DOI] [PubMed] [Google Scholar]
- 7.Gregory ST, Lieberman KR, Dahlberg AE. Nucleic Acids Res. 1994;22:279–284. doi: 10.1093/nar/22.3.279. [DOI] [PMC free article] [PubMed] [Google Scholar]
- 8.Jernigan RL, Bahar I, Covell DG, Atilgan AR, Erman B, Flatow DT. Journal of Biomolecular Structure & Dynamics. 2000;(Sp Iss S1):49–55. doi: 10.1080/07391102.2000.10506603. [DOI] [PubMed] [Google Scholar]
- 9.Ramaswamy A, Bahar I, Ioshikhes I. Proteins. 2005;58:683–696. doi: 10.1002/prot.20357. [DOI] [PubMed] [Google Scholar]
- 10.Yang LW, Rader AJ, Liu X, Jursa CJ, Chen SC, Karimi HA, Bahar I. Nucleic Acids Res. 2006;34:W24–W31. doi: 10.1093/nar/gkl084. [DOI] [PMC free article] [PubMed] [Google Scholar]
- 11.Tama F, Valle M, Frank J, Brooks CL., III Proc Natl Acad Sci U S A. 2003;100:9319–9323. doi: 10.1073/pnas.1632476100. [DOI] [PMC free article] [PubMed] [Google Scholar]
- 12.Wang Y, Rader AJ, Bahar I, Jernigan RL. J Struct Biol. 2004;147:302–314. doi: 10.1016/j.jsb.2004.01.005. [DOI] [PubMed] [Google Scholar]
- 13.Mizushima S, Nomura M. Nature. 1970;226:1214. doi: 10.1038/2261214a0. [DOI] [PubMed] [Google Scholar]
- 14.Held WA, Ballou B, Mizushima S, Nomura M. J Biol Chem. 1974;249:3103–3111. [PubMed] [Google Scholar]
- 15.Held WA, Mizushima S, Nomura M. J Biol Chem. 1973;248:5720–5730. [PubMed] [Google Scholar]
- 16.Culver GM, Noller HF. RNA. 1999;5:832–843. doi: 10.1017/s1355838299990714. [DOI] [PMC free article] [PubMed] [Google Scholar]
- 17.Powers T, Daubresse G, Noller HF. J Mol Biol. 1993;232:362–374. doi: 10.1006/jmbi.1993.1396. [DOI] [PubMed] [Google Scholar]
- 18.Schluenzen F, Tocilj A, Zarivach R, Harms J, Gluehmann M, Janell D, Bashan A, Bartels H, Agmon I, Franceschi F, Yonath A. Cell. 2000;102:615–623. doi: 10.1016/s0092-8674(00)00084-2. [DOI] [PubMed] [Google Scholar]
- 19.Culver GM. Biopolymers. 2003;68:234–249. doi: 10.1002/bip.10221. [DOI] [PubMed] [Google Scholar]
- 20.Stagg SM, Mears JA, Harvey SC. J Mol Biol. 2003;328:49–61. doi: 10.1016/s0022-2836(03)00174-8. [DOI] [PubMed] [Google Scholar]
- 21.Hamacher K, Trylska J, McCammon JA. PLoS Comput Biol. 2006;2:e10. doi: 10.1371/journal.pcbi.0020010. [DOI] [PMC free article] [PubMed] [Google Scholar]
- 22.SantaLucia J., Jr Proc Natl Acad Sci U S A. 1998;95:1460–1465. doi: 10.1073/pnas.95.4.1460. [DOI] [PMC free article] [PubMed] [Google Scholar]
- 23.Doruker P, Jernigan RL, Bahar I. J Comput Chem. 2002;23:119–127. doi: 10.1002/jcc.1160. [DOI] [PubMed] [Google Scholar]
- 24.Talkington MW, Siuzdak G, Williamson JR. Nature. 2005;438:628–632. doi: 10.1038/nature04261. [DOI] [PMC free article] [PubMed] [Google Scholar]
- 25.Marques [(accessed July 24, 2008)];OA BLZPACK: Description and User’s Guide. 1995 http://crd.lbl.gov/~osni/#Software.
- 26.Ming D, Kong Y, Wakil SJ, Brink J, Ma J. Proc Natl Acad Sci U S A. 2002;99:7895–7899. doi: 10.1073/pnas.112222299. [DOI] [PMC free article] [PubMed] [Google Scholar]
- 27.Lu MY, Ma JP. Biophysical Journal. 2005;89:2395–2401. doi: 10.1529/biophysj.105.065904. [DOI] [PMC free article] [PubMed] [Google Scholar]
- 28.Recht MI, Williamson JR. J Mol Biol. 2004;344:395–407. doi: 10.1016/j.jmb.2004.09.009. [DOI] [PubMed] [Google Scholar]
- 29.Recht MI, Williamson JR. J Mol Biol. 2001;313:35–48. doi: 10.1006/jmbi.2001.5018. [DOI] [PubMed] [Google Scholar]
- 30.Agalarov SC, Prasad GS, Funke PM, Stout CD, Williamson JR. Science. 2000;288:107–112. doi: 10.1126/science.288.5463.107. [DOI] [PubMed] [Google Scholar]
- 31.Matadeen R, Patwardhan A, Gowen B, Orlova EV, Pape T, Cuff M, Mueller F, Brimacombe R, van Heel M. Structure. 1999;7:1575–1583. doi: 10.1016/s0969-2126(00)88348-3. [DOI] [PubMed] [Google Scholar]
- 32.Williamson JR. Curr Opin Struct Biol. 2008;18:299–304. doi: 10.1016/j.sbi.2008.05.001. [DOI] [PMC free article] [PubMed] [Google Scholar]


