Abstract
Purpose
The purpose of this investigation was to determine the aerodynamic and acoustic effects due to a sudden change from chest to falsetto register or vice versa. It was hypothesized that the continuous change in subglottal pressure and flow rate alone (pressure-flow sweep) can trigger a mode change in the canine larynx
Method
Ten canine larynges were each mounted over a tapered tube that supplied pressurized, heated, and humidified air. Glottographic signals were recorded during each pressure-flow sweep experiment, during which airflow was increased in a gradual manner for a period of 20–30 seconds.
Results
Abrupt changes in Fo and mode of vibration occurred during the pressure-flow sweep in the passive larynx without any change in adduction or elongation. The lower frequency mode of oscillation of the vocal folds, perceptually identified as the chest register, had relatively large amplitude oscillation, significant vocal fold contact, a rich spectral content, and a relatively loud audio signal. The higher frequency mode of oscillation, perceptually identified as falsetto, had little or no vocal fold contact, and a dominant first partial. Relatively abrupt Fo changes also occurred for gradual adduction changes, with the chest register corresponding to greater adduction, falsetto to less adduction.
Keywords: canine larynx, register shift, chest and falsetto, pressure-flow sweep, glottal waveform
INTRODUCTION
A sudden change in voice fundamental frequency is a biomechanical and acoustic phenomenon that can occur during phonation. Biomechanical factors such as vocal fold length, tension, thickness, and shape control the fundamental frequency, intensity, and resulting spectra. Changes in the biomechanical properties may result in the production of perceptually different vocal registers. Researchers have proposed several theories regarding control of vocal registers. Studies of the mechanisms related to chest-falsetto register shifts have suggested that the degree of vocal fold adduction, vocal fold shape, length and tension, and vocal fold collision may all play a part in register transitions (van den Berg and Tan, 1959; van den Berg, 1960; Titze, 1988; Vilkman et al., 1995).
Using excised human larynges, van den Berg and Tan (1959) identified the three phonatory conditions of “chest voice”, “mid voice”, and “falsetto voice”, achieved by changing the level of vocal fold tension. They described the chest voice with its full length vibration of large amplitude and rich timbre, falsetto voice with the vibration of only vocal fold margins and vocal ligament and poor timbre, and mid voice as a transition between the other two. Also, using the previous data, van den Berg (1960) asserted that the properties and adjustment of the vocal ligaments play an essential role in the determination of the vibrational pattern. He suggested that when the vocal folds oscillate in a region where these registers overlap, an increase or decrease of adduction of the vocal processes may result in a register transition. To increase pitch (e.g., a pitch glide), the singer lengthens the vocal folds, increasing the longitudinal tension on the vocal ligaments, and as a result, the vocal processes abduct slightly and the vocal register changes from chest to falsetto. The transition to falsetto could be delayed to a higher pitch if medial compression were increased (by activation of adductory muscles) or if airflow increased.
Hirano et al. (1970) investigated the activities of laryngeal muscles with hooked wire electromyography in four professional singers. They found that the vocalis and lateral cricoarytenoid muscles show greater activity during the heavier register. They asserted that the vocalis muscle is essential for register transition. Their only consistent finding was that during transition from chest to falsetto, there was no pronounced activity of the CT muscle unless there was a great increase of pitch.
Hollien (1974) defined three registers as pulse, modal (chest), and loft (falsetto) based on vocal quality and acoustic and physiological behavior, and stated that they are totally laryngeal events. Through acoustic and physiological analysis of vocal registers, he asserted that they occupy different fundamental frequency ranges, have different vocal intensity ranges, and different vibration patterns. He argued that vocal fold function is register dependent in terms of mass, length, and stiffness of the vocal folds.
Titze (1988) suggested that the shift from chest to falsetto register can be brought about by a small decrease in glottal adduction and/or amplitude of vibration. Titze also speculated that the lower portion of the vocal fold is more adducted during chest register than during falsetto. He stated that activation of the thyroarytenoid muscle (TA) causes the vocal fold to bulge medially below the level of the vocal processes, creating a more rectangular glottis and a thicker vibrating structure. In addition, Titze (1994) has suggested that if chest voice is to be maintained as pitch increases, the medial edge of the vocal fold must retain its quasi-rectangular shape. To achieve this, thyroarytenoid muscle activity must increase to compensate for the lengthening and thinning of the vocal folds caused by increased cricothyroid muscle contraction. During falsetto, the mucosa is relatively lax while the vocal ligament supports the longitudinal tension and the glottis becomes less rectangular.
Vilkman et al. (1995) hypothesized that for chest voice to occur, in addition to vocal fold contact there must be sufficient collision along the vertical and longitudinal planes of the vocal folds, which they refer to as a ‘critical mass’. EGG recordings of vocal fold contact during register transitions from falsetto to chest at low pitches showed that increased vocal fold contact began prior to the switch to chest register. Examination of the EGG signal showed gradually increasing vocal fold contact over numerous cycles before the glottal flow waveform assumed the characteristic chest voice pattern. Vilkman et al. (1995) stated that trained singers have been reported to use shorter vocal fold lengths than nonsingers. This may be due to a decrease in stiffness and the maintenance of a rectangular glottis in order to shift smoothly into falsetto.
To establish a firm understanding of the register transition and to evaluate the aforementioned theories, investigators have used models of phonation that are capable of producing phonation in the human voice range with necessary controls. Among these models are excised human and canine larynges that provide direct control over adduction, elongation, and air flow, and access to a view of the vocal folds from above. The excised human larynx was used by van den Berg and Tan (1959) and van den Berg (1960) to build preliminary theories and extensive use of the excised canine larynx has shown that it is a good model of human phonation. Because of its lack of vocal ligament, its frequency range does not extend to the high human pitches, but it has been shown that the canine larynx can generate both chest and falsetto and can reach frequencies as high as 450 Hz (Alipour & Scherer, 2007). Thus, it is reasonable to use the excised canine model for the questions posed in this study.
The lack of a ligament and of activation of the TA muscle in the excised canine has raised the question of whether the canine larynx can produce falsetto or mode changes. As described Berry et al. (1996) whose research used excised canine larynges, mode changes in the canine larynx are possible and are explained by nonlinear dynamic theory. They asserted that when conditions coexist for the two modes of phonation (chest and falsetto), a minor disturbance in the aerodynamic or biomechanical parameters could result in a mode change. The nonlinear dynamic approach was also used by Svec et al. (1999) and Tokuda et al. (2007). By analyzing the video data from van den Berg (1960) experiments and voice samples from three human subjects, Svec et al. (1999) studied the abrupt chest-falsetto register transition from an acoustic point of view. Also, Tokuda et al. (2007) investigated register transitions and voice instabilities using an excised human larynx and a three-mass model of the vocal folds. None of the above studies provided simultaneous aerodynamic and acoustic data during register transitions.
The purpose of this investigation was to determine the aerodynamic and acoustic effects due to a sudden change from chest to falsetto register or vice versa. It was hypothesized that continuous changes in subglottal pressure and flow rate alone (i.e., a pressure-flow sweep) can trigger a mode change in the canine larynx. This report intends to: (a) describe the mode changes relative to adduction, subglottal pressure, flow, and vibration stability that could be elicited from a passive larynx; (b) examine how the frequency shifts are affected by adduction and elongation; and (c) determine if the frequency shifts are accompanied by change in timbre and register.
METHODS
Ten excised canine larynges were obtained following cardiovascular research experiments at the University of Iowa Hospitals and Clinics. The canines ranged in weight from 17 kg to 28 kg with vocal fold length ranging from 12 mm to 16 mm (see Table 1 for details). Each appeared free of laryngeal abnormalities. The major control parameters in this study were subglottal pressure, flow rate, adduction, and elongation. Flow rate was controlled with a fine control rotary valve and monitored via a mechanical flow meter (Glimont rotameter, J197). Adduction was created either by the approximating arytenoid cartilages against metal shims of various thicknesses (0.1 – 1.0 mm) or by a pair of sutures pulling on the muscular process of each arytenoid cartilage to simulate lateral cricoarytenoid and (lateral) thyroarytenoid muscle action as in arytenoid adduction. Vocal folds were elongated either by pulling the anterior side of the thyroid cartilage with a micrometer-controlled alligator clip attached to the middle of the thyroid cartilage or by pulling the arytenoids posteriorly by two bilateral sutures.
Table 1.
Canine larynges used in this study and information on their size. Vocal fold length was measure at rest position from the anterior commissure to the tip of vocal processes.
| Larynx | Weight kg | Gender | VFL mm |
|---|---|---|---|
| CL33 | 22 | M | 16 |
| CL34 | 22 | M | 15 |
| CL38 | 28 | F | 16 |
| CL40 | 22 | M | 14 |
| CL41 | 22 | F | 14 |
| CL52 | 17 | M | 12 |
| CL54 | 18 | M | 14 |
| CL56 | 18 | M | 13 |
| CL64 | 18 | M | 13 |
| CL67 | 19 | F | 12 |
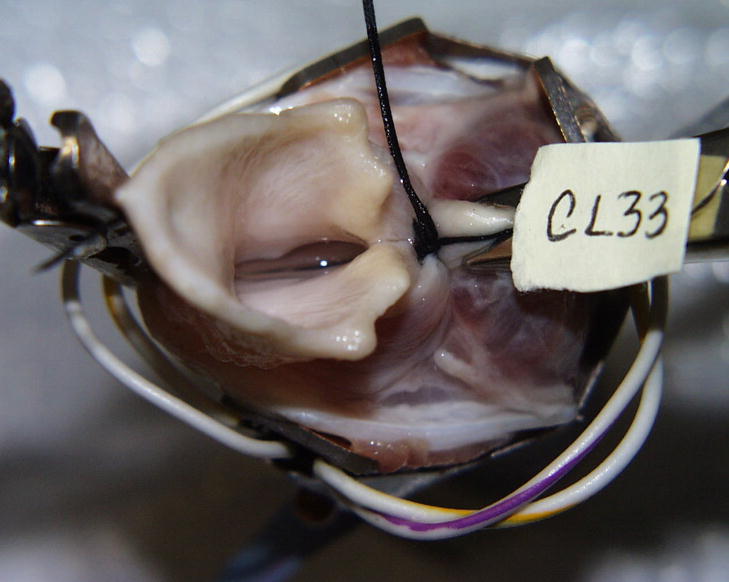
Figure 1 shows a mounted excised larynx with adduction and elongation sutures. Heated and humidified air entered the larynx via tapered ¾ inch tubing. Electrode plates from a Synchrovoice electroglottograph (EGG) were placed on the thyroid laminae to obtain the EGG signal during phonation. The EGG signal was used to extract fundamental frequency. The audio signal was obtained with a microphone (Sony ECM-MS907) at a distance of 6–10 inches from the larynx and recorded on a digital audio tape recorder (Sony PCM-M1). The time-varying subglottal pressure was recorded using a pressure transducer (Microswitch 136PC01G1, with an approximate bandwidth of 0–1 kHz) mounted in the tracheal tube 10 cm below the vocal folds. The mean flow rate was monitored with an in-line flow meter (Gilmont rotameter model J197) and measured with a flow pneumotach (Rudolph 4700 with a Validyne DP103 pressure transducer) upstream of the humidifier. The top view of the larynx was monitored on a TV screen while it was videotaped with a stroboscopic light source (Phaser Strobe, Monarch Instruments).
Figure 1.
Mounted excised canine larynx with EGG electrodes and control sutures. Epiglottis and false vocal folds are intact.
Each experiment started with two pressure-flow sweeps for each experimental condition (see Table 2). These sweeps consisted of a gradual increase in pressure and flow from the lowest level needed to initiate phonation to the highest level at which phonation could be maintained (upward sweep). This was performed by manually increasing the flowrate with the rotary valve. Each sweep lasted about 20 seconds and was used to identify the range of sustainable oscillation in the pressure-flow-frequency domain, and to reveal any region with sudden change in phonation, with adduction and elongation as the major control parameters. The second sweep was started from the highest flowrate of the up-sweep and decreased (again by manual manipulation of the rotary valve) until oscillation stopped (downward sweep), essentially the reverse of the first sweep.
Table 2.
Effects of sudden frequency changes in excised canine larynges. The experimental conditions are described in the second column. The average values of four glottal parameters, namely fundamental frequency, subglottal pressure, pressure amplitude and flow rate, before and after the sudden change are presented in the columns.
| Larynx & Case | Experimental Condition | Freq1 Hz |
Freq2 Hz |
Ps1 cm H2O |
Ps2 cm H2O |
Pa1 cm H2O |
Pa2 cm H2O |
Flow1 cm3/s |
Flow2 cm3/s |
|---|---|---|---|---|---|---|---|---|---|
| CL33as2 | No Elongation, PFS− | 140.4 | 357.2 | 23.4 | 18.5 | 9.3 | 5.2 | 1132 | 1243 |
| CL33fs2 | Elongation=2mm, PFS− | 154.5 | 355.1 | 26.7 | 17.5 | 13.6 | 5.2 | 969 | 1144 |
| CL33gs2 | SG Removed, PFS− | 273.1 | 299.2 | 21.9 | 17.0 | 11.7 | 4.7 | 1151 | 1165 |
| CL38bs2 | Adduction=100g, PFS− | 132.6 | 284.1 | 31.6 | 19.1 | 8.4 | 6.4 | 632 | 859 |
| CL38cs2 | Adduction=150g, PFS− | 132.1 | 283.6 | 33.1 | 19.1 | 8.8 | 6.5 | 643 | 858 |
| CL40es3 | Adduction=100g, PFS+ | 129.1 | 162.5 | 21.1 | 17.7 | 6.7 | 3.4 | 651 | 922 |
| CL64cs1 | Adduction=150g, PFS+ | 195.4 | 231.6 | 20.3 | 22.5 | 10.6 | 4.1 | 388 | 459 |
| CL67es2 | Adduction=250g, PFS− | 251.1 | 389.9 | 20.4 | 13.9 | 2.7 | 1.9 | 646 | 503 |
| CL56es4 | Adduction=300g, PFS− | 169.4 | 292.7 | 31.1 | 27.0 | 9.2 | 3.8 | NA | NA |
| CL52hs1 | Inc. Adduction Sweep | 197.2 | 429.4 | 23.3 | 25.4 | 8.6 | 9.4 | 1455 | 1429 |
| CL54cs2 | Dec. Adduction Sweep | 110.3 | 158.0 | 22.6 | 25.7 | 4.6 | 9.3 | 742 | 715 |
| CL56js1 | Inc. Manual Elongation | 168.2 | 422.1 | 33.2 | 29.7 | 10.0 | 1.6 | NA | NA |
| CL33fs1 | Elongation=2mm, PFS+ | 371.6 | 155.6 | 20.3 | 27.0 | 7.3 | 14.2 | 1202 | 996 |
| CL33gs1 | SG Removed, PFS+ | 282.8 | 134.6 | 12.9 | 20.2 | 3.4 | 11.0 | 789 | 997 |
| CL34ds3 | Elongation=2mm, PFS+ | 373.4 | 161.5 | 23.9 | 33.4 | 7.7 | 17.9 | 1496 | 1353 |
| CL40fs1 | Adduction=150g, PFS+ | 167.3 | 125.3 | 15.1 | 18.7 | 3.4 | 6.0 | 530 | 218 |
| CL41cs1 | Adduction=50g, PFS+ | 327.0 | 180.5 | 12.4 | 18.2 | 0.7 | 4.3 | 344 | 529 |
| CL52ls1 | Inc. Elongation Sweep | 307.0 | 265.0 | 14.3 | 15.8 | 3.0 | 2.2 | 134 | 130 |
| CL56bs1 | Inc. Adduction Sweep | 302.9 | 157.5 | 28.8 | 31.8 | 10.3 | 14.0 | NA | NA |
The abbreviations are:
NA: Not available
SG: Supraglottic Structure
PFS: Pressure-flow Sweep (+ for upward, − for downward)
Freq1 & Freq2: Frequencies before and after sudden changes
Ps1 & Ps2: Average subglottal pressure values
Pa1 & Pa2: Average subglottal pressure amplitudes
Flow1 & Flow2: Average flow rate values
Besides the pressure-flow sweep experiments, in some cases adduction and elongation changes were also made in a continuous sweep fashion. This was intended to examine whether physiological variables such as length (tension) or adduction changes could trigger a sudden change in the fundamental frequency and other glottal parameters as suggested by Titze (1988). The adduction sweep was performed by attaching a load cell (Omega, LCL816) to a micrometer and gradually pulling the adduction suture with the micrometer; the adduction force signal was acquired, amplified, and recorded along with the other signals onto the computer. Similarly, by gradually pulling posteriorly on the arytenoids with a micrometer-attached load cell, the elongation sweep was performed.
The EGG, subglottal pressure, flow rate, and microphone signals were digitized into a computer by using an A/D (14 bit) board and software (DATAQ Instruments). These signals were later converted to calibrated physical quantities in a MATLAB routine and used for the aerodynamic and acoustic analysis. The selected sweep section was divided into 50–100 segments such that each segment included at least 10 phonatory cycles. After identifying the fundamental frequency range from a spectrogram, the EGG signal was digitally low-pass filtered just above the maximum Fo and used to calculate an average period for each segment (using a zero crossing technique or peak detection method). The mean subglottal pressure and mean flowrate for each segment were also calculated.
Perceptual judgments of timbre were made by two judges, both certified speech-language pathologists specializing in voice. One judge also had 20 years of experience teaching singing. Judges were asked to describe the phonation primarily in terms of register (falsetto, chest), but they were also encouraged to make any other observations about the phonation (unstable, breathy, pressed, etc.). Phonation was judged to be in the falsetto register if it was a “bell-like tone” or “thin” in quality, whereas it was judged to be in the chest register if the phonation sounded rich in timbre.
Spectral analysis of the signals was obtained using both WINDAQ software (Dataq Instruments) and MATLAB. Measures were made of the amplitude of the first and second harmonic (H1 and H2) and the number of partials in the signal at least 6 dB above the spectral noise before and after the mode change.
RESULTS
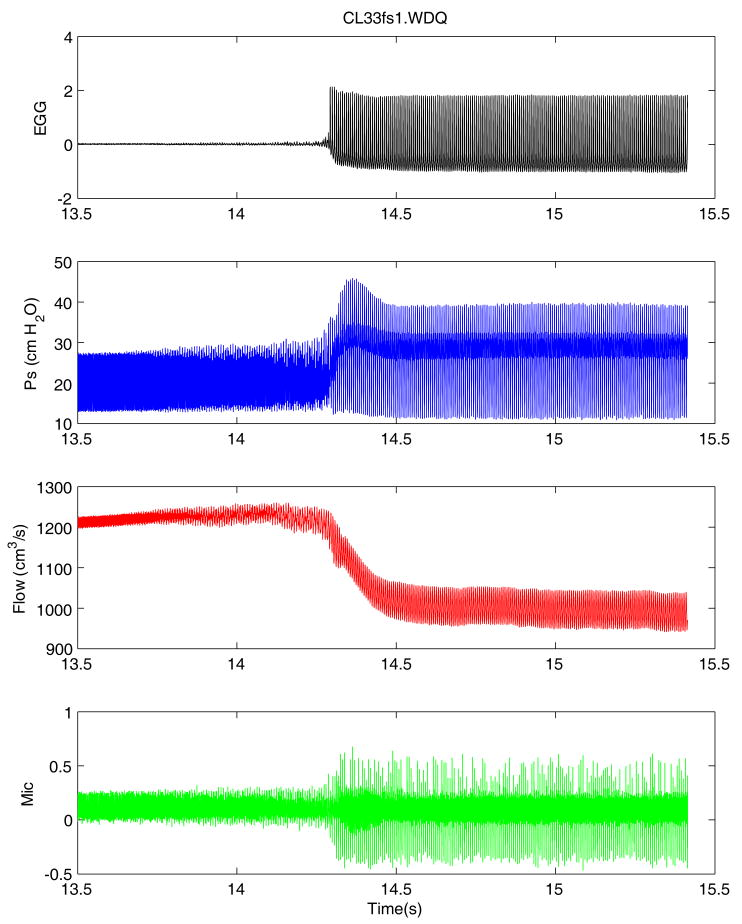
Figure 2 shows a portion of a pressure-flow sweep (pressure increased) in an elongated (2 mm from rest length) canine larynx with supraglottic structures that demonstrates a mode change at around 14.3 seconds. There are four panels that include (from top to bottom) the raw waveforms for EGG, subglottal pressure, flow rate, and the microphone signal. On the left side, prior to the shift, there is a high frequency oscillation with an average frequency of 358 Hz. After the shift, frequency drops to 155 Hz, as shown in Figure 3. Significant aerodynamic and acoustic effects are visible from these signals. The amplitude of the signals is larger after the change from the higher to the lower frequency (Figure 2). Of particular importance is the larger amplitude of the microphone signal that is related to the increased intensity of the acoustic signal and to the increased amplitude of oscillations inferred from the greatly increased AC amplitude of the EGG, Ps, and flow signals. The sound pressure level increased from 74.1to 85.9 dB-A via a sound level meter (Extech 407762) placed 14 cm from the larynx with A-weighting.
Figure 2.
Aerodynamic and acoustic changes associated with a mode change during an increasing pressure-flow sweep in canine larynx CL33 with epiglottis and false folds intact. Waveforms from the top to bottom are: EGG, subglottal pressure, flow rate, and microphone signal.
Figure 3.
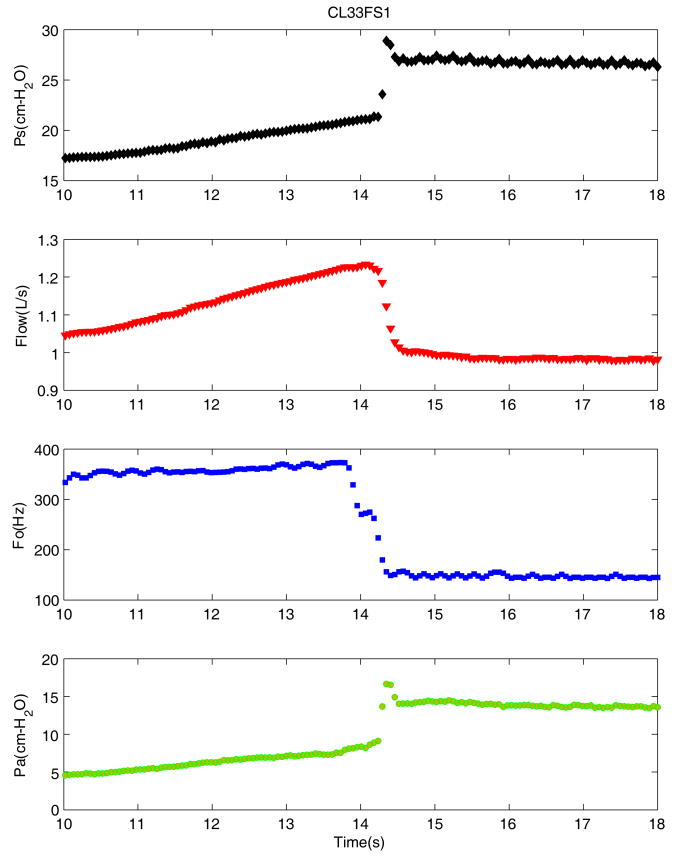
Variations of mean subglottal pressure (Ps), mean flow rate (Flow), and mean pressure amplitude (Pa) during mode changes corresponding to data in Figure 2, each data point provides average value calculated for 20 cycles.
For better understanding of these effects, the entire signal was divided into 100–200 segments of 10–20 cycles each. To estimate the number of segments, the selected sweep range was divided by the duration of 20 periods (smallest period) and the result was rounded off. For example, in Figure 3, the selected range was divided into 180 segments. The average values of the subglottal pressure, flow rate, fundamental frequency, root means square of the audio signal (used for intensity), and also the amplitudes of the subglottal pressure and EGG signals were calculated. Figure 3 provides traces (average segment values) of the subglottal pressure, flow rate, fundamental frequency, and subglottal pressure amplitude signals related to Figure 2. One can easily discern discontinuities in the signals at the moment of the change in frequency. Prior to the change, the controlled gradual increase in the flow resulted in a measured gradual increase in both the flow and pressure variables. The first aerodynamic effect associated with the Fo change is a substantial increase of mean pressure and decrease of mean flow rate indicating an increase of glottal flow resistance in the absence of any change in arytenoid adduction. The second effect is the increase of the subglottal pressure amplitude (Pa) with the change from the higher frequency to the lower frequency. Video observation of the larynx also confirmed an increase in the vocal fold vibration amplitude at the lower frequency, as well as an increase in the amount of tissue involved in vibration, compared to the higher frequency.
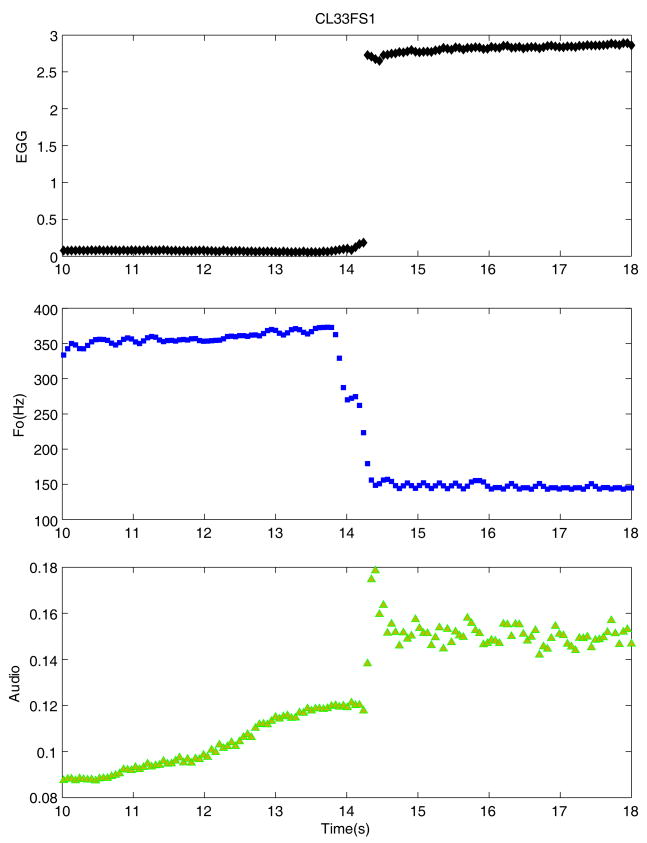
The signal traces in Figure 4 from top to bottom are the calculated EGG amplitude, fundamental frequency (repeated for comparison), and intensity of the audio signal, respectively. The amplitude of the EGG signal has been shown to be related strongly to the vocal fold contact area (Childers et al., 1986; Scherer et al., 1988). Thus, the low level of this signal during the higher frequency indicates lack of contact (or minimal or undetectable contact) between the two folds. With the shift to the lower frequency, there is an increase in the EGG amplitude, accompanied by a louder audio signal. Prior to the shift, the audio signal had gradually increased with the increase in the subglottal pressure, and then a sudden intensity increase is seen at the time of the shift to the lower frequency.
Figure 4.
Time variations of EGG peak-to-peak, fundamental frequency (Fo), and audio signal averaged over 20 cycles for the same pressure-flow sweep as in Figure 2. The discontinuities correspond to the same instant of the mode change in Figure 2.
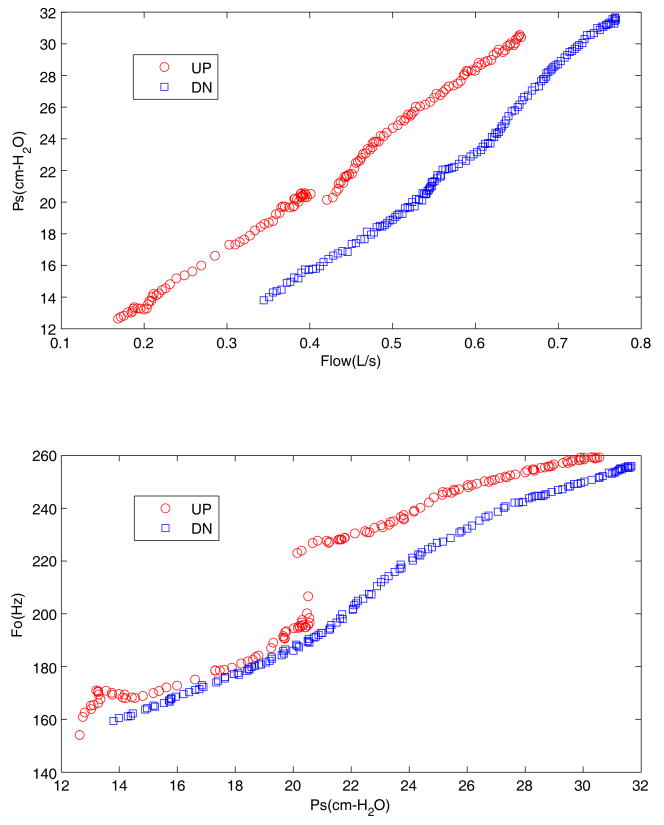
Figure 5 includes the pressure-flow relation (top graph) and pressure-frequency relation (bottom graph) for canine larynx CL64 during an upward sweep (circles) and downward sweep (squares). During the upward sweep there is a sudden increase in frequency at about 20 cm H2O pressure, from about 195 Hz to 230 Hz. There is a corresponding break in the pressure-flow curve, indicating a sudden increase in the flow rate. The downward sweep does not show any mode change for this case. It is interesting to note that the pressure-flow sweep shows a hysteresis effect that is on the sweep down, subglottal pressure is lower for the same flowrate and frequency is lower for the same pressure. This is a manifestation of the nonlinear dynamic behavior of the oscillating canine larynx (Svec et al, 1999).
Figure 5.
Pressure-flow and pressure-frequency relations during the upward (UP) and downward (DN) sweeps.
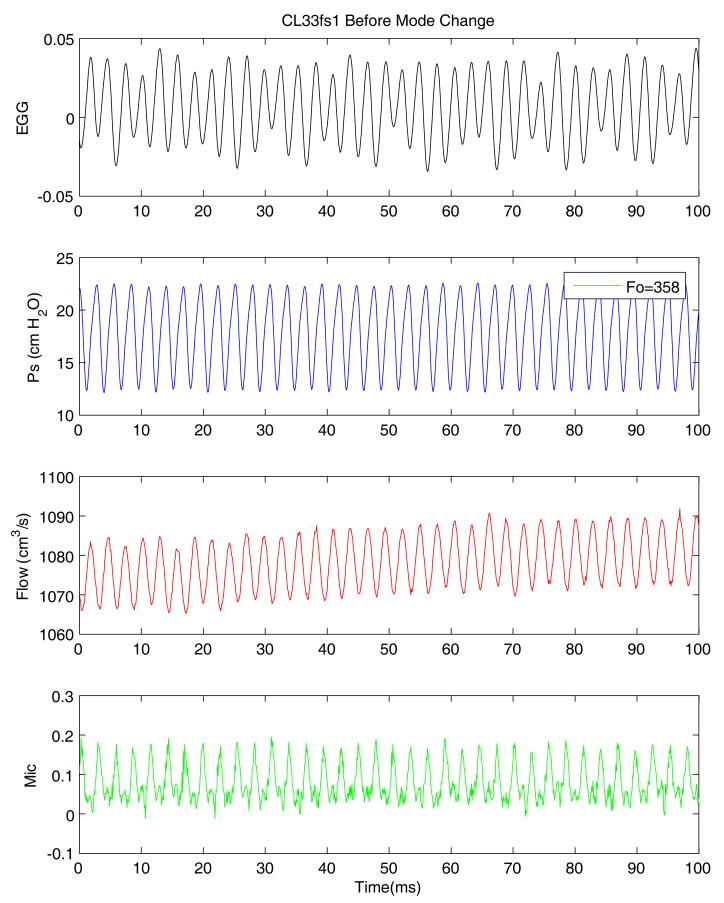
Figure 6 shows a portion of the glottal waveforms just before the change to a lower frequency. The EGG waveform is very weak with irregular amplitude. The pressure waveform appears to be very regular and sinusoidal and could be used for pitch calculation when the EGG signal is inadequate (as seen in this case). The sinusoidal shape may be due to the small oscillation of the vocal fold edges at the high frequency. The average fundamental frequency was 358 Hz. The subglottal pressure peak-to-peak amplitude was about 10 cm H2O; flow rate peak-to-peak amplitude was about 15 cm3/s and microphone peak-to-peak amplitude about 0.2 volts. The microphone signal appears to be a somewhat irregular signal but could also be used for pitch detection with low-pass filtering.
Figure 6.
Close up view of glottal waveforms before the mode change of Figure 2.
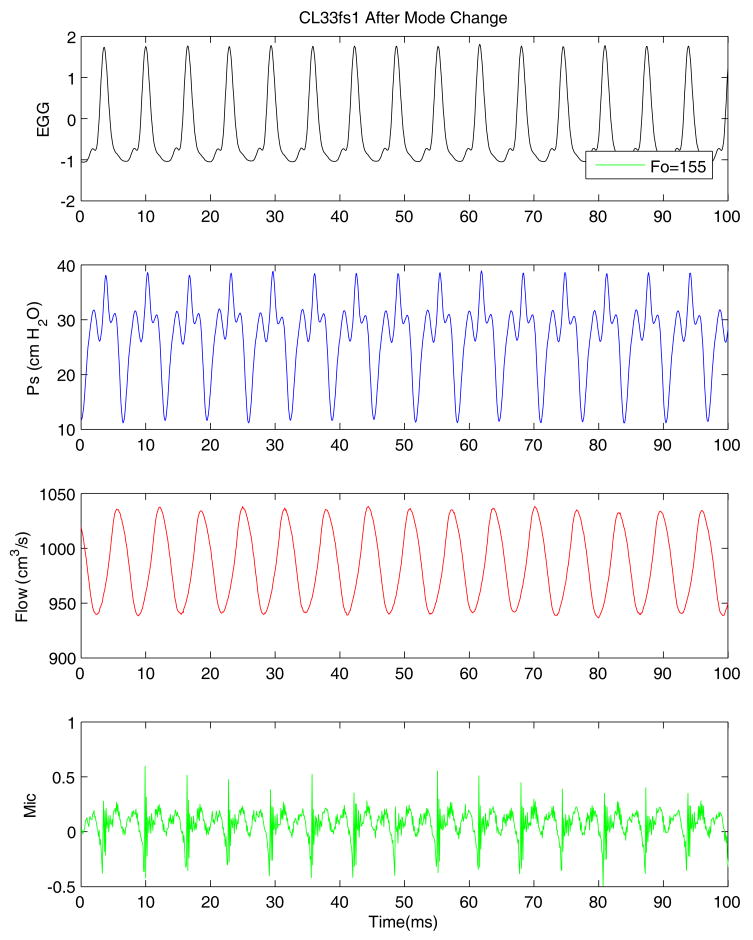
Figure 7 demonstrates the changes in the glottal waveforms associated with the frequency change. Here a well defined EGG waveform indicates definite and regular vocal fold contact at the lower frequency of 155 Hz. This change of shape of the EGG signal indicates a different glottal closure behavior, which may result in a modification of voice timber (Titze, 1988) that will be discussed later. The pressure waveform not only indicates an increase of mean pressure, but also shows an increase in the pressure peak-to-peak amplitude from 10 cm H2O to about 25 cm H2O, a 250% increase. This larger pressure amplitude corresponds to the larger oscillation amplitude for the lower pitch mode. The flow rate shows a decrease in the mean value but an increase in the peak-to-peak amplitude with an approximate value of 100 cm3/s, a large increment corresponding to the pressure increment (it is noted that the dynamic flow was obtained via the low-frequency response pneumotach located upstream of the humidifier prior to the ”trachea” and glottis). The microphone signal also shows a large increase in amplitude, indicating louder phonation.
Figure 7.
Close up view of glottal waveforms after the mode change of Figure 2.
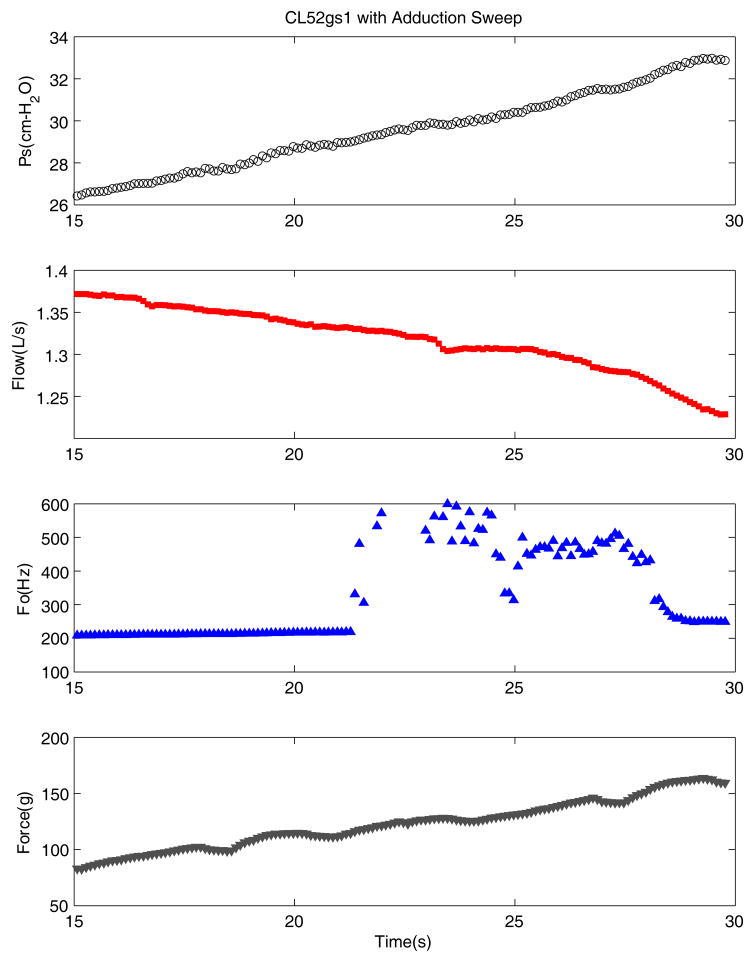
Figure 8 shows results for a continuous increase of adduction in a different excised larynx (CL52). There are four traces in the figure which are similar to Figure 3 except the fourth trace here is the measured force applied by the micrometer pull. Unlike the pressure-flow sweep, this process started from a sustained oscillation and prevailing flow; the subsequent mean flow decrease was due to the increased adduction, not due to manipulating the upstream flow per se. For example, the adduction sweep started from an oscillation of about 200 Hz with 26.4 cm H2O of subglottal pressure and 1.37 L/s flow. As adduction gradually increased, the subglottal pressure increased and flow rate decreased gradually, but the fundamental frequency did not change much until the time when oscillation became unstable. Fo then increased more than an octave. The sudden change of frequency lasted about seven seconds and interestingly did not induce any noticeable abrupt changes in the pressure and flow.
Figure 8.
Time variations of the glottal parameters in an adduction sweep. The bottom signal is the pulling force on the adduction sutures.
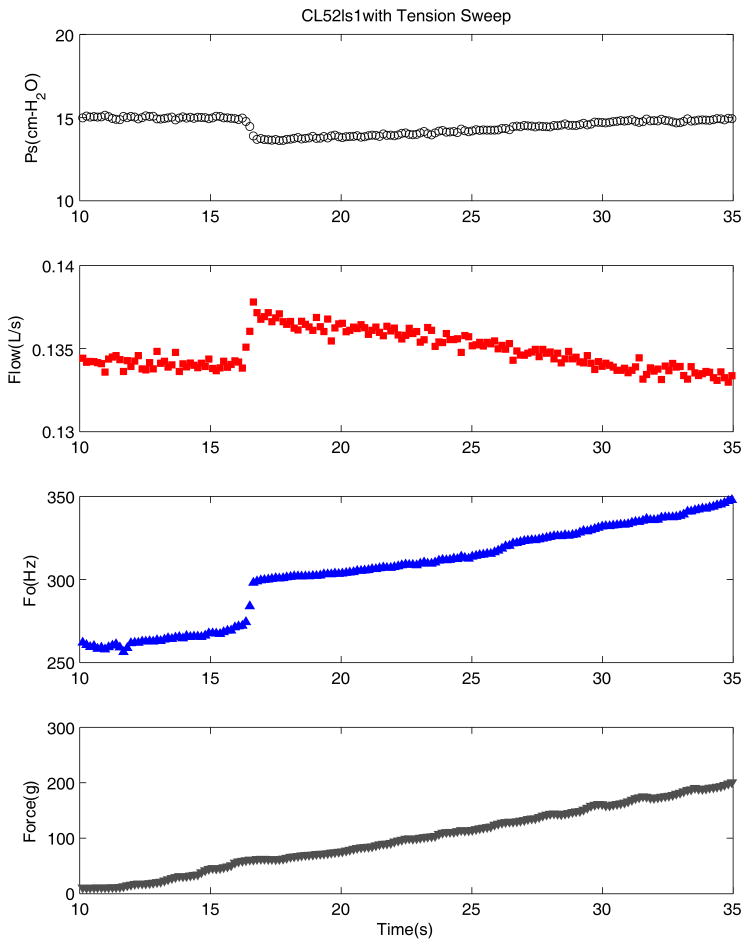
Figure 9 is similar to the Figure 8, except the fourth trace shows the elongation force. Again, the process started from a sustained oscillation of about 270 Hz with 15 cm H2O subglottal pressure and a prevailing flow of approximately 0.135 L/s. As the elongation force or vocal fold tension increased, the fundamental frequency increased gradually until a point (at about 17 seconds) when there was a sudden jump of about 25 Hz followed by a continued steady rise in frequency. There are corresponding discontinuities in the subglottal pressure (lowered) and flow rate (raised), although the changes are not great. Although the subglottal pressure remained steady before suddenly dropping, it continued to rise at a slow pace and regained its loss over the next 18 seconds. The flow rate had a small jump of about 2%, and then continued with a downward trend. The rate of increase of fundamental frequency increased from 0.236 Hz/gram before the jump to 0.338 Hz/gram after the jump. The spectrum of the pressure signal indicated that the sudden change of frequency corresponded to removal of some noise, which made the fundamental frequency cleaner and stronger but within the same register.
Figure 9.
Time variations of glottal parameters in an elongation sweep. The bottom signal is the elongation force pulling the arytenoids posteriorly.
Table 2 provides a summary of the measures obtained from increasing and decreasing pressure-flow sweeps for ten excised larynges. In the first column, the 4-character name of each larynx is followed by a 3-character case number. The experimental conditions are described in the second column. The average values of four glottal parameters, namely fundamental frequency, subglottal pressure, subglottal pressure amplitude, and flow rate before (1) and after (2) sudden frequency changes are presented side by side in the following columns. In the upper portion of table (first 12 rows), the sudden frequency change is from lower to higher frequency and in the lower portion of the table (bottom 7 rows), it is reversed. In most cases, only flow (with resulting pressure) was varied in an upward sweep (PFS+) or downward sweep (PFS−), with no change in adduction or elongation. In a few cases, the degree of adduction or elongation was changed in a continuous fashion and these cases were called “adduction sweep” or “elongation sweep”. In all these conditions we were interested in what happens at the lower frequency mode in comparison to the higher frequency mode.
Some common features can be observed in all pressure-flow sweeps. In the upper portion of the table it can be seen that on average, during a gradual downward pressure-flow sweep, the Fo increased 120 Hz, Ps decreased 6 cm H2O, Pa decreased by 4 cm H2O, and flow increased 0.118 L/s, indicating decreased laryngeal flow resistance. The corresponding trend in pressure and flow changes can be observed in the lower portion of the table also. On average, during a gradual upward pressure-flow sweep, the Fo dropped 153 Hz, Ps increased 7 cm H2O, Pa increased by 6 cm H2O, and flow decreased 0.054 L/s, indicating an increased laryngeal flow resistance. Although the magnitude of the change varied substantially across cases, the direction of the change was typically the same.
The mode changes triggered by the adduction sweeps (cases CL52hs1, CL54cs2, and CL56bs1) show minor changes in the glottal parameters in opposite direction compared to pressure-flow sweeps. Only the changes in the pressure amplitude were notable corresponding to changes in oscillation amplitudes. Similarly, when sudden frequency changes were triggered by the elongation, the major changes other than frequency that were observed were in the pressure amplitude.
Relative to motion of the vocal folds for increasing flow, CL67es2 showed that the sudden change of frequency was accompanied by a noticeable sudden change in the aerodynamic parameters and also in the oscillation amplitude observed in the stroboscopic superior view such that the maximum glottal area in the higher frequency mode dropped to half that of the lower frequency mode.
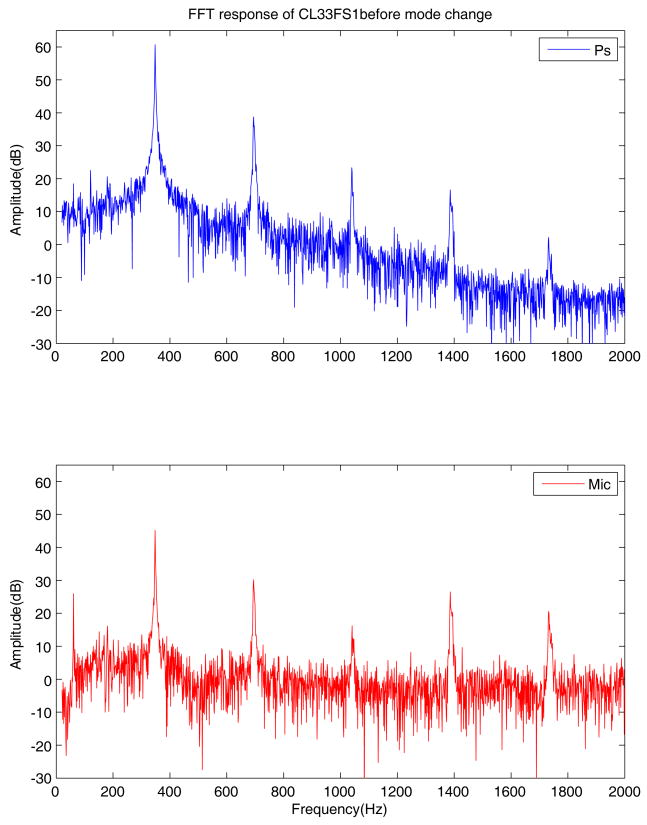
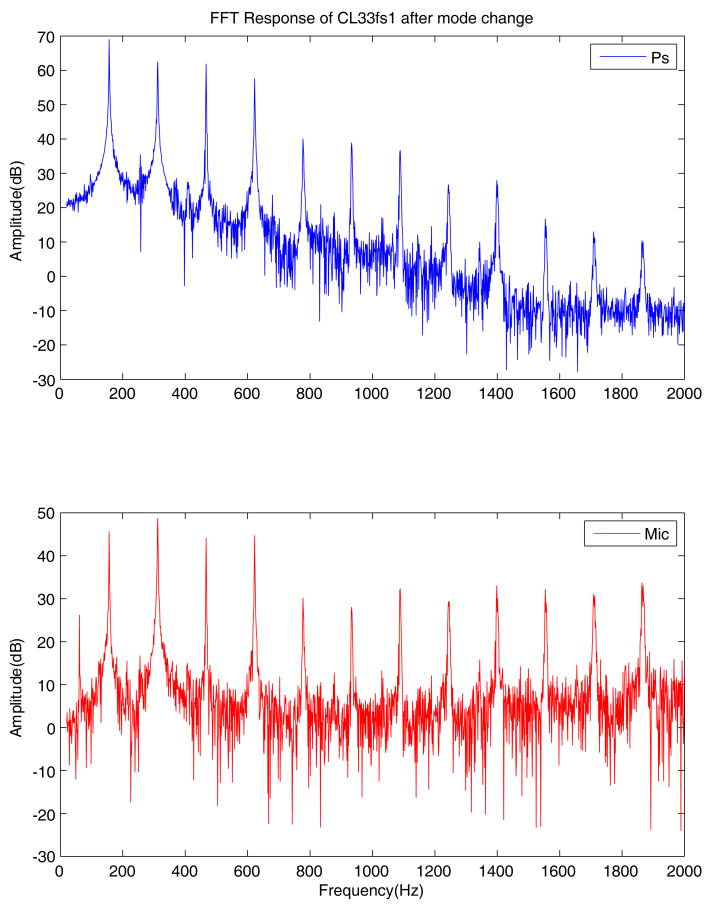
Comparison of the pressure and microphone signals of Figures 6 and 7 suggests that timbre differences may exist between the audio signals of the two frequencies. Perceptually, the sound of the phonation changed from a higher-pitched mildly breathy falsetto to a lower-pitched buzzy chest phonation, with a brief period of unstable chest phonation in between. The perceptual judgment of change in timbre was supported by spectral analysis of the signal. The FFT spectra of the subglottal pressure and microphone signals calculated before and after the change are shown in Figures 10 and 11. The top graph shows the spectrum for the subglottal pressure and the bottom graph shows the spectrum for the microphone signal. Good correspondence between the harmonics of the two signals is seen in the top and bottom graphs. The spectrum of the higher frequency phonation shows a sharp peak at the fundamental, with a fall-off of 21 dB/octave for the subglottal pressure signal, and an H1–H2 value of 15 dB for the microphone signal. These results correspond well to the nearly sinusoidal oscillations of the vocal folds. On the other hand, the spectrum for the lower frequency phonation is rich in partials. The second partial is stronger by 3 dB than the fundamental in the microphone signal, and the fall-off for the subglottal pressure signal is approximately 5 dB/octave. These spectra are due to the more complex nature of the oscillations in the chest register. The 60 Hz partial on both microphone spectra may have been caused by the equipment fan.
Figure 10.
Acoustic spectra of the subglottal pressure and microphone signals before the mode change of Figure 2.
Figure 11.
Acoustic spectra of the subglottal pressure and microphone signals after the mode change of Figure 2.
Table 3 provides a summary of the perceptual ratings and acoustic (spectral) measures obtained from increasing and decreasing pressure-flow sweeps from the excised larynges. During downward sweeps, as pressure and flow decreased gradually, the abrupt change to a higher frequency, lower Ps, and higher flow was accompanied by a perceptual shift from chest to falsetto. The perception of a register change was supported by measurable spectral changes. The phonation that was perceived as chest was characterized by a relatively high number of partials (17 ± 6) and a second partial that was similar in amplitude or slightly higher than the fundamental (by 2 ± 2 dB). The phonation that was perceived as falsetto was characterized by a relatively low number of partials (6 ± 1) and a second partial that was similar in amplitude or lower than the fundamental (by 9 ± 5 dB). Similar trends were noted in the upward sweeps as well. These findings are consistent with previous studies in humans that have shown that chest phonation is characterized by greater energy in the upper harmonics and a small difference between the first and second harmonic (H1–H2), while falsetto phonation is characterized by a relatively stronger fundamental, little or no energy in the upper harmonics, and a greater H1 – H2 difference (Colton, 1972, 1973; Sundberg and Hogset, 2001).
Table 3.
Perceptual judgment of the frequency changes in excised larynges.
| Case | Timbre | # of Partials > 6dB over noise | H1 | H2 | H1 – H2 | Timbre | # of Partials > 6dB over noise | H1 | H2 | H1–H2 |
|---|---|---|---|---|---|---|---|---|---|---|
| Sweep Down | ||||||||||
| CL33as2 | Chest | 11 | 52 | 56 | −4 | Falsetto | 5 | 53 | 52 | 1 |
| CL33fs2 | Chest | 24 | 52 | 54 | −2 | Breathy Falsetto | 6 | 52 | 47 | 5 |
| CL33gs2 | Chest | 21 | 57 | 60 | −3 | Falsetto | 6 | 52 | 40 | 12 |
| CL33hs2 | Chest | 22 | 55 | 59 | −4 | Falsetto | 7 | 59 | 48 | 11 |
| CL33is2 | Chest | 16 | 54 | 55 | −1 | Breathy Falsetto | 8 | 60 | 46 | 14 |
| CL38bs2 | Chest | 15 | 54 | 53 | 1 | Breathy Falsetto | 5 | 55 | 43 | 12 |
| CL38cs2 | Chest | 10 | 54 | 53 | 1 | Breathy Falsetto | 5 | 55 | 44 | 11 |
| Mean | 17 | 54 | 56 | −2 | 6 | 55 | 46 | 9 | ||
| SD | 5.5 | 1.7 | 2.8 | 1.2 | 3.2 | 3.9 | ||||
| Sweep Up | ||||||||||
| CL33fs1 | Breathy Falsetto | 5 | 56 | 46 | 10 | Chest | 29 | 52 | 55 | −3 |
| CL33gs1 | Breathy Falsetto | 5 | 49 | 45 | 4 | Chest | 12 | 51 | 54 | −3 |
| CL33gs3 | Breathy Falsetto | 2 | 47 | 42 | 5 | Chest | 19 | 57 | 59 | −2 |
| CL33hs1 | Falsetto | 6 | 58 | 49 | 9 | Unstable Chest | - | - | ||
| CL33is1 | Falsetto | 10 | 59 | 48 | 11 | Unstable Chest | - | - | ||
| CL34ds3 | Breathy Falsetto | 10 | 59 | 49 | 10 | Unstable Chest | - | - | ||
| CL40fs1 | Falsetto | 4 | 29 | 24 | 5 | Chest | 27 | 43 | 48 | −5 |
| CL41cs1 | Falsetto | 6 | 33 | 25 | 8 | Unstable Chest | - | - | ||
| Mean | 6 | 49 | 41 | 8 | 22 | 51 | 54 | −3 | ||
| SD | 2.8 | 11.9 | 10.4 | 7.8 | 5.8 | 4.5 |
DISCUSSION
During a pressure-flow sweep, an excised larynx may experience an abrupt frequency change that is accompanied by aerodynamic and acoustic effects. We found that at relatively low levels of adduction (not highly abducted, however) and elongation, a pressure-flow sweep may result in such a frequency shift. A change in the oscillation frequency, which may or may not be accompanied by a change in register (chest or falsetto), causes some discontinuity in the glottal parameters or their slopes. Discontinuities were observed in the mean subglottal pressure, flow rate, fundamental frequency, subglottal pressure amplitude, EGG amplitude, and sound intensity. The most dramatic changes were between two extreme conditions of phonation, namely those perceptually identified as chest and falsetto. The frequency changes were substantial, ranging from 26 to 254 Hz. At times, the change in frequency was more than an octave.
Despite the lack of a vocal fold ligament and laryngeal muscle activity, an excised canine larynx demonstrates the capability of producing register shifts by the process of pressure-flow sweeps, where flow is increased while adduction and vocal fold length (or glottal length) are held constant. As indicated by Berry et al. (1996), the different oscillating modes may coexist for certain adduction or elongation values in the excised larynx. Use of mechanical adduction prongs and arytenoid adduction sutures appears to be sufficient to put the vocal folds in suitable positions such that a change in aerodynamic conditions causes the larynx to produce a register transition. The stroboscopic superior view of the oscillating vocal folds shows large changes in the glottal shape and angle during each sweep, although this report does not include details of those observations. It is possible that during a sweep, the distribution of the vibratory vocal folds mass changes, making a register transition possible. During the pressure-flow sweep, the manual and gradual increase in flow and pressure causes a sudden substantial increase in the amount of tissue involved in vibration and increased degree of glottal closure. The increased vibratory mass is thought to be the primary cause of the decrease in the Fo of vibration. It also increases laryngeal flow resistance, resulting in an increased Ps and decreased flow. Since the physics governing the mode change and laryngeal behavior are not yet well understood, this explanation may be one of the possible mechanisms.
The findings of this work are consistent with those of Berry et al. (1996) where they applied pressure sweeps to five excised larynges in symmetric and asymmetric conditions of adduction and elongation. They used bifurcation diagrams and acoustic spectrograms to identify regions of phonation instabilities. Similarly, the current study shows that continuous changes in pressure and flow resulted in bifurcations, but also includes the aerodynamic aspects of the problem. It is hypothesized that the bifurcation was due to the nonlinear behavior of the larynx, both from tissue mechanics and aerodynamics. One bifurcation is the interaction between the aerodynamic power and tissue vibration as seen at phonation threshold pressure, when the vibration changes from no vibration to some vibration. Another bifurcation is seen at the point in the pressure-flow sweep when Fo changes abruptly. This bifurcation in mode of vibration (characterized by a frequency and timbral change) was not seen in all cases, however. In some cases (in which the vocal folds were greatly elongated) the phonation remained falsetto-like during the entire PFS. In other cases, the phonation varied in terms of stability but remained in chest register.
Of the three continuous changes of parameters, namely pressure-flow sweep (PFS), adduction sweep, and elongation sweep, the PFS was the best mechanism for triggering a frequency jump, whether it was within the same register or was a transition from one register to another. This fact may be related to a strong interdependence of pressure and frequency. In their study of pressure-frequency relations, Alipour and Scherer (2007) showed that the pressure-frequency relation is highly nonlinear and dependent upon adduction and elongation. The changes in frequency due to pressure were shown to be about 2.9 Hz/cm H2O for lower frequencies and 8.2 Hz/cm H2O for the higher frequencies. This might be related to the change in the cross-sectional area of the oscillating vocal folds from lower frequencies to higher frequencies. For the lower frequencies, the larger cross sectional area makes the changes of frequency less sensitive to pressure than for the higher frequencies with smaller cross sectional area. This may translate into the fact that chest voice is accompanied by wider vocal folds and falsetto voice is accompanied by narrower vocal folds.
Besides the vocal ligament and TA muscle activity which are assumed necessary for the register transition, subglottal and supraglottal ducts are also considered major influential factors (Titze, 1988). The excised larynx exhibited pitch jumps and register transitions without TA muscle activity or a vocal ligament. Since the excised larynx model most often lacks the supraglottal duct, the subglottal system may have been responsible for the register transitions. Using a self-oscillating physical model, Zhang et al. (2006) showed that the length of subglottal tubing has a major effect on the oscillation onset and sound intensity due to subglottal resonance characteristics. In the current study, a set of straws were placed in the subglottal tube six inches below the larynx, which smoothed the airflow to the larynx from a 48-inch (one inch diameter) subglottal tube (providing a relatively low first resonance). The resonance characteristics of this tube could have enhanced the acoustic coupling with the lower frequency modes that are in that range. In Figures 10 and 11, the top graphs show the frequency partials of the subglottal system which may have been influenced by the subglottal resonance or its harmonics (Zhang et al, 2006).
CONCLUSIONS
The main findings of this study (a) confirm previous findings that the canine larynx is able to produce falsetto and chest phonation despite the absence of a vocal ligament; (b) in the passive larynx, a frequency change can be obtained by a small change in pressure-flow without any change in adduction or elongation, indicating the significant role of breath management in pitch and register control; (c) the mode change is accompanied by a substantial (often more than an octave) change in Fo, probably due to the change in the mass of the tissue involved in the vibration; and (d) these mode changes can happen in the absence of a vocal tract.
Whenever changes in glottal conditions cause a register transition, changes in phonation quality can be observed in the acoustic spectra of both the subglottal pressure and microphone signals. The quality of phonation was influenced not only by the number of harmonics, but on the relative strength of the partials. However, this study was not intended to identify the causes of mode changes; future work is needed for that.
Acknowledgments
National Institute on Deafness and other Communication Disorders, Grant No DC03566 supported this work. The authors would like to thank Sanyukta Jaiswal and Jaclyn Curiel for their assistance in data collection and Dr. David Berry and two anonymous reviewers for their helpful comments.
References
- Alipour F, Scherer RC. On pressure-frequency relations in the excised larynx. J Acoust Soc Am. 2007;122(4):2296–2305. doi: 10.1121/1.2772230. [DOI] [PubMed] [Google Scholar]
- Berry DA, Herzel H, Titze IR, Story BH. Bifurcations in excised larynx experiments. Journal of Voice. 1996;10(2):129–138. doi: 10.1016/s0892-1997(96)80039-7. [DOI] [PubMed] [Google Scholar]
- Childers DG, Hicks DM, Moore GP, Alsaka YA. A model for vocal fold vibratory motion, contact area, and the electroglottogram. J Acoust Soc Am. 1986;80(5):1309–1320. doi: 10.1121/1.394382. [DOI] [PubMed] [Google Scholar]
- Colton RH. Spectral characteristics of the chest and falsetto registers. Folia Phoniatrica. 1972;24:337–344. doi: 10.1159/000263588. [DOI] [PubMed] [Google Scholar]
- Colton RH. Some acoustic parameters related to the perception of chest-falsetto voice quality. Folia Phoniatrica. 1973;25:302–311. doi: 10.1159/000263714. [DOI] [PubMed] [Google Scholar]
- Hirano M, Vennard W, Ohala J. Regulation of register, pitch and intensity of voice. An electromyographic investigation of intrinsic laryngeal muscles Folia. Phoniatrica. 1970;22(1):1–20. doi: 10.1159/000263363. [DOI] [PubMed] [Google Scholar]
- Hollien H. On vocal registers. Journal of Phonetics. 1974;2:125–143. [Google Scholar]
- Scherer RC, Druker DG, Titze IR. Electroglottography and direct measurement of vocal fold contact area. In: Fujimura O, editor. Vocal Physiology: Voice Production, Mechanisms, and Function. Raven Press, Ltd.; New York: 1988. pp. 279–291. [Google Scholar]
- Sundberg J, Hogset C. Voice source differences between falsetto and modal registers in counter tenors, tenors and baritones. Logopedics, Phoniatrics, Vocology. 2001;26(1):26–36. [PubMed] [Google Scholar]
- Svec JG, Schutte HK, Miller DG. On pitch jumps between chest and falsetto registers in voice: Data from living and excised human larynges. J Acoust Soc Am. 1999;106:1523–1531. doi: 10.1121/1.427149. [DOI] [PubMed] [Google Scholar]
- Titze IR. A framework for the study of vocal registers. Journal of Voice. 1988;2(3):183–194. [Google Scholar]
- Titze IR. Principles of Voice Production. Englewood Cliffs: Prentice-Hall; 1994. [Google Scholar]
- Tokuda IT, Horacek J, Svec JG, Herzel H. Comparison of biomechanical modeling of register transitions and voice instabilities with excised larynx experiments. J Acoust Soc Am. 2007;122:519–531. doi: 10.1121/1.2741210. [DOI] [PubMed] [Google Scholar]
- Van den Berg J, Tan TS. Results of experiments with human larynxes. Pract Oto-rhino-laryng. 1959;21:425–450. doi: 10.1159/000274240. [DOI] [PubMed] [Google Scholar]
- Van den Berg J. Vocal ligaments versus registers. Curr Probl Phoniat Logoped (Karger, Basel/New York) 1960;1:19–34. [Google Scholar]
- Vilkman E, Alku P, Laukkanen AM. Vocal-fold collision mass as a differentiator between registers in the low-pitch range. Journal of Voice. 1995;9(1):66–73. doi: 10.1016/s0892-1997(05)80224-3. [DOI] [PubMed] [Google Scholar]
- Zhang Z, Neubauer J, Berry DA. The influence of subglottal acoustics on laboratory models of phonation. J Acoust Soc Am. 2006;120:1558–1569. doi: 10.1121/1.2225682. [DOI] [PubMed] [Google Scholar]


