

Abstract
Knowledge of estrogen receptor (ER) and progesterone receptor (PR) status has been critical in the evolution of modern targeted therapy of breast cancer and remains essential for making informed therapeutic decisions. Recently, growth factor receptor HER2/neu (ERBB2) status has made it possible to provide another form of targeted therapy linked to the overexpression of this protein. Presently, pathologists determine the receptor status in formalin-fixed, paraffin-embedded sections using subjective, semiquantitative immunohistochemistry (IHC) assays and quantitative fluorescence in situ hybridization for HER2. We developed a single-tube multiplex TaqMan (mERPR+HER2) assay to quantitate mRNA levels of ER, PR, HER2, and two housekeeping genes for breast cancer formalin-fixed, paraffin-embedded sections. Using data from the discovery sample sets, we evaluated IHC-status-dependent cutoff-point and IHC-status-independent clustering methods for the classification of receptor status and then validated these results with independent sample sets. Compared with IHC-status, the accuracies of the mERPR+HER2 assay with the cutoff-point classification method were 0.98 (95% CI: 0.97−1.00), 0.92 (95% CI: 0.88−0.95), and 0.97 (95% CI: 0.95−0.99) for ER, PR, and HER2, respectively, for the validation sets. Furthermore, the areas under the receiver operating-characteristic curves were 0.997 (95% CI: 0.994−1.000), 0.967 (95% CI: 0.949−0.985), and 0.968 (95% CI: 0.915−1.000) for ER, PR, and HER2, respectively. This multiplex assay provides a sensitive and reliable method to quantitate hormonal and growth factor receptors.
There has been considerable progress in the targeted therapy of breast cancer in the past few decades. Such progress has depended to a substantial degree on determining the levels of the estrogen receptor (ER), encoded by the ESR1 gene, and progesterone receptor (PR), encoded by the PGR gene, in breast cancer cells.1,2,3,4,5,6,7,8 More recently, it has been possible to use overexpression of human epidermal growth receptor type 2 gene (ERBB2 also known as HER2/neu) to guide yet another form of targeted therapy according to the specific features of individual patients with breast cancer.9,10,11 Indeed, tumor overexpression of HER2 has been used to select women for therapy with trastuzumab, a recombinant monoclonal antibody against this protein. Moreover, high HER2 expression may be associated with high risk of recurrence in women receiving an aromatase inhibitor or tamoxifen as adjuvant therapy.8
It is worth briefly examining tamoxifen and how this agent has shaped modern breast cancer therapy for early and advanced disease. Tamoxifen is one of the oldest and arguably best studied targeted therapies in medical oncology. ER is essentially the only known therapeutic target for tamoxifen. Thus, in the crucial setting of adjuvant therapy for early breast cancer, tamoxifen has been shown to provide clear benefit both in terms of recurrence-free survival and overall survival.2 More recent trials have also shown very important benefits regarding the use of aromatase inhibitors in adjuvant therapy for postmenopausal women with endocrine-responsive early breast cancer, particularly with respect to better disease-free survival compared with tamoxifen (but not as yet for overall survival).4,5,12 Thus, ER and PR status in malignant tissue from women with operable, invasive breast cancer provides critically important classification of outcome and clinical benefit for adjuvant endocrine or chemoendocrine therapies.
The status of ER-regulated PR has been reported to improve outcome prediction over ER status alone.13,14 In Caucasians, approximately 60% to 65% of breast cancer cases are ER-positive and PR-positive (ER+/PR+), 15 to 20% are ER+/PR-negative (PR−), 15% to 20% are ER−/PR−, and <5% are ER− /PR+.15 The response rate to tamoxifen treatment has been reported to be markedly decreased in patients with ER+/PR− breast tumors.16,17,18
Starting in the mid 1970s, the levels of ER or PR in fresh or frozen breast tissue specimens was determined by quantitative, but technically challenging, radioactive, biochemical ligand-binding assays using dextran-coated charcoal.19 Almost two decades later, the development of monoclonal antibodies and the semiquantitative immunohistochemical (IHC) method allowed the measurement of ER and PR expression in frozen tissue or formalin-fixed, paraffin-embedded (FFPE) tissue sections.20 Gradually the IHC method became the method of choice as receptor expression could be related to morphology,21 and it was demonstrated that the prediction of endocrine therapy response was equivalent to the ligand-binding assay method.22 The status of hormonal receptors detected by the IHC method can be affected by many factors, such as fixation, antigen retrieval, antibody type, and subjective evaluation criteria. A variety of tools have been developed to improve the performance of IHC testing for ER and PR, including methods for both manual and image-based scoring of staining results. One example is a semiquantitative IHC interpretation system, the Allred score, developed to grade immunostained slides based on the percentage and intensity of positively stained tumor cells.23 However, this approach remains subjective, semiquantitative, and can be labor intensive. Many groups reported poor interlaboratory reproducibility and reliability for testing of hormonal receptors6,24,25 and growth factor receptor HER2 (ERBB2).26,27 Several reports and editorials have discussed the importance of accuracy and reproducibility of receptor testing methods for managing treatment of breast cancer patients.28,29,30,31 The American Society of Clinical Oncology (ASCO) 2007 Guideline Update Committee acknowledged that there are “deficits in standardization for ER and PR assays (in particular, IHC), and further efforts at defining reproducibility and accuracy for particular reagents are an important priority.”32 In addition, new guideline recommendations for growth factor receptor HER2 (ERBB2) testing were recently published by ASCO and the College of American Pathologists.33
Since the late 1990s, many groups have developed molecular assays such as gel-based, semiquantitative reverse transcription (RT)-PCR assays,34,35,36,37,38 while others have developed quantitative assays using real-time RT-PCR and nucleic acid sequence-based amplification technologies39,40,41,42 to measure the mRNA level of ER or PR in frozen breast biopsy tissue samples, and compared their results to those of the ligand-binding assay or IHC method. However, only two groups have developed TaqMan RT-PCR assays to quantitate ER, PR, or HER2 mRNA level individually in archived FFPE specimens.43,44 All groups have reported good concordance between mRNA level and protein level for ER or PR. Moreover, several groups developed quantitative PCR assays for HER2 DNA amplification and RT-PCR for overexpression of HER2 mRNA in frozen or FFPE breast tumor specimens.45,46,48,49,50,51,52
In the present study, we report the development and the performance of a single-tube, one-step, multiplex TaqMan RT-PCR assay (mERPR+HER2) to detect ER, PR, and HER2 mRNA levels in breast cancer FFPE specimens using two Real-Time PCR instrument platforms. In addition, we also report the concordance between hormonal receptor and growth factor receptor status determined by the IHC assay and the results of the mERPR+HER2 assay classified with two different methods using two independent sample sets.
Materials and Methods
Study Subjects
Three sets of FFPE breast tumor sections were used to develop the RT-PCR assay for ER, PR, and HER2. Two contemporary sets (sample set 1 and sample set 2) were provided by Laboratory Corporation of America (LabCorp), and a third set of archived FFPE breast tumor samples (sample set 3) was provided by Guy's and St. Thomas' Tissue and Data bank (London, United Kingdom). The cohort of 291 subjects was diagnosed between 1975 and 2001 with tumor size <3 cm, lymph node negative and ER+ primary breast tumors, and the use of this cohort was approved by Guy's Research Ethics Committee (04/Q0704/137). The use of these three sample sets for the development of classification methods of hormonal and growth factor receptors, and the number of samples with IHC Allred scores for each sample set are listed in Table 1.
Table 1.
Description of Sample Sets
| Sample Set | Subject No. | Discovery | Validation |
|---|---|---|---|
| Set 1* | 67 | ER, PR | |
| Set 2 | 55 | HER2 | ER, PR† |
| Set 3 | 291 | ER, PR, HER2‡ |
HER2 IHC status was not available.
ER and PR IHC Allred scores were available for 42 of 55 samples.
ER, PR, and HER2 IHC Allred scores were available for 291, 279, and 272 of 291 samples, respectively. A total of 400, 388, and 327 samples with ER, PR, and HER2 IHC status, respectively, were used for data analyses.
IHC Assays
Hormonal Receptors
For the IHC assay performed at LabCorp, the FFPE tissue specimens were mounted on SuperFrost Plus slides (Fisher Scientific, Hampton, NH) and dried for 30 minutes in a 60°C slide drier. An H&E-stained section was prepared for each specimen and evaluated for the presence of tumor cells. The FFPE slides were processed on the BenchMark XT Autostainer (Ventana Medical Systems, Tucson, AZ). The primary monoclonal antibodies used to detect ER and PR were anti-estrogen receptor clone 6F11 and anti-progesterone clone 16 (Ventana Medical Systems), respectively. The sequence of primary staining events on the automated stainer included: incubations with primary antibodies; application of a biotinylated secondary antibody; binding of avidin-biotin-horseradish peroxidase complex; and detection with diaminobenzidine chromagen. After staining, the slides were counterstained and evaluated by a pathologist for hormone receptor status, which involved evaluation of at least 200 tumor cells to determine the percentage of stained cells, as well as the intensity of staining.
Guy's and St. Thomas' Tissue and Data Bank specimens were collected between 1975 and 2001, therefore the hormonal receptor status was re-evaluated with contemporary IHC assays. Each FFPE block was cut in the following sequence: one section for H&E staining, six unstained sections on charged slides for IHC, a second section for H&E staining followed by five 10-μm sections on charged glass slides. All section cutting was performed in RNase-free conditions. On the second H&E-stained slide, areas with tumor were marked on the coverslip, and this guide slide was sent with the 10-μm sections to facilitate macrodissection of tumor areas for RNA extraction. To standardize ER or PR status assessment, all cases were re-evaluated. The anti-ERα antibody SP-1 and anti-progesterone receptor PgR636 were used in a conventional IHC protocol for ER and PR status, respectively. Briefly, sections were pre-treated by pressure cooking in citrate buffer pH6 before incubating with SP-1 or PgR636. Sites of antigen-antibody binding were detected using the Dako REAL Envision system. This set of specimens was also used for the discovery of a prognostic signature for distant metastasis; therefore ER, PR, and HER2 status were re-evaluated independently by two pathologists.53 Any discrepant scores were then assessed jointly and a final score agreed on.
Allred total scores (TS) based on the percentage and staining intensity of tumor cells were recorded for all three sets of specimens.23 The distributions of Allred percentage of tumor cells, intensity scores, and total scores for both ER and PR in the three sample sets are listed in supplemental Tables S1, S2, and S3, at http://jmd.amjpathol.org.
Growth Factor Receptor HER2
HercepTest reagents (Dako, Carpinteria, CA) with Dako Autostainer and with Biogenex i6000 autostainer (San Ramon, CA) were used for sample set 2 and sample set 3, respectively. Sample set 2 was scored according to the criteria with cell membrane staining indicated as 3+ (strong, complete membrane staining in >10% of tumor cells), 2+ (weak to moderate, complete membrane staining in >10% of the tumor cells), 1+ (faint membrane staining that involves only a portion of the membrane, in >10% of tumor cells), or 0 (no staining observed, or faint staining in <10% of the tumor cells). For sample set 3, HER2 IHC was scored according to the new ASCO-CAP guidelines.33
RNA Extraction from FFPE Sections
All FFPE section slides used for this study were 4- or 10-μm thick with ∼60% to 80% breast tumor cells. The FFPE section slides were deparaffinized by soaking them in xylene for 10 minutes with occasional agitation and repeated with fresh xylene. The slides were then washed consecutively with 100% ethanol, 90% ethanol, and 70% ethanol with 2 minutes for each wash. The slides were then air dried at room temperature for 5 minutes. Fifteen microliters of Proteinase K digestion solution [2 mg/ml Proteinase K (Ambion, Austin, TX), 0.1 mol/L NaCl, 10 mmol/L Tris pH 8.0, 1 mmol/L EDTA, and 0.5% SDS], was applied to the dried tissue on the slide. The tissue was then scraped with a sterile surgical blade and transferred into a 1.5-ml tube containing 185 μl Proteinase K digestion solution, and incubated overnight at 55°C for 18 to 24 hours. After incubation, the samples were spun at 14,000 rpm for 5 minutes, and the supernatant was transferred to a new tube. A mixture of 600 μl of 100% ethanol and 400 μl of extraction buffer (5 mol/L guanidium thiocyanate, 31.25 mmol/L Na Citrate, pH 7.0, 0.625% Sarcosyl, and 0.125 mol/L β-mercaptoethanol) was added to the supernatant of each sample, loaded into Zymo-Spin II Columns (Zymo Research, Orange, CA), spun at 12,000 rpm for one minute, and repeated until the entire sample had been spun through the column. The column was washed once with 200 μl of wash buffer (80% ethanol in 10 mmol/L Tris-HCl and 0.1 mmol/L EDTA, pH 8.0), followed by 13.5 Kunitz units DNase (QIAGEN, Valencia, CA) treatment at room temperature for 30 minutes. The columns were washed with 200 μl wash buffer twice and then dried by centrifugation for 2 minutes at 12,000 rpm. The total RNA was then eluted twice with 50 μl of Tris-EDTA buffer that had been heated to 65°C.
The amount of PCR-amplifiable RNA was quantitated by one-step RT-PCR using primers for the housekeeping (HSK) gene, NUP214, and compared with a serially diluted control, Universal Human Reference RNA (Stratagene, La Jolla, CA). The recovery of amplifiable RNA depends on the age of the FFPE specimen and RNA extraction methods. The recovery of amplifiable RNA from one 4-μm breast cancer FFPE section ranges from 0.5 ng to 25 ng.
A New Approach for Determining Normalization Factor
The top two most stable HSK genes, PPIG and NUP214, were previously determined by the profiling of 138 breast cancer FFPE samples,53 and they were used to validate the novel approach of determining the normalization factor for RNA amount in each RT-PCR reaction. Fifty-eight human total RNA samples (see supplemental Table S4 at http://jmd.amjpathol.org) from various tissue types were used to demonstrate the feasibility of using two TaqMan probes labeled with identical fluorescent reporter dye (see supplemental Table S5 at http://jmd.amjpathol.org) to determine the normalization factor of total RNA input amount in each sample. The concentration of each RNA sample was determined using RiboGreen quantitation assay (Invitrogen, Carlsbad, CA), and 20 ng of total RNA was used for each reaction. The expression levels of two HSK genes, NUP214 or PPIG, were quantitated in independent simplex reactions using either NUP214 probe or PPIG probe labeled with the same fluorescent reporter dye using the 7900 Real-Time PCR System (7900 system; Applied Biosystems, Foster City, CA). The average of NUP214 and PPIG expression levels was then compared with the composite NUP214 and PPIG expression level quantitated using both NUP214 and PPIG TaqMan probes in a single reaction.
Single-Tube, One-Step, Multiplex TaqMan Assays
mERPR+HER2 RT-PCR Assay on the 7500 System
Table 2 lists gene IDs, gene symbols, the oligonucleotide sequences of PCR primers, the accession numbers of RefSeq and GenBank in National Center for Biotechnology Information of known splice variants amplified by the designed PCR primers for ESR1, PGR, ERBB2 (HER2), and the two HSK genes, NUP214 and PPIG, and the oligonucleotide sequences and fluorescent reporters of all TaqMan probes for the 7500 Real-Time PCR System (7500 system; Applied Biosystems, Foster City, CA).
Table 2.
Genes and Information of RT-PCR Primers and TaqMan Probes in the mERPR+HER2 Assay for the 7500 System
| Gene ID | Gene symbol | Forward primer sequence | Reverse primer sequence | Reporter | Probe sequence∥ |
|---|---|---|---|---|---|
| 2099 | ESR1* | 5′-TCTGCAGGGAGAGGAGTTT-3′ | 5′-GGTCCTTCTCTTCCAGAGACTT-3′ | FAM | 5′-TGTGCCTCAAATCTA-3′ |
| 5241 | PGR* | 5′-TCGAGTCATTACCTCAGAAGAT-3′ | 5′-CCCACAGGTAAGGACACCATA-3′ | TRE§ | 5′-TGACAGCCTGATGCTTCAT-3′ |
| 2064 | ERBB2† | 5′-CAGCCCTGGTCACCTACAA-3′ | 5′-GGGACAGGCAGTCACACA-3′ | PHO§ | 5′-TGAGTCCATGCCCAATCC-3′ |
| 8021 | NUP214‡ | 5′-CATTTGCTTTATAAAAGACCACTG-3′ | 5′-CCACTCCAAGTCTAGAACATCA-3′ | VIC | 5′-TCAGGAAATTCGGCGCCTT-3′ |
| 9360 | PPIG‡ | 5′-GCCAACAGAGGGAAGGATA-3′ | 5′-GAGGAGTTGGTTTCGTTGTTA-3′ | VIC | 5′-ATGGTTCACAGTTCTTC-3′ |
ESR1 and PGR have at least four alternative splice variants. NM_000125, AF258449, AF258450, and AF258451 are the accession numbers of the variants for ESR1. NM_000926, AB085683, AB085844, and AB085845, are the accession numbers of the variants for PGR.
NM_004448 and NM_001005862 are the annotated accession numbers of the variants for ERBB2.
NM_005085 and NM_004792 are the accession numbers of the variants for NUP214 and PPIG, respectively. For each of these genes, RT-PCR primers were designed to amplify a region shared by all listed splice variants. The amplicon sizes are 104-bp, 80-bp, 95-bp, 123-bp, and 61-bp, for ESR1, PGR, ERBB2, NUP214, and PPIG, respectively.
TRE and PHO labeled probes were provided by Applied Biosystems.
All five TaqMan probes have minor-groove binder and non-fluorescent quencher at 3′ termini.
Quantitative detection of mRNA levels of ESR1, PGR, ERBB2 (HER2), and two HSK genes in a single tube was accomplished through one-step, five-plex TaqMan RT-PCR assay. Each reaction contained 50 mmol/L of Tricine, 115 mmol/L KOAc (pH 8.0), 4.5 mmol/L Mn(OAc)2, 7.4% glycerol, 400 μmol/L dATP, 400 μmol/L dGTP, 400 μmol/L dCTP, 800 μmol/L dUTP, 1% dimethyl sulfoxide, 50 nmol/L NPR (provided by Applied Biosystems) in 5% Tween-20, 0.12 μmol/L enhancer (Abbott, Abbott Park, IL), 0.08 unit/μL uracil N-glycosylase, 0.4 unit/μL Z05 DNA polymerase (Abbott), 500 nmol/L of each primer (Applied Biosystems), 250 nmol/L of each TaqMan probe (Applied Biosystems), and approximately 0.2 to 1 ng of amplifiable RNA extracted from the FFPE specimen. TRE and PHO labeled TaqMan probes were provided by Applied Biosystems, (United States Patents 6080852, 5847162, 6025505, and 6017712). The thermocycling parameters were as follows: 50°C for 2 minutes; 95°C for 1 minute; 60°C for 30 minutes; 95°C for 15 seconds and 58°C for 35 seconds for 42 cycles for the 7500 system. In addition to each RNA sample from the FFPE specimen, 25 ng of the Universal Human Reference RNA was included as the control in each amplification plate, and all samples were run in duplicate reactions.
mERPR RT-PCR Assay on the 7900 System
A single-tube multiplex TaqMan assay for ER, PR, and two HSKs (mERPR assay) was developed for the 7900 system. The mERPR+HER2 assay for the 7900 system was not developed due to the unavailability of a compatible florescent dye for HER2 for the optical system on the 7900 system. The supplemental Table S5 at http://jmd.amjpathol.org lists the oligonucleotide sequences, orientations, fluorescent reporters, and quenchers of all TaqMan probes for the 7900 system.
Quantitative detection of mRNA levels of ER, PR, and two HSK genes in a single tube was also accomplished through one-step multiplex TaqMan RT-PCR with a 384-well plate using the 7900 system. Each 15-μl reaction contained 50 mmol/L of Tricine, 115 mmol/L KOAc (pH 8.0), 4.5 mmol/L Mn(OAc)2, 9.6% glycerol, 400 μmol/L dATP, 400 μmol/L dGTP, 400 μmol/L dCTP, 800 μmol/L dUTP, 1% dimethyl sulfoxide, 0.3 μmol/L 6-ROX (Invitrogen, Carlsbad, CA) in 5% Tween-20, 0.12 μmol/L enhancer (Abbott), 0.08 unit/μL uracil N-glycosylase, 0.4 unit/μL Z05 DNA polymerase (Abbott), 500 nmol/L of each primer, 200 nmol/L TET-labeled (or NED-labeled) TaqMan probes for each HSK gene, 250 nmol/L FAM-labeled TaqMan probe for ER, 250 nmol/L VIC-labeled TaqMan probe for PR, and approximately 0.5 to 1 ng of amplifiable RNA extracted from FFPE specimen. The thermocycling parameters for the 7900 system are as follows: 50°C for 2 minutes; 95°C for 1 minute; 60°C for 30 minutes; 95°C for 15 seconds and 58°C for 30 seconds for 42 cycles. In addition to each RNA sample from FFPE specimens, 25 ng of the Universal Human Reference RNA (Stratagene) was included as the control in each amplification plate. All samples on the plate were run in duplicate. The results from the 7900 system are described in Supplemental Tables S6 to S10 and Figures S1A, S1B, S2A, and S2B at http://jmd.amjpathol.org.
FFPE Section-to-Section Reproducibility
To determine FFPE section-to-section reproducibility, five sequential sections from each of 10 breast cancer tumor FFPE samples (BioChain Institute, Hayward, CA) were obtained. Before RNA was isolated, the slide was checked to ensure that all sections from each sample were identical in size and shape. Total RNA was extracted from these 50 sections and the recovery was determined using NanoDrop (Thermo Scientific, Wilmington, DE). The amplifiable RNA was determined by a TaqMan RT-PCR assay for the HSK gene, NUP214. ER, PR, and HER2 mRNA levels in each section were determined using the mERPR+HER2 assay.
Data Analysis
The ER, PR, and HER2 mRNA expression levels in each FFPE clinical sample were calculated using the ΔΔCT method.54 First, the average CT (cycle threshold) of duplicate reactions of each gene of interest was calculated for each sample and the control sample, Universal Human Reference RNA. Then the ER, PR, and HER2 mRNA expression levels were normalized with the HSK gene expression level for each FFPE and the control sample. Finally the HSK-normalized ER, PR, and HER2 expression levels in each FFPE sample were further compared with the HSK-normalized ER, PR, and HER2 expression levels in the control sample, respectively. Therefore, the relative expression level of each gene of interest in each FFPE sample, is presented as ΔΔCT = (−1) × [ΔCT sample (CT of gene of interest − CT of HSK genes) − ΔCT control (CT of gene of interest − CT of HSK genes)]. A minus one factor is included to graphically illustrate higher expression above lower expression. When CT value was not reported, then a CT of 42 was used for the calculation of ΔΔCT.
Statistical Analysis
For ER and PR classification, the results of the mERPR+HER2 assay from sample set 1 and combined sample sets 2 and 3 were used as the discovery and validation sets, respectively. For HER2 classification, the results of the mERPR+HER2 assay from sample sets 2 and 3 were used as the discovery and validation sets, respectively.
Area under the receiver operating characteristic curve (AUC) measures the ability of the assay to discriminate between positive and negative status of ER, PR, or normal- and over-expression status of HER2 across the entire range of ΔΔCT values. AUC was computed based on the receiver operating characteristic function available from the Mayo Clinic (http://mayoresearch.mayo.edu/mayo/research/biostat/splusfunctions.cfm) and confidence intervals (CI) for the AUC were calculated using the variance estimate described by Delong et al.55
We used two different methods to classify the status of ER, PR, and HER2. An IHC-status-dependent ΔΔCT cutoff-point method was used to determine the hormonal and growth factor receptor status. Using IHC status as the gold standard, an Allred score ≥3 defines positive hormonal status (ER+ or PR+),23 and an intensity score of HER2 3+ defines HER2 overexpression.33 The ΔΔCT cutoff point for classification of each marker was empirically selected based on the diagnostic metrics of sensitivity, specificity, positive predictive value, negative predictive value, and accuracy from the comparisons with IHC status using various ΔΔCT cutoff points. A ΔΔCT cutoff point for classification of each marker was selected using the data from their respective discovery sets. The selected ΔΔCT cutoff points were then applied to classify ER, PR and HER2 status of samples in their respective validation sets.
An IHC-status-independent classification method was established by developing Gaussian mixture models as implemented in MCLUST software for the R programming language (http://www.R-project.org)56 based solely on ER ΔΔCT, PR ΔΔCT, and HER2 ΔΔCT measurements of subjects in their respective discovery sets.57,58,59,60,61 The Bayesian Information Criterion was used to determine the best fitting model. For ER and HER2 measures, the best model was a mixture of two Gaussian distributions with equal variance. For PR, since the best model by Bayesian Information Criterion was a single Gaussian distribution, which would not be helpful for classification purposes, a mixture model of two Gaussian distributions with equal variance was used. The mixture models estimated from the discovery data were then used to classify an independent set of validation subjects to the cluster for which they had the highest probability of membership based on their ΔΔCT measurements.
The diagnostic metrics of sensitivity, specificity, positive predictive value, negative predictive value, and accuracy were calculated for both discovery and validation sets. The agreement coefficient, Cohen's kappa,62 was used to evaluate the agreement between the IHC status and the status determined using the results from the mERPR+HER2 assay for the ΔΔCT cutoff-point and clustering methods. In addition, the square of Pearson's correlation coefficient was used to assess the degree of correlation between two instrument platforms.
Results
A New Approach for Determination of Normalization Factor
To obtain more accurate normalization of RNA input amount and to accommodate three genes of interest, ESR1, PGR, and ERBB2, in a multiplex TaqMan assay with four different fluorescent reporters, we designed a novel approach of determining the expression levels of two HSK genes using two TaqMan probes labeled with the same fluorescent reporter.
Two HSK genes, NUP214 and PPIG, expressed at relatively constant levels in breast tumor FFPE specimens were selected to validate our approach. mRNA levels of NUP214 and PPIG were averaged from independent reactions with NUP214 or PPIG probes, and compared with the NUP214 and PPIG composite mRNA level in a single co-amplification reaction. The comparison of 58 total RNA samples from various tissues using two amplification formats is shown in Figure 1. The two different formats of determining HSK gene expression levels correlated well with a correlation coefficient, r2, of 0.9742 (P < 0.0001).
Figure 1.

Correlation of housekeeping gene normalization determined using two different amplification formats. The correlation coefficient, r2, between the expression levels of housekeeping genes using two different formats was 0.9742.
FFPE Section-to-Section Reproducibility
Total RNA and amplifiable RNA from each of five sequential sections of 10 breast cancer tumor FFPE samples were determined by absorbance at 260 nm and the TaqMan RT-PCR assay for the housekeeping gene NUP214. The recoveries of amplifiable RNA from each of 5 sections of 10 FFPE samples are shown in Figure 2. The average percentage of the amplifiable RNA relative to the total RNA measured by absorbance at 260 nmol/L of each sample is shown above each bar. The average amplifiable RNA from 10 FFPE samples varied from 70 ng (S4) to 1300 ng (S1). Figure 3 illustrates the distributions of ER, PR, and HER2 ΔΔCT values from 5 sections of 10 FFPE samples, respectively. The relatively larger variations of the PR ΔΔCT values in samples S2, S4, and S8 were due to later CT resulting from lower PR expression levels. There was no correlation between the variation of amplifiable RNA recovery and ER, PR, or HER2 ΔΔCT values.
Figure 2.

RNA recovery of sequential FFPE sections. The distributions of recovered amplified RNA of 5 sequential sections from 10 FFPE breast tumor specimens. The average percentage of amplifiable RNA relative to the total RNA measured by absorbance of each sample is shown above each bar.
Figure 3.

Reproducibility of the status of hormonal and growth factor receptors in sequential FFPE sections. A, B, and C: The ΔΔCT distributions of ER, PR, and HER2, respectively, of 5 sequential sections from 10 FFPE breast tumor specimens.
Classification of Hormonal Receptor Status
Three breast cancer tumor FFPE sample sets with available ER and PR IHC Allred total scores listed in Table 1 were used to determine the classifications of ER and PR status. Sample set 1 with 67 samples, and combined sample sets 2 and 3 with 333 samples were used as the discovery and validation sets, respectively. Both ER mRNA and PR mRNA were detected in all clinical specimens using the mERPR+HER2 assay.
Estrogen Receptor
The ER ΔΔCTvalues of 67 RNA samples of the discovery set using the mERPR+HER2 assay were calculated, and the distribution of ER ΔΔCT values in the discovery set was bimodal, as reported previously.44 The AUC of ER ΔΔCT values from the discovery set was 0.989 (95% CI: 0.972–1.000). The performance measurements of sensitivity, specificity, positive predictive value, negative predictive value, and accuracy for the ER classification based on the IHC ER status were compared using various ΔΔCT cutoff points (Figure 4A). A ΔΔCT cutoff point of 1.5 with 94% accuracy was empirically selected to divide 67 ER ΔΔCT values into two groups in Figure 4B. The distribution of 67 IHC ER Allred total scores and the classifications of ER status by both the IHC-status-dependent ΔΔCT cutoff-point and the IHC-status-independent clustering methods are listed in Table 3. Two Allred TS0 samples and two Allred TS3 samples were classified as ER+ and ER−, respectively, by the ΔΔCT cutoff-point method. All Allred TS0 samples were classified as ER− correctly, and two Allred TS3 samples were classified as ER− by the clustering method. When compared with IHC ER status, the kappa coefficient of the clustering method, 0.924 (95% CI: 0.821–1.000) was higher than that of the ΔΔCT cutoff-point method, 0.842 (95% CI: 0.693−0.992) (Table 4).
Figure 4.

ER classification. A: Performance measurements of classifications based on ER IHC status using various ΔΔCT cutoff points of the discovery sample set. B: Classification of the discovery sample set using the ΔΔCT cutoff point of 1.5. C: Distribution of ER ΔΔCT values with IHC status of the discovery and validation sample sets. PPV: positive predictive value; NPV: negative predictive value.
Table 3.
Classification of ER Status of the Discovery and Validation Sets Using the ΔΔCT Cutoff-Point and Clustering Methods
| Discovery (n = 67) |
Validation (n = 333) |
|||||||||
|---|---|---|---|---|---|---|---|---|---|---|
| ΔΔCTcutoff-point |
Clustering |
ΔΔCTcutoff-point |
Clustering |
|||||||
| Allred TS* | IHC (% of total) | ER+ | ER− | ER+ | ER− | IHC (% of total) | ER+ | ER− | ER+ | ER− |
| 0 | 17 | 2 | 15 | 0 | 17 | 17 | 1 | 16 | 0 | 17 |
| 2 | 0 | 0 | 0 | 0 | 0 | 2 | 0 | 2 | 0 | 2 |
| ER−† | 17 (25%) | 2 | 15 | 0 | 17 | 19 (6%) | 1 | 18 | 0 | 19 |
| 3 | 2 | 0 | 2 | 0 | 2 | 4 | 0 | 4 | 0 | 4 |
| 4 | 0 | 0 | 0 | 0 | 0 | 2 | 2 | 0 | 1 | 1 |
| 5 | 3 | 3 | 0 | 3 | 0 | 6 | 6 | 0 | 4 | 2 |
| 6 | 2 | 2 | 0 | 2 | 0 | 31 | 31 | 0 | 28 | 3 |
| 7 | 12 | 12 | 0 | 12 | 0 | 110 | 110 | 0 | 110 | 0 |
| 8 | 31 | 31 | 0 | 31 | 0 | 161 | 161 | 0 | 160 | 1 |
| ER+‡ | 50 (75%) | 48 | 2 | 48 | 2 | 314 (94%) | 310 | 4 | 303 | 11 |
Allred total score.
Total number of specimens with Allred TS0 and TS2 in each set.
Total number of specimens with Allred TS3 to TS8 in each set.
Table 4.
Summary of the Performance of ER Classification
| Discovery (n = 67) |
Validation (n = 333) |
|||
|---|---|---|---|---|
| ΔΔCT cutoff-point | Clustering | ΔΔCT cutoff-point | Clustering | |
| Sensitivity | 0.96 (0.86−1.00) | 0.96 (0.86−1.00) | 0.99 (0.97−1.00) | 0.96 (0.94−0.98) |
| Specificity | 0.88 (0.64−0.99) | 1.00 (0.80−1.00) | 0.95 (0.74−1.00) | 1.00 (0.82−1.00) |
| PPV | 0.96 (0.86−1.00) | 1.00 (0.93−1.00) | 1.00 (0.98−1.00) | 1.00 (0.99−1.00) |
| NPV | 0.88 (0.64−0.99) | 0.89 (0.67−0.99) | 0.82 (0.60−0.95) | 0.63 (0.44−0.80) |
| Accuracy | 0.94 (0.85−0.98) | 0.97 (0.90−1.00) | 0.98 (0.97−1.00) | 0.97 (0.94−0.98) |
| Kappa | 0.842 (0.693−0.992) | 0.924 (0.821−1.000) | 0.870 (0.758−0.982) | 0.759 (0.623−0.895) |
Both the ΔΔCT cutoff point of 1.5 and the model parameters for the clustering method derived from the discovery set were applied to classify the ER status of samples in the validation set. The validation set consisted of two independent subsets, sample set 2 and sample set 3 listed in Table 1. Forty-two samples with ER IHC Allred scores in sample set 2 and 291 samples with ER IHC Allred scores in sample set 3 were used to validate ER classification. The 291 archived specimens in sample set 3 were originally identified as ER+ between 1975 and 2001. The ER and PR status was re-evaluated in these specimens with contemporary IHC assays, and 8 of 291 samples (3%) were re-classified as IHC ER−. The AUC of ER ΔΔCT values from the validation set was 0.997 (95% CI: 0.994–1.000). The distribution of IHC Allred total scores of the entire 333 samples and the classifications of ER status by both the IHC-status-dependent ΔΔCT cutoff-point and the IHC-status-independent clustering methods of the validation set are listed in Table 3. One Allred TS0 sample and four Allred TS3 samples were classified as ER+ and ER−, respectively, by the ΔΔCT cutoff-point method. All IHC ER− samples were correctly classified as ER− by the clustering method. However, an additional six Allred TS4 to TS6, and one Allred TS8 samples were classified as ER− by the clustering method. When compared with IHC ER status, the kappa coefficient of the clustering method was 0.759 (95% CI: 0.623−0.895), lower than 0.870 (95% CI: 0.758−0.982) of the ΔΔCT cutoff-point method (Table 4).
Progesterone Receptor
The performance measurements of the PR classification of 67 ΔΔCT values based on the IHC PR status were compared using various ΔΔCT cutoff points (Figure 5A). The AUC of PR ΔΔCT values from the discovery set was 0.987 (95% CI: 0.969–1.000). A ΔΔCTcutoff point of 0.5 with 94% accuracy was empirically selected to divide 67 PR ΔΔCT values into two groups in Figure 5B. The distribution of 67 IHC PR Allred total scores and the classifications of PR status by both the IHC-status-dependent ΔΔCT cutoff-point and the IHC-status-independent clustering methods are listed in Table 5. One Allred TS0 sample was classified as PR+ by both the ΔΔCT cutoff-point and clustering methods. One Allred TS3 and two Allred TS5 samples were classified as PR− by the ΔΔCT cutoff-point method, and three additional samples (one Allred TS4, one Allred TS5, and one Allred TS6) were also classified as PR− by the clustering method. When compared with IHC PR status, the kappa coefficients of the ΔΔCT cutoff-point and clustering methods were 0.861 (95% CI: 0.730−0.993) and 0.767 (95% CI: 0.607− 0.928), respectively (Table 6).
Figure 5.
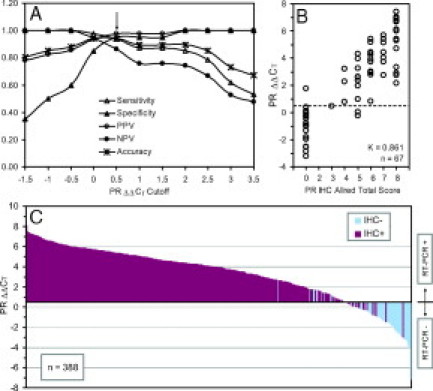
PR classification. A: Performance measurements of classifications based on PR IHC status using various ΔΔCT cutoff points of the discovery sample set. B: Classification of the discovery sample set using the ΔΔCT cutoff point of 0.5. C: Distribution of PR ΔΔCTvalues with IHC status of the discovery and validation sample sets.
Table 5.
Classification of PR Status of the Discovery and Validation Sets Using the ΔΔCT Cutoff-Point and Clustering Methods
| Discovery (n = 67) |
Validation (n = 321) |
|||||||||
|---|---|---|---|---|---|---|---|---|---|---|
| ΔΔCTcutoff-point |
Clustering |
ΔΔCTcutoff-point |
Clustering |
|||||||
| Allred TS* | IHC (% of total) | PR+ | PR− | PR+ | PR− | IHC (% of total) | PR+ | PR− | PR+ | PR− |
| 0 | 20 | 1 | 19 | 1 | 19 | 35 | 11 | 24 | 7 | 28 |
| 2 | 0 | 0 | 0 | 0 | 0 | 9 | 1 | 8 | 1 | 8 |
| PR−† | 20 (30%) | 1 | 19 | 1 | 19 | 44 (14%) | 12 | 32 | 8 | 36 |
| 3 | 1 | 0 | 1 | 0 | 1 | 36 | 24 | 12 | 20 | 16 |
| 4 | 3 | 3 | 0 | 2 | 1 | 28 | 26 | 2 | 26 | 2 |
| 5 | 11 | 9 | 2 | 8 | 3 | 51 | 51 | 0 | 50 | 1 |
| 6 | 11 | 11 | 0 | 10 | 1 | 47 | 47 | 0 | 46 | 1 |
| 7 | 7 | 7 | 0 | 7 | 0 | 58 | 59 | 0 | 58 | 0 |
| 8 | 14 | 14 | 0 | 14 | 0 | 57 | 56 | 0 | 57 | 0 |
| PR+‡ | 47 (70%) | 44 | 3 | 41 | 6 | 277 (86%) | 263 | 14 | 257 | 20 |
Allred total score.
Total number of specimens with Allred TS0 and TS2 in each set.
Total number of specimens with Allred TS3 to TS8 in each set.
Table 6.
Summary of the Performance of PR Classification
| Discovery (n = 67) |
Validation (n = 321) |
|||
|---|---|---|---|---|
| ΔΔCT cutoff-point | Clustering | ΔΔCT cutoff-point | Clustering | |
| Sensitivity | 0.94 (0.82−0.99) | 0.87 (0.74−0.95) | 0.95 (0.92−0.97) | 0.93 (0.89−0.96) |
| Specificity | 0.95 (0.75−1.00) | 0.95 (0.75−1.00) | 0.73 (0.57−0.85) | 0.82 (0.67−0.92) |
| PPV | 0.98 (0.88−1.00) | 0.98 (0.87−1.00) | 0.96 (0.93−0.98) | 0.97 (0.94−0.99) |
| NPV | 0.86 (0.65−0.97) | 0.76 (0.55−0.91) | 0.70 (0.54−0.82) | 0.64 (0.50−0.77) |
| Accuracy | 0.94 (0.85−0.98) | 0.90 (0.80−0.96) | 0.92 (0.88−0.95) | 0.91 (0.88−0.94) |
| Kappa | 0.861 (0.730−0.993) | 0.767 (0.607−0.928) | 0.664 (0.544−0.784) | 0.669 (0.556−0.782) |
Both the ΔΔCT cutoff point of 0.5 and the model parameters for the clustering method derived from the discovery set were applied to classify PR status of samples in the validation set. The validation set also consisted of two independent subsets, sample set 2 and sample set 3 listed in Table 1. Forty-two samples with PR IHC Allred scores and 279 samples with PR IHC Allred scores from sample set 2 and set 3, respectively, were used to validate PR classification. The AUC of PR ΔΔCT values from the validation set was 0.967 (95% CI: 0.949−0.985). The distribution of IHC Allred total scores and the classifications of PR status of 321 validation samples by both the ΔΔCT cutoff-point and the IHC-status-independent clustering methods are listed in Table 5. Twelve (11 Allred TS0 and one Allred TS2) and eight samples (seven Allred TS0 and one Allred TS2) were classified as PR+ by the ΔΔCT cutoff-point method and the clustering method, respectively. Fourteen Allred TS3 and TS4 samples were classified as PR− by the ΔΔCT cutoff-point method, and additional six samples (four Allred TS3, one Allred TS5 and one Allred TS6) were classified as PR− by the clustering method. When compared with IHC PR status, the kappa coefficients of the ΔΔCT cutoff-point and clustering methods were similar but lower than those of the discovery set, 0.664 (95% CI: 0.544−0.784) and 0.669 (95% CI: 0.556−0.782), respectively (Table 6).
Classification of Overexpression of Growth Factor Receptor HER2
The HER2 ΔΔCT values of 55 samples of the HER2 discovery set (sample set 2 in Table 1) using the mERPR+HER2 assay were determined. The AUC of HER2 ΔΔCT values from the discovery set was 0.968 (95% CI: 0.924–1.000). The HER2 ΔΔCT values were compared with HER2 IHC scores with HER2 IHC 3+ (HER2-over) defined as samples expressing above the normal level of HER2 (HER2-norm). The performance measurements of HER2 classification based on the HER2 IHC status were compared using various HER2 ΔΔCT cutoff points (Figure 6A). A ΔΔCT cutoff point of 3.5 with 91% accuracy was empirically selected to divide 55 HER2 ΔΔCT values into two groups in Figure 6B. The distribution of HER2 IHC scores and the classification of HER2 status by both ΔΔCT cutoff-point and clustering methods of the discovery set are listed in Table 7. Using a ΔΔCT cutoff point of 3.5 for the classification of HER2 expression status, one HER2 IHC 2+ sample were classified as HER2-over, and four samples with HER2 IHC 3+ were classified as HER2-norm. Using the clustering method, all 38 samples with HER2 IHC 0 to 2+ were classified correctly. Nine of 17 samples with HER2 IHC 3+ were classified as HER2-norm. When compared with IHC HER2 expression status, the kappa coefficients of the ΔΔCT cutoff-point and clustering methods for classification of HER2 expression status of the discovery set were 0.776 (95% CI: 0.592−0.961) and 0.551 (95% CI: 0.312−0.791), respectively (Table 8).
Figure 6.
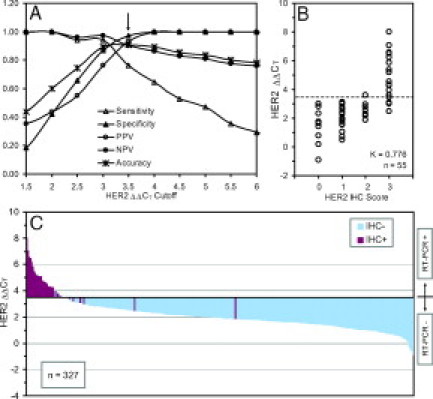
HER2 classification. A: Performance measurements of classification based on HER2 IHC status using various ΔΔCT cutoff points of the discovery sample set. B: Classification of the discovery sample set using the ΔΔCT cutoff point of 3.5. C: Distribution of HER2 ΔΔCTvalues with IHC status of the discovery and validation sample sets.
Table 7.
Classification of HER2 Overexpression of the Discovery and Validation Sets Using the ΔΔCT Cutoff-Point and Clustering Methods
| Discovery (n = 55) |
Validation (n = 272) |
|||||||||
|---|---|---|---|---|---|---|---|---|---|---|
| ΔΔCTcutoff-point |
Clustering |
ΔΔCTcutoff-point |
Clustering |
|||||||
| HER2 IHC scorea | IHC (% of total) | HER2-over | HER2-norm | HER2-over | HER2-norm | IHC (% of total) | HER2-over | HER2-norm | HER2-over | HER2-norm |
| 0 | 10 | 0 | 10 | 0 | 10 | 200 | 2 | 198 | 0 | 200 |
| 1+ | 20 | 0 | 20 | 0 | 20 | 53 | 2 | 51 | 0 | 53 |
| 2+ | 8 | 1 | 7 | 0 | 8 | 2 | 0 | 2 | 0 | 2 |
| HER2-norm* | 38 (69%) | 1 | 37 | 0 | 38 | 255 (94%) | 4 | 251 | 0 | 255 |
| 3+ | 17 | 13 | 4 | 8 | 9 | 17 | 14 | 3 | 5 | 12 |
| HER2-over† | 17 (31%) | 13 | 4 | 8 | 9 | 17 (6%) | 14 | 3 | 5 | 12 |
Total number of specimens with HER2 IHC scores 0, 1+, and 2+.
The number of specimens with HER2 IHC score 3+.
Table 8.
Summary of the Performance of HER2 Classification
| Discovery (n = 55) |
Validation (n = 272) |
|||
|---|---|---|---|---|
| ΔΔCT cutoff-point | Clustering | ΔΔCT cutoff-point | Clustering | |
| Sensitivity | 0.76 (0.50−0.93) | 0.53 (0.28−0.77) | 0.82 (0.57−0.96) | 0.71 (0.44−0.90) |
| Specificity | 0.97 (0.86−1.00) | 1.00 (0.91−1.00) | 0.98 (0.96−0.99) | 1.00 (0.99−1.00) |
| PPV | 0.93 (0.66−1.00) | 1.00 (0.63−1.00) | 0.78 (0.52−0.94) | 1.00 (0.48−1.00) |
| NPV | 0.90 (0.77−0.97) | 0.81 (0.67−0.91) | 0.99 (0.97−1.00) | 0.96 (0.92−0.98) |
| Accuracy | 0.91 (0.80−0.97) | 0.84 (0.71−0.92) | 0.97 (0.95−0.99) | 0.96 (0.92−0.98) |
| Kappa | 0.776 (0.592−0.961) | 0.551 (0.312−0.791) | 0.786 (0.633−0.940) | 0.439 (0.182−0.696) |
Both the ΔΔCT cutoff point of 3.5 and the model parameters for the clustering method derived from the discovery set were applied to classify HER2 expression status of 272 samples in the validation set. The AUC of HER2 ΔΔCT values from the validation set was 0.968 (95% CI: 0.915–1.000). The distribution of 272 HER2 IHC scores and the classification of HER2 status by both ΔΔCT cutoff-point and clustering methods of the validation set are listed in Table 7. Using the ΔΔCT cutoff point of 3.5, four samples (two HER2 IHC 0 and two HER2 1+) were classified as HER2-over, and three HER2 IHC 3+ samples was classified as HER2-norm. Using the clustering method, all 255 HER2-norm samples were classified correctly, but 12 of 17 HER2 IHC 3+ samples were classified as HER2-norm. When compared with IHC HER2 expression status, the kappa coefficients of the ΔΔCT cutoff-point and clustering methods for classification of HER2 overexpression of the validation set were 0.786 (95% CI: 0.633− 0.940) and 0.439 (95% CI: 0.182−0.696), respectively (Table 8).
Diagnostic Metrics of mERPR+HER2 Assay
The performance measurements of the mERPR+HER2 assay, sensitivity, specificity, positive predictive value, negative predictive value, accuracy, and kappa coefficient, for ER, PR, and HER2 overexpression with the discovery and validation sets are listed in Tables 4, 6, and 8, respectively.
All ΔΔCT values from the discovery and validation sets were sorted, and then plotted using ΔΔCT of 1.5, 0.5, and 3.5 as the cutoff points for ER, PR, and HER2, respectively, and compared with IHC ER, PR, and HER2 status in Figures 4C, 5C, and 6C, respectively.
Discussion
Several factors, such as the size of the tissue biopsy, the type of the fixative, the age of the paraffin block, or the degree of chemical modification, affect the recovery of amplifiable RNA from FFPE sections. Insufficient amounts of recovered RNA from FFPE sections for profiling of a panel of genes for breast cancer studies have been reported.63,64 Therefore, we set out to develop a multiplex TaqMan assay to quantitate mRNA levels of ESR1, PGR, ERBB2 (HER2), and two HSK genes in a single tube for breast cancer diagnosis. We evaluated the performance of the mERPR+HER2 assay with three sets of breast cancer specimens using two classification methods on two instrument platforms.
A recent review discussed the current issues in ER and HER2 testing for breast cancer by IHC.31 In addition, the intratumoral heterogeneity and the various degree of HER2 DNA amplification in breast tumor specimens using IHC and fluorescence in situ hybridization assays have been reported.65,66 Therefore, it is important to demonstrate the reproducibility of sequential FFPE sections using the mERPR+HER2 assay. Our results in Figure 3 demonstrated good reproducibility for samples with ER+, PR+, or HER2-over status, and better than that of the group of ER−, PR−, or HER2-norm, respectively, because of the later CT values resulting from the relatively low abundance of mRNA levels.
The lack of intermediate Allred scores in the ER discovery sample set (only two Allred TS3 and no Allred TS2 or TS4 samples) rendered the ΔΔCT cutoff-point selection more challenging; therefore the more conservative lower ΔΔCT cutoff point of 1.5 was selected. Approximately two thirds of breast cancer has ER+ status, however sample set 3 of the validation sample set in our study was mostly ER+ (97%). Consequently, the percentage of samples with HER2 overexpression (HER2 IHC 3+) in this set was also lower than the generally observed 25% to 30% with HER2 overexpression.17 The kappa coefficients of ER classification using the ΔΔCT cutoff-point method for the discovery and validation sets were similar, 0.842 and 0.870, respectively (Table 4). In contrast, the kappa coefficient of ER classification using the clustering method dropped from 0.924 to 0.759 for the validation set (Table 4). The discordant results between the IHC ER assay and the mERPR+HER2 assay were 9 (2%) and 13 (3%) of a total of 400 samples using the ΔΔCT cutoff-point method (Figure 4C) and the clustering method, respectively.
The ER mRNA expression in breast tumor specimens is bimodal as represented by the sigmoidal transition between RT-PCR–and RT-PCR+ groups (see Figure 4C). Both IHC ER−/PCR ER+ and IHC ER+/PCR ER− groups were identified by IHC methods with different antibodies used by the two clinical sites. Therefore, it is likely that the performance of the different antibodies was similar even though the SP1 clone used by Guy's Hospital has been indicated to have higher affinity and a more robust performance.31,67 The group of IHC ER− but PCR ER+ subjects, currently not being identified, may merit consideration of endocrine therapy, but clinical data do not exist on the benefit of endocrine therapy in this situation.
The total number of IHC ER− samples, 36 of 400 (9%) in the discovery and validation sets was relatively small, therefore the cutoff point of 1.5 requires additional validation with a larger number of samples even though the kappa coefficients of the agreement of ER status between the IHC assay and the mERPR+HER2 assay with the ΔΔCT cutoff-point method was “almost perfect”68 based on the interpretation of Cohen's kappa for both discovery and validation sets. The agreement of ER status between the IHC assay and the mERPR+HER2 assay with the ΔΔCT cutoff-point method was slightly higher than those reported by Cronin et al43 (kappa = 0.825; n = 62) and Ma et al44 (kappa = 0.83; n = 852). Subsequently, two additional groups reported the agreement of ER status between the IHC assay and the ER TaqMan assay in the Oncotype DX as kappa = 0.81 (n = 149)63 and kappa = 1.0 (n = 80).64
In contrast to ER mRNA expression, PR mRNA expression is more continuous as represented by the gradual increase of ΔΔCT values from the RT-PCR− group to the RT-PCR+ group in Figure 5C. The kappa coefficients of PR status between the IHC assay and the mERPR+HER2 assay dropped from the discovery to validation set using both ΔΔCT cutoff-point and the clustering methods (Table 6). When compared with ER discordant results, the percentage of samples with discordant results between PR IHC assay and the mERPR+HER2 assay were larger, 30 (8%) and 25 (6%) of a total of 388 samples using ΔΔCT cutoff-point method (Figure 5C) and the clustering method, respectively, which is likely due to the more continuous values for expression of PR. Therefore, we will continue to evaluate the performance of both classification methods for PR status. The agreement of PR status between the IHC assay and the mERPR+HER2 assay with the ΔΔCT cutoff-point method for the validation set, was similar to those reported by Cronin et al43 (kappa = 0.674; n = 62) and Ma et al44 (kappa = 0.70; n = 852). However, subsequently two groups reported lower agreement for PR status, kappa of 0.48 (n = 149)63 and kappa of 0.57 (n = 80), using the PR TaqMan assay in the Oncotype DX.64
The regulation of PR expression is complex and not fully understood at present. Two estrogen-regulated promoters and several alternative splice variants have been reported.16,69,70 The differences in the agreement between various IHC and RT-PCR assays might be the result of the PR antibodies interrogating different epitopes for the IHC assays and/or different mRNA variants for RT-PCR assays. In addition, the RT-PCR assay doesn't discern PR-A from PR-B isoforms, which are translated from different translation initiation sites. Several studies reported interesting findings of cross talk between the estrogen and growth factor HER2 signaling pathways, which resulted in decreased PR levels, and the tumors eventually becoming tamoxifen resistant.71,72,73,74
The performances of ER and PR classifications using IHC-status-dependent ΔΔCT cutoff-point and IHC-status-independent clustering methods were similar (Tables 4 and 6). However, it is interesting that the performance of classification of HER2 overexpression between the IHC-status-dependent ΔΔCT cutoff-point and IHC-status-independent clustering methods were quite different (Table 8). Using the clustering method, 9 of 17 (53%) and 12 of 17 (70%) samples with HER2 IHC 3+ samples were classified as HER2-norm for the discovery and validation sets, respectively. Based on the clustering results, a HER2 ΔΔCT cutoff point of 5.0 instead of 3.5 could have been selected to classify HER2 status. However, the sensitivity of the HER2 classification of the discovery set would have decreased to 0.47 when compared with the “gold standard” IHC assay. Using the HER2 IHC assay, several groups have reported false-positive HER2 overexpression results, especially in the group with HER IHC 2+.65,66,75 The agreement, kappa, of HER2 overexpression status between the IHC assay and the mERPR+HER2 assay with the ΔΔCT cutoff-point method for both discovery and validation sets (Table 8) were higher than kappa of 0.60 with the HER2 TaqMan assay in the Oncotype DX.63 The samples with HER2, IHC 2+ and 3+ status in our study were under represented in our HER2 validation set due to the high percentage of ER+ samples in the sample set. Therefore, we will continue to evaluate both ΔΔCT cutoff-point and clustering methods for classification of HER2 overexpression, and compare the results with that of IHC and/or fluorescence in situ hybridization. Although presently the ASCO 2007 Guideline Update does not recommend testing HER2 level to determine sensitivity to endocrine therapy,32 reporting quantitative ER, PR, and HER2 expression levels might provide a better understanding of the cause of the resistance to tamoxifen and non-responsiveness to trastuzmab treatments.
In conclusion, we developed a sensitive single-tube, one-step multiplex TaqMan assay to quantitate ER, PR, and HER2 expression levels with results shown to be consistent across multiple adjacent sections from the same tumor. The classification of ER, PR, and HER2-overexpression status was evaluated with two methods and compared with IHC results. Based on the interpretation of kappa coefficients, the agreement was “almost perfect” for ER, and the agreement was “substantial” for both PR and HER2.68 This 2-hour RT-PCR assay to determine the ER, PR, and HER2 status can be easily adopted in a clinical laboratory for molecular testing of the most important predictive and prognostic markers for breast cancer.
Acknowledgements
We thank Scott Benson and Dean Tsou at Applied Biosystems for providing TaqMan probes labeled with TRE and PHO and new passive reference dye, NPR. We thank Chris Sigua, Henry Shu, Wontae Kim, and Cindy Christopherson at Celera, Eddie Kallam at LabCorp, and Robert Springall at Guy's and St. Thomas' Breast Tissue and Data Bank for their technical supports to this study. We thank Tom White and Tom Lenk for providing comments on the manuscript.
Footnotes
Celera has provided funding to Guy's Hospital and St. Thomas Tissue and Data bank for aquisition of breast cancer specimens. In addition, LabCorp is offering the ER/PR Gene Expression Assay.
Supplemental material for this article can be found on http://jmd.amjpathol.org.
Supplementary data
References
- 1.Schiff R, Osborne CK. Endocrinology and hormone therapy in breast cancer: new insight into estrogen receptor-alpha function and its implication for endocrine therapy resistance in breast cancer. Breast Cancer Res. 2005;7:205–211. doi: 10.1186/bcr1287. [DOI] [PMC free article] [PubMed] [Google Scholar]
- 2.Fisher B, Jeong JH, Bryant J, Anderson S, Dignam J, Fisher ER, Wolmark N. National Surgical Adjuvant Breast and Bowel Project randomised clinical trials: treatment of lymph-node-negative, oestrogen-receptor-positive breast cancer: long-term findings from National Surgical Adjuvant Breast and Bowel Project randomised clinical trials. Lancet. 2004;364:858–868. doi: 10.1016/S0140-6736(04)16981-X. [DOI] [PubMed] [Google Scholar]
- 3.International Breast Cancer Study Group (IBCSG) Endocrine responsiveness and tailoring adjuvant therapy for postmenopausal lymph node-negative breast cancer: a randomized trial. J Natl Cancer Inst. 2002;94:1054–1065. doi: 10.1093/jnci/94.14.1054. [DOI] [PubMed] [Google Scholar]
- 4.Coates AS, Keshaviah A, Thürlimann B, Mouridsen H, Mauriac L, Forbes JF, Paridaens R, Castiglione-Gertsch M, Gelber RD, Colleoni M, Láng I, Del Mastro L, Smith I, Chirgwin J, Nogaret JM, Pienkowski T, Wardley A, Jakobsen EH, Price KN, Goldhirsch A. Five years of letrozole compared with tamoxifen as initial adjuvant therapy for postmenopausal women with endocrine-responsive early breast cancer: update of study BIG 1–98. J Clin Oncol. 2007;25:486–492. doi: 10.1200/JCO.2006.08.8617. [DOI] [PubMed] [Google Scholar]
- 5.Arimidex, Tamoxifen, Alone or in Combination (ATAC) Trialists' Group, Forbes JF, Cuzick J, Buzdar A, Howell A, Tobias JS, Baum M. Effect of anastrozole and tamoxifen as adjuvant treatment for early-stage breast cancer: 100-month analysis of the ATAC trial. Lancet Oncol. 2008;9:45–53. doi: 10.1016/S1470-2045(07)70385-6. [DOI] [PubMed] [Google Scholar]
- 6.Viale G, Regan MM, Maiorano E, Mastropasqua MG, Dell'Orto P, Rasmussen BB, Raffoul J, Neven P, Orosz Z, Braye S, Ohlschlegel C, Thürlimann B, Gelber RD, Castiglione-Gertsch M, Price KN, Goldhirsch A, Gusterson BA, Coates AS. Prognostic and predictive value of centrally reviewed expression of estrogen and progesterone receptors in a randomized trial comparing letrozole and tamoxifen adjuvant therapy for postmenopausal early breast cancer: bIG 1–98. J Clin Oncol. 2007;25:3846–3852. doi: 10.1200/JCO.2007.11.9453. [DOI] [PubMed] [Google Scholar]
- 7.Viale G, Regan MM, Maiorano E, Mastropasqua MG, Golouh R, Perin T, Brown RW, Kovács A, Pillay K, Ohlschlegel C, Braye S, Grigolato P, Rusca T, Gelber RD, Castiglione-Gertsch M, Price KN, Goldhirsch A, Gusterson BA, Coates AS. Chemoendocrine compared with endocrine adjuvant therapies for node-negative breast cancer: predictive value of centrally reviewed expression of estrogen and progesterone receptors–International Breast Cancer Study Group. J Clin Oncol. 2008;26:1404–1410. doi: 10.1200/JCO.2007.10.6393. [DOI] [PubMed] [Google Scholar]
- 8.Dowsett M, Allred C, Knox J, Quinn E, Salter J, Wale C, Cuzick J, Houghton J, Williams N, Mallon E, Bishop H, Ellis I, Larsimont D, Sasano H, Carder P, Cussac AL, Knox F, Speirs V, Forbes J, Buzdar A. Relationship between quantitative estrogen and progesterone receptor expression and human epidermal growth factor receptor 2 (HER-2) status with recurrence in the Arimidex, Tamoxifen, alone or in combination trial. J Clin Oncol. 2008;26:1059–1065. doi: 10.1200/JCO.2007.12.9437. [DOI] [PubMed] [Google Scholar]
- 9.Piccart-Gebhart MJ, Procter M, Leyland-Jones B, Goldhirsch A, Untch M, Smith I, Gianni L, Baselga J, Bell R, Jackisch C, Cameron D, Dowsett M, Barrios CH, Steger G, Huang CS, Andersson M, Inbar M, Lichinitser M, Láng I, Nitz U, Iwata H, Thomssen C, Lohrisch C, Suter TM, Rüschoff J, Suto T, Greatorex V, Ward C, Straehle C, McFadden E, Dolci MS, Gelber RD. Herceptin Adjuvant (HERA) Trial Study Team: trastuzumab after adjuvant chemotherapy in HER2-positive breast cancer. N Engl J Med. 2005;353:1659–1672. doi: 10.1056/NEJMoa052306. [DOI] [PubMed] [Google Scholar]
- 10.Romond EH, Perez EA, Bryant J, Suman VJ, Geyer CE, Jr, Davidson NE, Tan-Chiu E, Martino S, Paik S, Kaufman PA, Swain SM, Pisansky TM, Fehrenbacher L, Kutteh LA, Vogel VG, Visscher DW, Yothers G, Jenkins RB, Brown AM, Dakhil SR, Mamounas EP, Lingle WL, Klein PM, Ingle JN, Wolmark N. Trastuzumab plus adjuvant chemotherapy for operable HER2-positive breast cancer. N Engl J Med. 2005;353:1673–1684. doi: 10.1056/NEJMoa052122. [DOI] [PubMed] [Google Scholar]
- 11.Hudis CA. Trastuzumab–mechanism of action and use in clinical practice. N Engl J Med. 2007;357:39–51. doi: 10.1056/NEJMra043186. [DOI] [PubMed] [Google Scholar]
- 12.Coombes RC, Hall E, Gibson LJ, Paridaens R, Jassem J, Delozier T, Jones SE, Alvarez I, Bertelli G, Ortmann O, Coates AS, Bajetta E, Dodwell D, Coleman RE, Fallowfield LJ, Mickiewicz E, Andersen J, Lønning PE, Cocconi G, Stewart A, Stuart N, Snowdon CF, Carpentieri M, Massimini G, Bliss JM, van de Velde C. Intergroup Exemestane Study: a randomized trial of exemestane after two to three years of tamoxifen therapy in postmenopausal women with primary breast cancer. N Engl J Med. 2004;350:1081–1092. doi: 10.1056/NEJMoa040331. [DOI] [PubMed] [Google Scholar]
- 13.Osborne CK, Schiff R, Arpino G, Lee AS, Hilsenbeck VG. Endocrine responsiveness: understanding how progesterone receptor can be used to select endocrine therapy. Breast. 2005;14:458–465. doi: 10.1016/j.breast.2005.08.024. [DOI] [PubMed] [Google Scholar]
- 14.Bardou VJ, Arpino G, Elledge RM, Osborne CK, Clark GM. Progesterone receptor status significantly improves outcome prediction over estrogen receptor status alone for adjuvant endocrine therapy in two large breast cancer databases. J Clin Oncol. 2003;21:1973–1979. doi: 10.1200/JCO.2003.09.099. [DOI] [PubMed] [Google Scholar]
- 15.Anderson WF, Chu KC, Chatterjee N, Brawley O, Brinton LA. Tumor variants by hormone receptor expression in white patients with node-negative breast cancer from the surveillance, epidemiology, and end results database. J Clin Oncol. 2001;19:18–27. doi: 10.1200/JCO.2001.19.1.18. [DOI] [PubMed] [Google Scholar]
- 16.Cui X, Schiff R, Arpino G, Osborne CK, Lee AV. Biology of progesterone receptor loss in breast cancer and its implications for endocrine therapy. J Clin Oncol. 2005;23:7721–7735. doi: 10.1200/JCO.2005.09.004. [DOI] [PubMed] [Google Scholar]
- 17.Arpino G, Weiss H, Lee AV, Schiff R, De Placido S, Osborne CK, Elledge RM. Estrogen receptor-positive, progesterone receptor-negative breast cancer: association with growth factor receptor expression and tamoxifen resistance. J Natl Cancer Inst. 2005;97:1254–1261. doi: 10.1093/jnci/dji249. [DOI] [PubMed] [Google Scholar]
- 18.Rakha EA, El-Sayed ME, Green AR, Paish EC, Powe DG, Gee J, Nicholson RI, Lee AH, Robertson JF, Ellis IO. Biologic and clinical characteristics of breast cancer with single hormone receptor positive phenotype. J Clin Oncol. 2007;25:4772–4778. doi: 10.1200/JCO.2007.12.2747. [DOI] [PubMed] [Google Scholar]
- 19.McGuire WL. Estrogen receptors in human breast cancer. J Clin Invest. 1973;52:73–77. doi: 10.1172/JCI107175. [DOI] [PMC free article] [PubMed] [Google Scholar]
- 20.Harvey JM, Clark GM, Osborne CK, Allred DC. Estrogen receptor status by immunohistochemistry is superior to the ligand-binding assay for predicting response to adjuvant endocrine therapy in breast cancer. J Clin Oncol. 1999;17:1474–1481. doi: 10.1200/JCO.1999.17.5.1474. [DOI] [PubMed] [Google Scholar]
- 21.Leake R. Detection of the oestrogen receptor (ER). immunohistochemical versus cytosol measurements. Eur J Cancer. 2000;36(Suppl 4):S18–S19. doi: 10.1016/s0959-8049(00)00208-2. [DOI] [PubMed] [Google Scholar]
- 22.Elledge RM, Green S, Pugh R, Allred DC, Clark GM, Hill J, Ravdin P, Martino S, Osborne CK. Estrogen receptor (ER) and progesterone receptor (PgR), by ligand-binding assay compared with ER. PgR and pS2, by immuno-histochemistry in predicting response to tamoxifen in metastatic breast cancer: a Southwest Oncology Group Study. Int J Cancer. 2000;89:111–117. [PubMed] [Google Scholar]
- 23.Allred DC, Harvey JM, Berardo M, Clark G. Prognostic and predictive factors in breast cancer by immunohistochemical analysis. Mod Pathol. 1998;11:155–168. [PubMed] [Google Scholar]
- 24.Rhodes A, Jasani B, Balaton AJ, Barnes DM, Anderson E, Bobrow LG, Miller KD. Study of interlaboratory reliability and reproducibility of estrogen and progesterone receptor assays in Europe. Documentation of poor reliability and identification of insufficient microwave antigen retrieval time as a major contributory element of unreliable assays. Am J Clin Pathol. 2001;115:44–58. doi: 10.1309/H905-HYC1-6UQQ-981P. [DOI] [PubMed] [Google Scholar]
- 25.Fisher ER, Anderson S, Dean S, Dabbs D, Fisher B, Siderits R, Pritchard J, Pereira T, Geyer C, Wolmark N. Solving the dilemma of the immunohistochemical and other methods used for scoring estrogen receptor and progesterone receptor in patients with invasive breast carcinoma. Cancer. 2005;103:164–173. doi: 10.1002/cncr.20761. [DOI] [PubMed] [Google Scholar]
- 26.Paik S, Bryant J, Tan-Chiu E, Romond E, Hiller W, Park K, Brown A, Yothers G, Anderson S, Smith R, Wickerham DL, Wolmark N. Real-world performance of HER2 testing–National Surgical Adjuvant Breast and Bowel Project experience. J Natl Cancer Inst. 2002;94:852–854. doi: 10.1093/jnci/94.11.852. [DOI] [PubMed] [Google Scholar]
- 27.Reddy JC, Reimann JD, Anderson SM, Klein PM. Concordance between central and local laboratory HER2 testing from a community-based clinical study. Clin Breast Cancer. 2006;7:153–157. doi: 10.3816/CBC.2006.n.025. [DOI] [PubMed] [Google Scholar]
- 28.Mann GB, Fahey VD, Feleppa F, Buchanan MR. Reliance on hormone receptor assays of surgical specimens may compromise outcome in patients with breast cancer. J Clin Oncol. 2005;23:5148–5154. doi: 10.1200/JCO.2005.02.076. [DOI] [PubMed] [Google Scholar]
- 29.Schnitt SJ. Estrogen receptor testing of breast cancer in current clinical practice: what's the question? J Clin Oncol. 2006;24:1797–1799. doi: 10.1200/JCO.2005.05.0666. [DOI] [PubMed] [Google Scholar]
- 30.Elledge RM. Tales from a targeted therapy. J Clin Oncol. 2006;24:1323–1325. doi: 10.1200/JCO.2005.04.6672. [DOI] [PubMed] [Google Scholar]
- 31.Gown AM. Current issues in ER and HER2 testing by IHC in breast cancer. Mod Pathol. 2008;21:S8–S15. doi: 10.1038/modpathol.2008.34. [DOI] [PubMed] [Google Scholar]
- 32.Harris L, Fritsche H, Mennel R, Norton L, Ravdin P, Taube S, Somerfield MR, Hayes DF, Bast RC., Jr American Society of Clinical Oncology: American Society of Clinical Oncology 2007 update of recommendations for the use of tumor markers in breast cancer. J Clin Oncol. 2007;25:5287–5312. doi: 10.1200/JCO.2007.14.2364. [DOI] [PubMed] [Google Scholar]
- 33.Wolff AC, Hammond ME, Schwartz JN, Hagerty KL, Allred DC, Cote RJ, Dowsett M, Fitzgibbons PL, Hanna WM, Langer A, McShane LM, Paik S, Pegram MD, Perez EA, Press MF, Rhodes A, Sturgeon C, Taube SE, Tubbs R, Vance GH, van de Vijver M, Wheeler TM, Hayes DF. American Society of Clinical Oncology/College of American Pathologists guideline recommendations for human epidermal growth factor receptor 2 testing in breast cancer. Arch Pathol Lab Med. 2007;131:18–43. doi: 10.5858/2007-131-18-ASOCCO. [DOI] [PubMed] [Google Scholar]
- 34.Chevillard S, Müller A, Levalois C, Lainé-Bidron C, Vielh P, Magdelénat H. Reverse transcription-polymerase chain reaction (RT-PCR) assays of estrogen and progesterone receptors in breast cancer. Breast Cancer Res Treat. 1996;41:81–89. doi: 10.1007/BF01807039. [DOI] [PubMed] [Google Scholar]
- 35.Tong D, Schneeberger C, Leodolter S, Zeillinger R. Quantitative determination of gene expression by competitive reverse transcription-polymerase chain reaction in degraded RNA samples. Anal Biochem. 1997;251:173–177. doi: 10.1006/abio.1997.2280. [DOI] [PubMed] [Google Scholar]
- 36.Hackl T, Zickl M, Dobianer K, Hruza C, Czerwenka K, Spona J. Detection of oestrogen and progesterone receptor expression in breast tumors by semiquantitative PCR. Anticancer Res. 1998;18:839–842. [PubMed] [Google Scholar]
- 37.Shepard SB, Cooper AG. Assessing the expression of two genes simultaneously in surgical specimens using polymerase chain reaction. Mod Pathol. 2000;13:401–406. doi: 10.1038/modpathol.3880068. [DOI] [PubMed] [Google Scholar]
- 38.Tong D, Schneeberger C, Czerwenka K, Schmutzler RK, Speiser P, Kucera E, Concin N, Kubista E, Leodolter S, Zeillinger R. Messenger RNA determination of estrogen receptor, progesterone receptor, pS2, and plasminogen activator, inhibitor-1 by competitive reverse transcription polymerase chain reaction in human breast cancer. Clin Cancer Res. 1999;5:1497–1502. [PubMed] [Google Scholar]
- 39.Iwao K, Miyoshi Y, Egawa C, Ikeda N, Tsukamoto F, Noguchi S. Quantitative analysis of estrogen receptor-alpha and -beta messenger RNA expression in breast carcinoma by real-time polymerase chain reaction. Cancer. 2000;89:1732–1738. doi: 10.1002/1097-0142(20001015)89:8<1732::AID-CNCR13>3.0.CO;2-2. [DOI] [PubMed] [Google Scholar]
- 40.de Cremoux P, Bieche I, Tran-Perennou C, Vignaud S, Boudou E, Asselain B, Lidereau R, Magdelénat H, Becette V, Sigal-Zafrani B, Spyratos F. Inter-laboratory quality control for hormone-dependent gene expression in human breast tumors using real-time reverse transcription-polymerase chain reaction. Endocr Relat Cancer. 2004;11:489–495. doi: 10.1677/erc.1.00808. [DOI] [PubMed] [Google Scholar]
- 41.Labuhn M, Vuaroqueaux V, Fina F, Schaller A, Nanni-Metellus I, Kung W, Eppenberger-Castori S, Martin PM, Eppenberger U. Simultaneous quantitative detection of relevant biomarkers in breast cancer by quantitative real-time PCR. Int J Biol Markers. 2006;21:30–39. doi: 10.5301/jbm.2008.2678. [DOI] [PubMed] [Google Scholar]
- 42.Lamy PJ, Nanni I, Fina F, Bibeau F, Romain S, Dussert C, Penault Llorca F, Grenier J, Ouafik LH, Martin PM. NASBA: a novel approach to assess hormonal receptors and ERBB2 status in breast cancer. Clin Chem Lab Med. 2006;44:3–12. doi: 10.1515/CCLM.2006.002. [DOI] [PubMed] [Google Scholar]
- 43.Cronin M, Pho M, Dutta D, Stephans JC, Shak S, Kiefer MC, Esteban JM, Baker JB. Measurement of gene expression in archival paraffin-embedded tissues: development and performance of a 92-gene reverse transcriptase-polymerase chain reaction assay. Am J Pathol. 2004;164:35–42. doi: 10.1016/S0002-9440(10)63093-3. [DOI] [PMC free article] [PubMed] [Google Scholar]
- 44.Ma XJ, Hilsenbeck SG, Wang W, Ding L, Sgroi DC, Bender RA, Osborne CK, Allred DC, Erlander MG. The HOXB13:IL17BR expression index is a prognostic factor in early-stage breast cancer. J Clin Oncol. 2006;24:4611–4619. doi: 10.1200/JCO.2006.06.6944. [DOI] [PubMed] [Google Scholar]
- 45.Bièche I, Onody P, Laurendeau I, Olivi M, Vidaud D, Lidereau R, Vidaud M. Real-time reverse transcription-PCR assay for future management of ERBB2-based clinical applications. Clin Chem. 1999;45:1148–1156. [PubMed] [Google Scholar]
- 46.Millson A, Suli A, Hartung L, Kunitake S, Bennett A, Nordberg MC, Hanna W, Wittwer CT, Seth A, Lyon E. Comparison of two quantitative polymerase chain reaction methods for detecting HER2/neu amplification. J Mol Diagn. 2003;5:184–190. doi: 10.1016/S1525-1578(10)60471-0. [DOI] [PMC free article] [PubMed] [Google Scholar]
- 48.Vinatzer U, Dampier B, Streubel B, Pacher M, Seewald MJ, Stratowa C, Kaserer K, Schreiber M. Expression of HER2 and the coamplified genes GRB7 and MLN64 in human breast cancer: quantitative real-time reverse transcription-PCR as a diagnostic alternative to immunohistochemistry and fluorescence in situ hybridization. Clin Cancer Res. 2005;11:8348–8357. doi: 10.1158/1078-0432.CCR-05-0841. [DOI] [PubMed] [Google Scholar]
- 49.Potemski P, Płuciennik E, Bednarek AK, Kusińska R, Pasz-Walczak G, Jesionek-Kupnicka D, Watala C, Kordek R. A comparative assessment of HER2 status in operable breast cancer by real-time RT-PCR and by immunohistochemistry. Med Sci Monit. 2006;12:MT57–MT61. [PubMed] [Google Scholar]
- 50.Kostopoulou E, Vageli D, Kaisaridou D, Nakou M, Netsika M, Vladica N, Daponte A, Koukoulis G. Comparative evaluation of non-informative HER-2 immunoreactions (2+) in breast carcinomas with FISH. CISH and QRT-PCR. Breast. 2007;16:615–624. doi: 10.1016/j.breast.2007.05.008. [DOI] [PubMed] [Google Scholar]
- 51.Bergqvist J, Ohd JF, Smeds J, Klaar S, Isola J, Nordgren H, Elmberger GP, Hellborg H, Bjohle J, Borg AL, Skoog L, Bergh J. Quantitative real-time PCR analysis and microarray-based RNA expression of HER2 in relation to outcome. Ann Oncol. 2007;18:845–850. doi: 10.1093/annonc/mdm059. [DOI] [PubMed] [Google Scholar]
- 52.Barberis M, Pellegrini C, Cannone M, Arizzi C, Coggi G, Bosari S. Quantitative PCR and HER2 testing in breast cancer: a technical and cost-effectiveness analysis. Am J Clin Pathol. 2008;129:563–570. doi: 10.1309/1AKQDQ057PQT9AKX. [DOI] [PubMed] [Google Scholar]
- 53.Tutt A, Wang A, Rowland C, Gillett C, Kit LL, Chew K, Dai H, Kwok S, Ryder K, Shu H, Springall R, Cane P, McCallie B, Kam-Morgan L, Anderson S, Buerger H, Gray J, Bennington J, Esserman L, Hastie T, Broder S, Sninsky J, Brandt B, Waldman F. Risk estimation of distant metastasis in node-negative, estrogen receptor-positive breast cancer patients using an RT-PCR based prognostic expression signature. BMC Cancer. 2008;8:339. doi: 10.1186/1471-2407-8-339. [DOI] [PMC free article] [PubMed] [Google Scholar]
- 54.Livak KJ, Schmittgen TD. Analysis of relative gene expression data using real-time quantitative PCR and the 2-ΔΔCT Method. Methods. 2001;25:402–408. doi: 10.1006/meth.2001.1262. [DOI] [PubMed] [Google Scholar]
- 55.DeLong ER, DeLong DM, Clarke-Pearson DL. Comparing the areas under two or more correlated receiver operating characteristic curves: a nonparametric approach. Biometrics. 1988;44:837–845. [PubMed] [Google Scholar]
- 56.R Development Core Team. R: a language and environment for statistical computing. R Foundation for Statistical Computing 2006, Vienna, Austria. ISBN 3-900051-07-0
- 57.Banfield JD, Raftery AE. Model-based Gaussian and non-Gaussian Clustering. Biometrics. 1993;49:803–821. [Google Scholar]
- 58.Fraley C, Raftery AE. MCLUST: software for model-based cluster analysis. J Class. 1999;16:297–306. [Google Scholar]
- 59.Fraley C, Raftery AE. Technical Report No. 415, Dept. of Statistics, Univ. of Washington, Oct. 2002
- 60.Fraley C, Raftery AE. Model-based clustering, discriminant analysis and density estimation. J Am Stat Assoc. 2002;97:611–631. [Google Scholar]
- 61.Fraley C, Raftery AE. Enhanced model-based clustering. Density estimation, and discriminant analysis software: mCLUST. J Class. 2003;20:263–286. [Google Scholar]
- 62.Cohen J. A coefficient of agreement for nominal scales. Educ Psychol Meas. 1960;20:37–46. [Google Scholar]
- 63.Esteva FJ, Sahin AA, Cristofanilli M, Coombes K, Lee SJ, Baker J, Cronin M, Walker M, Watson D, Shak S, Hortobagyi GN. Prognostic role of a multigene reverse transcriptase-PCR assay in patients with node-negative breast cancer not receiving adjuvant systemic therapy. Clin Cancer Res. 2005;11:3315–3319. doi: 10.1158/1078-0432.CCR-04-1707. [DOI] [PubMed] [Google Scholar]
- 64.Chang JC, Makris A, Gutierrez MC, Hilsenbeck SG, Hackett JR, Jeong J, Liu ML, Baker J, Clark-Langone K, Baehner FL, Sexton K, Mohsin S, Gray T, Alvarez L, Chamness GC, Osborne CK, Shak S. Gene expression patterns in formalin-fixed, paraffin-embedded core biopsies predict docetaxel chemosensitivity in breast cancer patients. Breast Cancer Res Treat. 2008;108:233–240. doi: 10.1007/s10549-007-9590-z. [DOI] [PubMed] [Google Scholar]
- 65.Lewis JT, Ketterling RP, Halling KC, Reynolds C, Jenkins RB, Visscher DW. Analysis of intratumoral heterogeneity and amplification status in breast carcinomas with equivocal (2+) HER-2 immunostaining. Am J Clin Pathol. 2005;124:273–281. doi: 10.1309/J9VX-ABUG-KC4Y-07DL. [DOI] [PubMed] [Google Scholar]
- 66.Vanden Bempt I, Drijkoningen M, De Wolf-Peeters C. The complexity of genotypic alterations underlying HER2-positive breast cancer: an explanation for its clinical heterogeneity. Curr Opin Oncol. 2007;19:552–557. doi: 10.1097/CCO.0b013e3282f0ad8e. [DOI] [PubMed] [Google Scholar]
- 67.Cheang MC, Treaba DO, Speers CH, Olivotto IA, Bajdik CD, Chia SK, Goldstein LC, Gelmon KA, Huntsman D, Gilks CB, Nielsen TO, Gown AM. Immunohistochemical detection using the new rabbit monoclonal antibody SP1 of estrogen receptor in breast cancer is superior to mouse monoclonal antibody 1D5 in predicting survival. J Clin Oncol. 2006;24:5637–5644. doi: 10.1200/JCO.2005.05.4155. [DOI] [PubMed] [Google Scholar]
- 68.Landis JR, Koch GG. The measurement of observer agreement for categorical data. Biometrics. 1977;33:159–174. [PubMed] [Google Scholar]
- 69.Kastner P, Krust A, Turcotte B, Stropp U, Tora L, Gronemeyer H, Chambon P. Two distinct estrogen-regulated promoters generate transcripts encoding the two functionally different human progesterone receptor forms A and B. EMBO J. 1990;9:1603–1614. doi: 10.1002/j.1460-2075.1990.tb08280.x. [DOI] [PMC free article] [PubMed] [Google Scholar]
- 70.Balleine RL, Hunt SM, Clarke CL. Coexpression of alternatively spliced estrogen and progesterone receptor transcripts in human breast cancer. J Clin Endocrinol Metab. 1999;84:1370–1377. doi: 10.1210/jcem.84.4.5637. [DOI] [PubMed] [Google Scholar]
- 71.Konecny G, Pauletti G, Pegram M, Untch M, Dandekar S, Aguilar Z, Wilson C, Rong HM, Bauerfeind I, Felber M, Wang HJ, Beryt M, Seshadri R, Hepp H, Slamon DJ. Quantitative association between HER-2/neu and steroid hormone receptors in hormone receptor-positive primary breast cancer. J Natl Cancer Inst. 2003;95:142–153. doi: 10.1093/jnci/95.2.142. [DOI] [PubMed] [Google Scholar]
- 72.Osborne CK, Shou J, Massarweh S, Schiff R. Crosstalk between estrogen receptor and growth factor receptor pathways as a cause for endocrine therapy resistance in breast cancer. Clin Cancer Res. 2005;15:865s–870s. [PubMed] [Google Scholar]
- 73.Kim HJ, Cui X, Hilsenbeck SG, Lee AV. Progesterone receptor loss correlates with human epidermal growth factor receptor 2 overexpression in estrogen receptor-positive breast cancer. Clin Cancer Res. 2006;12:1013S–1018S. doi: 10.1158/1078-0432.CCR-05-2128. [DOI] [PubMed] [Google Scholar]
- 74.Ciocca DR, Gago FE, Fanelli MA, Calderwood SK. Co-expression of steroid receptors (estrogen receptor alpha and/or progesterone receptors) and Her-2/neu: clinical implications. J Steroid Biochem Mol Biol. 2006;102:32–40. doi: 10.1016/j.jsbmb.2006.09.008. [DOI] [PubMed] [Google Scholar]
- 75.Tubbs RR, Pettay JD, Roche PC, Stoler MH, Jenkins RB, Grogan TM. Discrepancies in clinical laboratory testing of eligibility for trastuzumab therapy: apparent immunohistochemical false-positives do not get the message. J Clin Oncol. 2001;19:2714–2721. doi: 10.1200/JCO.2001.19.10.2714. [DOI] [PubMed] [Google Scholar]
Uncited reference
- 47.Gjerdrum LM, Sorensen BS, Kjeldsen E, Sorensen FB, Nexo E, Hamilton-Dutoit S. Real-time quantitative PCR of microdissected paraffin-embedded breast carcinoma: an alternative method for HER-2/neu analysis. J Mol Diagn. 2004;6:42–51. doi: 10.1016/S1525-1578(10)60490-4. [DOI] [PMC free article] [PubMed] [Google Scholar]
Associated Data
This section collects any data citations, data availability statements, or supplementary materials included in this article.