Abstract
Background
Chronic kidney disease (CKD) is associated with an increased risk of cardiac events and death, yet underuse of guideline-recommended therapies is widespread. The extent to which hospital performance affects the care of patients with CKD and non–ST-segment elevation acute coronary syndromes (NSTE ACS) is unknown.
Study Design
Observational cohort.
Setting & Participants
81,374 patients with NSTE ACS treated at 327 US hospitals.
Predictor
Hospital performance, as measured by quartiles of composite adherence to American Heart Association class I guidelines for therapy acutely (aspirin, beta-blockers, clopidogrel, heparin, glycoprotein IIb/IIIa inhibitors) and at discharge (aspirin, clopidogrel, angiotensin-converting enzyme inhibitors, lipid-lowering agents) in eligible patients.
Outcomes & Measurements
Use of each American Heart Association class I acute and discharge therapy, stratified by continuous estimated glomerular filtration rate (eGFR). Multivariable models were adjusted for demographics, clinical factors, and hospital features.
Results
Better performing hospitals had lower prescribing rates for most therapies (5 of 9) with lower levels of kidney function while lower performing hospitals were more likely to have similar prescribing rates across the eGFR spectrum, suggesting that prescribing patterns at these hospitals were insensitive to differences in eGFR.
Limitations
Observational design, selection bias of study cohort.
Conclusion
Patients with lower levels of kidney function admitted with NSTE ACS are less likely to receive evidence-based therapies. Treatment disparities related to CKD are most evident at top-performing hospitals.
Introduction
Chronic kidney disease (CKD) is associated with increased all-cause mortality, largely attributable to cardiovascular disease.1 Because patients with CKD have particularly high cardiovascular risk, several guidelines recommend aggressive therapy with risk-reductive medications.2–5 Yet, studies demonstrate that risk-reducing medications are dramatically underused, particularly during acute coronary syndromes. In fact, prescribing actually declines with lower levels of kidney function despite increasing risk for cardiovascular events.6–14 Underuse of recommended therapies is a problem that is also found among several other populations including high-risk patients14 and vulnerable groups including the elderly and women.15
In order to address such quality problems, several national health quality improvement initiatives have been launched.9,16–19 These initiatives have demonstrated significant associations between selected care processes and outcomes,16 supporting the use of broad, guideline-based performance metrics as a means of assessing and helping improve hospital quality. Among high-risk patient subgroups, improving the alignment between treatment intensity and patient risk remains an important area of investigation. However, limited data exist on the impact of hospital performance on the care of patients with CKD and cardiovascular disease. Thus, we sought to determine whether higher performing hospitals have better rates of prescribing at all levels of kidney function, and thus mitigate the paradoxical underuse of therapies among patients with non-ST-segment elevation acute coronary syndromes (NSTE ACS) at highest-risk for poor outcomes.
Methods
Data Source
We analyzed treatment patterns among eligible patients included in the CRUSADE (Can Rapid Risk Stratification of Unstable Angina Patients Suppress Adverse Outcomes With Early Implementation of the American College of Cardiology/American Heart Association Guidelines) National Quality Improvement Initiative in the United States. Details of data collection methods and data validation have been previously described.14,16,47 Between October 1, 2003, and June 30, 2006, a total of 101,946 patients with NSTE ACS (chest pain equivalent with ischemic ST-segment changes and/or positive cardiac markers) were treated at 472 hospitals throughout the United States. Participating hospitals collected data in an anonymous fashion for consecutive patients who met the inclusion criteria during the initial hospitalization. Next, 12,264 patients who were transferred out from participating hospitals were excluded because discharge medication data could not be collected after transfer as a result of current privacy laws. In order to define adequately site-level performance assessment and insure data quality, we further restricted the study cohort to those treated at sites with at least 40 patients during the study time period (n=2,341 excluded) and with at least 1 death recorded (n=1,468 excluded). We also excluded 4,499 patients with missing data on age, sex, race, or creatinine because these data were necessary for estimating kidney function. Thus, our study population consisted of 81,374 patients from 327 hospitals. Estimated glomerular filtration rates (eGFR) were calculated using admission serum creatinine values and the 4-variable Modification of Diet in Renal Disease (MDRD) Study equation20 with values truncated at 100 (i.e., GFR values >100 were set at 100).
Outcomes
We evaluated hospitals’ average use of 9 class I evidence-based therapies for patients with NSTE ACS endorsed by The American College of Cardiology (ACC)/American Heart Association (AHA) guidelines.21 For patients without contraindications, acute therapies upon hospital admission included aspirin, β-blockers, clopidogrel, heparin (unfractionated or low-molecular weight), and glycoprotein (GP) IIb/IIIa inhibitors. Discharge therapies were evaluated for patients without contraindications and who were discharged alive. Discharge therapies included aspirin; clopidogrel; lipid-lowering agents for patients with a history of dyslipidemia or low-density lipoprotein cholesterol levels >100 mg/dL; and angiotensin-converting enzyme (ACE) inhibitors for patients with a history of hypertension, history of heart failure, signs of heart failure, an in-hospital heart failure event, ejection fraction <40%, moderate or severe left ventricular dysfunction, or treated diabetes mellitus. Although angiotensin II receptor blockers may have been used as therapeutically equivalent substitutes for ACE inhibitors, they was not included in the ACE inhibitor quality measure because the prevailing guidelines during the study period did not specify it as an alternative.21 Contraindications included pre-specified clinical conditions as well as contraindications documented by clinicians.15 Missing outcomes were excluded when analyzing each specific outcome and were less then 1% for most outcomes except for acute clopidogrel (1.19%) and discharge ACE inhibitor (1.26%).
Hospital Ranking
Hospital performance was calculated by aggregating the number of times a therapy was administered divided by the sum of total eligible opportunities for all patients at a hospital.16 Patient eligibility for each measure was determined according to defined ACC/AHA guideline indications and reported contraindications.21 Patients who died anytime during the hospital stay were considered ineligible for discharge medications. In order to assess the impact of hospital ranking on medication usage among CKD patients, the hospital performance was calculated based on patients without significant CKD (eGFR ≥60 mL/min/1.73 m2, n = 47,796) to establish a measure that was not confounded by the proportion of CKD patients within each hospital. After the performance score was calculated, the hospitals were separated into 4 ranks based on their performance scores: leading (>75%), 50–75%, 25–50%, and lagging (≤25%).16
Statistical Analysis
For descriptive analyses, comparisons between patients who were in hospitals of different ranks were made factoring in baseline characteristics, presenting features, and primary attending physician. Continuous variables are presented as median (25th, 75th percentile) and categorical variables are expressed as percentages. To test for the independence of a patient’s baseline characteristics, presenting features, and primary attending physician with respect to hospitals of different ranks, Kruskal-Wallis nonparametric tests were used for continuous variables and Pearson chi-square tests were used for categorical variables.
Patients from hospitals within the same rank were divided into deciles based on their eGFR values. For each decile within each hospital group the proportion of patients who received each therapy as well as average eGFR values were calculated. The associations between eGFR and medication usage were then graphically displayed by plotting the proportion of patients who received each therapy by average eGFR stratified by hospital ranks.
Multivariable logistic regression models were used to estimate the marginal effects of eGFR in different ranks. The variables of interest in the model were eGFR (as a continuous variable), hospital rank (4-level categorical variable), and the interaction between eGFR and hospital rank. The relationship between eGFR and medication adherence of leading and lagging quality ranks hospitals were compared in the regression models. Generalized estimating equations were used to account for within-hospital clustering,22 because patients at the same hospital are more likely to be treated similarly relative to patients in other hospitals (i.e. considers within-center correlation for response). The method produces estimates similar to those from ordinary logistic regression, but the estimated variances of the estimates are adjusted for the correlation of outcomes within each hospital. The variables in adjusted models were sex, white race, BMI, age, heart rate at presentation, systolic blood pressure, family history of coronary artery disease, hypertension, diabetes mellitus, current/recent smoker, dyslipidemia, prior myocardial infarction, prior percutaneous coronary intervention, prior coronary artery bypass graft surgery, prior congestive heart failure, prior stroke, ischemic electrocardiogram abnormalities, heart failure at presentation, positive cardiac marker, primary attending, insurance status, number of hospital beds, region, hospital capabilities, and teaching hospital status. Odds ratios and 95% confidence intervals were presented per 10 ml/min/1.73m2 increase in eGFR within each hospital quality rank to examine the variation of the strength of its influence on outcomes. Formal comparisons between leading and lagging hospitals for each outcome were carried out in the multivariable logistic regression models. A significant p-value for the comparison means the eGFR effects are different across leading and lagging hospital quality ranks.
A P value <0.05 was considered significant for all tests. All analyses were performed using SAS software (version 8.2, SAS Institute, Cary, NC).
Results
Hospital Characteristics
Among the study patients (N=81,374) who were enrolled from 327 hospitals, nearly one third of patients were in the leading hospitals (rank >75% for composite adherence) while nearly one in seven patients were in the lagging hospitals (rank ≤ 25% for composite adherence) (Table 1). Substantial differences of hospital features existed between the two groups with higher total hospital bed number and a greater proportion in the leading rank group having hospitals with cardiac catheterization, percutaneous coronary intervention, and coronary artery bypass grafting capabilities as well as teaching hospital status designations.
Table 1.
Baseline Hospital Characteristics by Hospital Performance Group
| Variable | Overall | Lagging (≤25%) | 25–50% | 50–75% | Leading (>75%) | P-value |
|---|---|---|---|---|---|---|
| N=327 (100%) | n=81 (24.8%) | n=82 (25.1%) | n=82 (25.1%) | n=82 (25.1%) | ||
| Hospital Features | ||||||
| Total hospital bedsa | 325 (217, 473) | 258 (183, 375) | 337 (210, 460) | 386 (250, 567) | 329 (242, 482) | 0.0008 |
| Hospital services | 0.0001 | |||||
| No services | 6.4 | 11.1 | 9.8 | 1.2 | 3.7 | |
| Cardiac cath only | 9.2 | 18.5 | 11.0 | 1.2 | 6.1 | |
| Cardiac cath and PCI | 8.0 | 12.4 | 4.9 | 6.1 | 8.5 | |
| Cardiac cath, PCI and CABG | 76.5 | 58.0 | 74.4 | 91.5 | 81.7 | |
| Teaching hospitalb | 26.0 | 14.8 | 26.8 | 39.0 | 23.2 | 0.005 |
Abbreviations: CABG, coronary artery bypass grafting; PCI, percutaneous coronary intervention.
Data are expressed as percentages except for continuous variables
Expressed as medians (25th, 75th percentile).
Member of the Council of Teaching Hospitals.
Patient Characteristics
The median age was 68 years, 40% were women, and almost one in nine patients was African American, although there was substantial variability across hospital rank groups (Table 2). The proportions of patients with various comorbid conditions also varied by hospital rank group: the leading group had higher proportions of patients with a history of hyperlipidemia and recent or current smoking status, while the lagging group had higher proportions of patients with hypertension, diabetes mellitus, prior heart failure and prior stroke. Average estimations of kidney function and the proportion of patients primarily cared by cardiology were also lower among those in the lagging group.
Table 2.
Baseline Patient Characteristics by Hospital Performance Group
| Variable | Overall | Lagging (≤25%) | 25–50% | 50–75% | Leading (>75%) | P-value |
|---|---|---|---|---|---|---|
| N=81,374 (100%) | n=12,226 (15.0%) | n=18,201 (22.4%) | n=26,123 (32.1%) | n=24,824 (30.5%) | ||
| Demographics | ||||||
| Age, ya | 68 (56, 79) | 71 (58, 81) | 69 (58, 80) | 68 (56, 78) | 67 (56, 78) | <0.0001 |
| Men | 60.1 | 55.9 | 60.0 | 60.6 | 61.7 | <0.0001 |
| African-American | 10.8 | 13.6 | 8.8 | 12.1 | 9.4 | <0.0001 |
| Past Medical History | ||||||
| Hypertension | 71.3 | 71.9 | 71.8 | 72.0 | 70.0 | <0.0001 |
| Diabetes mellitus | 33.3 | 36.0 | 33.3 | 33.8 | 31.3 | <0.0001 |
| Hyperlipidemia | 51.8 | 43.5 | 50.2 | 54.2 | 54.6 | <0.0001 |
| Current/recent smoking | 27.2 | 24.2 | 25.3 | 28.2 | 29.0 | <0.0001 |
| Prior MI | 29.2 | 27.3 | 26.3 | 31.6 | 29.8 | <0.0001 |
| Prior heart failure | 17.9 | 21.4 | 18.5 | 17.8 | 15.8 | <0.0001 |
| Prior PCI | 21.4 | 19.2 | 20.9 | 22.2 | 22.1 | <0.0001 |
| Prior CABG | 19.5 | 19.6 | 19.7 | 19.7 | 19.2 | 0.3 |
| Prior stroke | 10.4 | 11.7 | 10.2 | 10.7 | 9.6 | <0.0001 |
| Presenting Features | ||||||
| + Cardiac markers | 91.4 | 84.4 | 90.8 | 93.4 | 93.3 | <0.0001 |
| ST depression | 30.6 | 28.8 | 31.6 | 30.5 | 30.9 | <0.0001 |
| Signs of heart failure | 24.3 | 25.9 | 26.2 | 23.5 | 23.1 | <0.0001 |
| Heart rate (bpm)a | 83 (70, 99) | 85 (72, 101) | 83 (70, 100) | 83 (70, 98) | 82 (70, 97) | <0.0001 |
| Systolic BP (mm Hg)a | 144 (123, 165) | 143 (122, 164) | 142 (122, 163) | 144 (124, 165) | 145 (125, 166) | <0.0001 |
| SCr (mg/dL)b | 1.39 (1.53) | 1.51 (1.62) | 1.43 (2.00) | 1.38 (1.43) | 1.32 (1.16) | <0.0001 |
| eGFR (mL/min/1.73m)2c | 65.7 (47.0, 83.7) | 62.3 (42.1, 81.2) | 65.0 (45.9, 83.5) | 66.7 (48.2, 84.3) | 67.2 (49.8, 84.1) | <0.0001 |
| CCr (mL/min)a,d | 53.2 (34.1, 75.6) | 47.1 (29.5, 69.8) | 51.6 (33.0, 75.0) | 54.3 (34.9, 76.4) | 56.2 (36.9, 77.6) | <0.0001 |
| Primary Attending | ||||||
| Care by cardiologist | 59.0 | 45.3 | 58.0 | 59.6 | 65.9 | <0.0001 |
Abbreviations: BP, blood pressure; CABG, coronary artery bypass grafting; CCr, creatinine clearance; eGFR, estimated glomerular filtration rate; HF, heart failure; MI, myocardial infarction; PCI, percutaneous coronary intervention; SCr, serum creatinine.
Data are expressed as percentages except for continuous variables
Expressed as medians (25th, 75th percentile)
Expressed as mean (SD)
Conversion factors: serum creatinine in mg/dL to mmol/L, x88.4; eGFR in mL/min/1.73 m^2 to mL/s/1.73 m^2, x0.01667.
Determined by using MDRD Study equation.
Determined with Cockcroft-Gault formula.
Estimated GFR Effect and Hospital Performance Groups
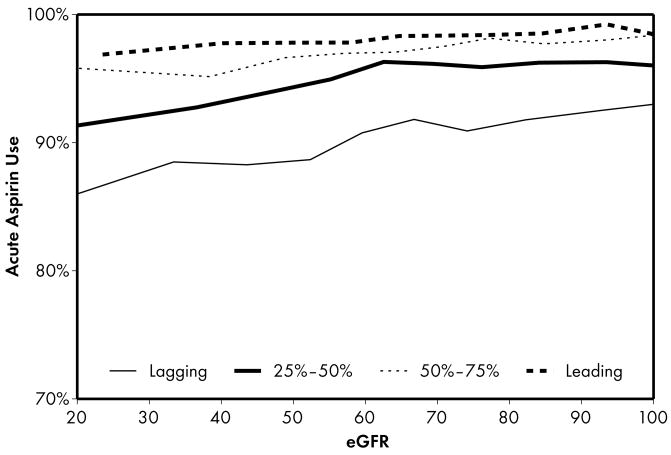
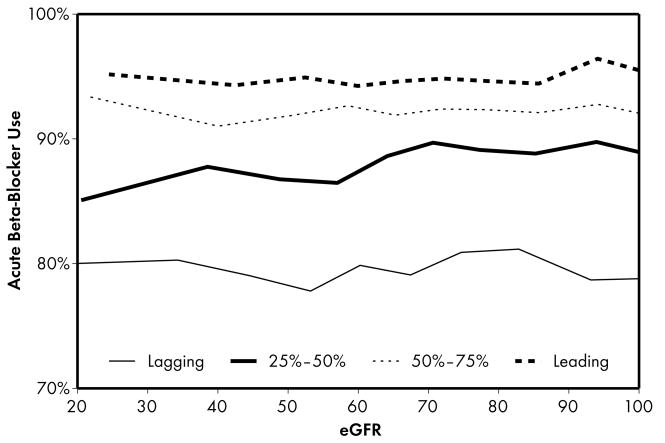
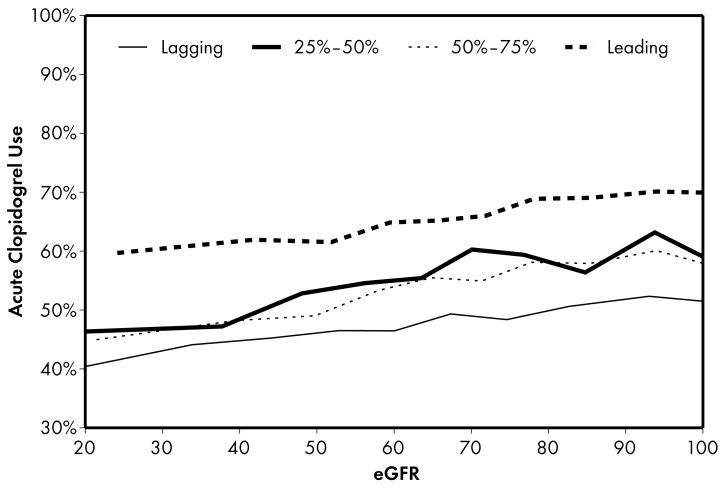
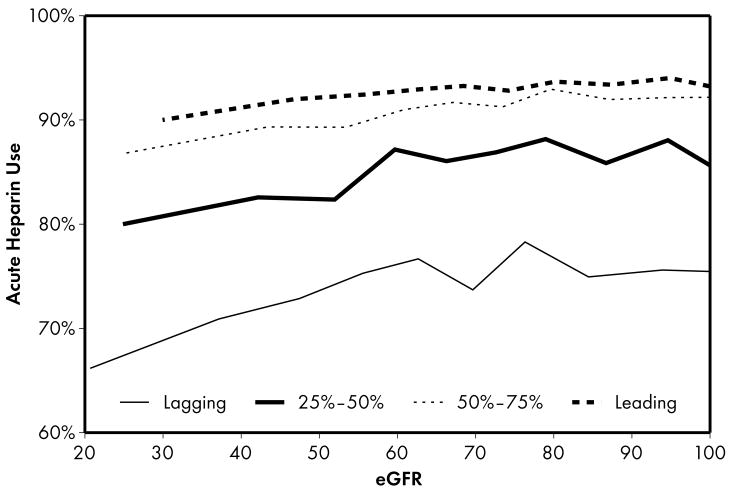
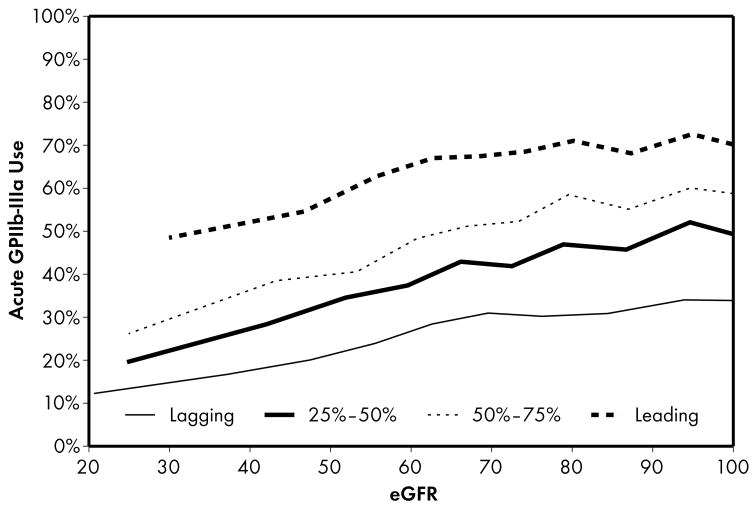
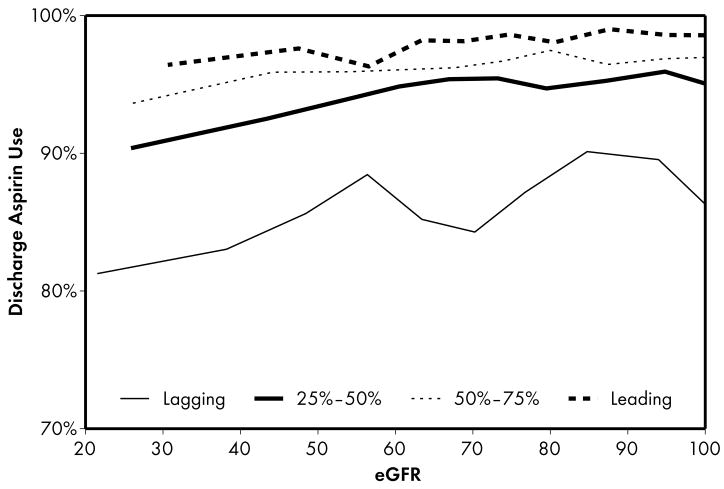
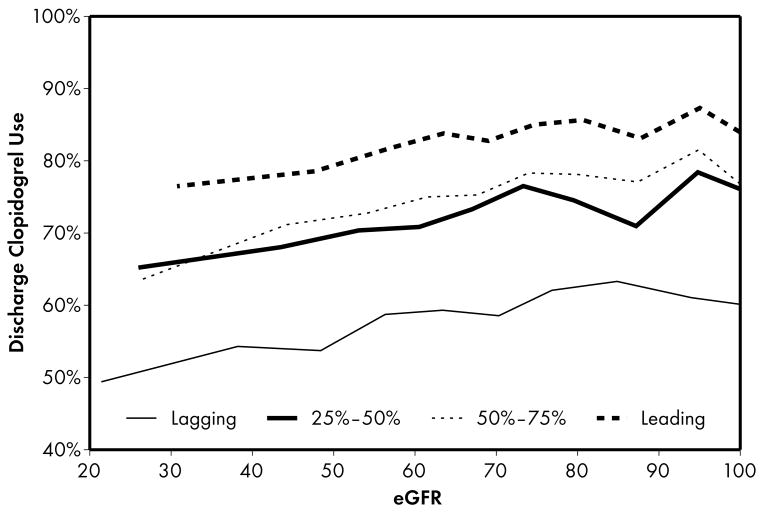
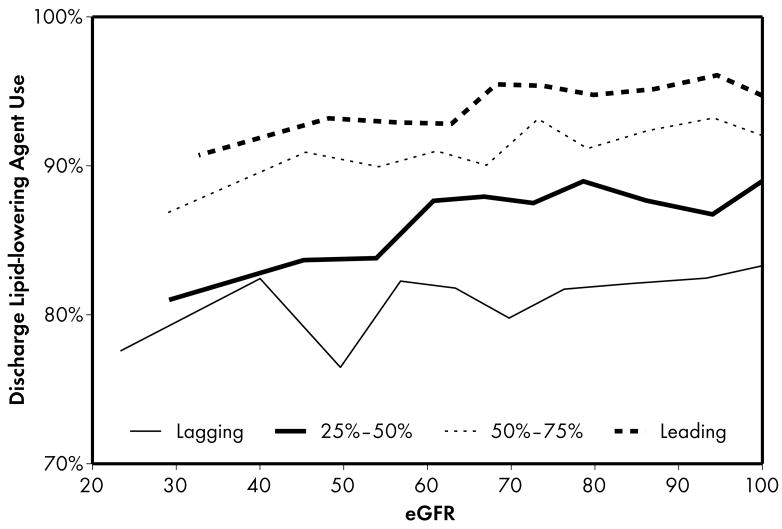
As expected, when compared to lower performing hospitals, higher performing hospitals were found to have higher rates of prescribing for all acute (Figure 1) and discharge (Figure 2) medications. Associations were explored between prescribing rates and level of kidney function across hospital performance groups. A significant eGFR effect demonstrated that prescribing rates varied across the eGFR spectrum such that prescribing rates for several acute (Table 3) and discharge (Table 4) medications declined with decreasing levels of kidney function.
Figure 1.
Higher performing hospitals were found to have higher rates of prescribing for each of the 5 guideline-recommended acute medications: aspirin (1a), β-blocker (1b), clopidogrel (1c), heparin (1d), and GP IIb/IIIa inhibitors (1e). An eGFR effect was present in both the leading and lagging hospital rank groups for GPIIb/IIIa inhibitors (1e) indicating that there was a decrease in use of this medication across the spectrum of eGFR while no eGFR effect was present in either rank groups for β-blocker and heparin therapies (1b, 1d), indicating that prescribing rates for this medication do not vary according to eGFR across hospitals of all quality ranks. For the other therapies (1a, 1c), an eGFR effect was present in the leading but not the lagging hospital rank groups.
Figure 2.
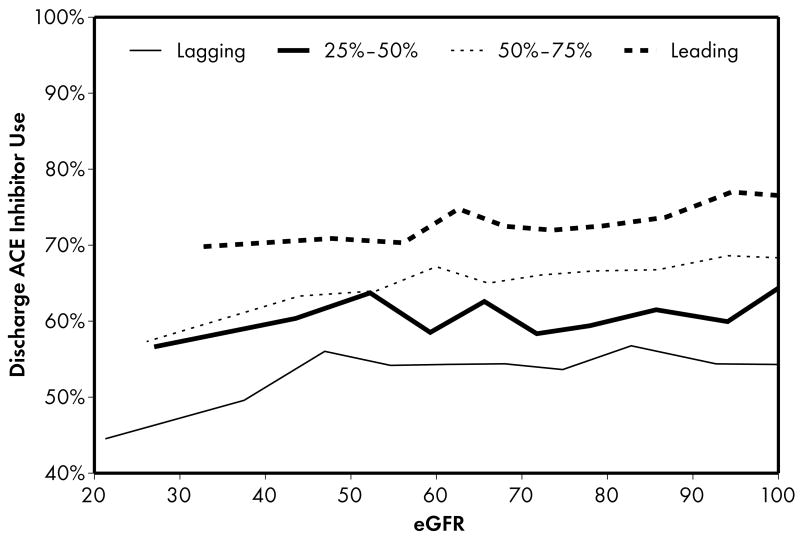
Higher performing hospitals were also found to have higher rates of prescribing for each of the 4 guideline-recommended discharge medications: aspirin (2a), clopidogrel (2b), lipid-lowering agent (2c), and ACE inhibitor (2d). For most therapies (2a, 2b, 2c), an eGFR effect was present in the leading but not the lagging hospital rank groups. An eGFR effect was present in the lagging but not the leading hospital rank groups for ACE inhibitor use (Fig 2d), a pattern consistent with the initial study hypothesis that higher performing hospitals would have higher rates of prescribing at all levels of eGFR, mitigating the pattern of underuse commonly found as eGFR declines.
Table 3.
Associations between eGFR Effect (per 10 ml/min/1.73m2 increase) and 5 Guideline-recommended Acute Therapies according to Hospital Performance Groups
| Category | Adjusted OR (95% CI)a | P-value |
|---|---|---|
| Acute Aspirin | 0.2b | |
| eGFR effect in leading (>75%) hospitals | 1.06 (1.02, 1.10) | 0.007 |
| eGFR effect in 50–75% hospitals | 1.06 (1.03, 1.10) | <0.001 |
| eGFR effect in 25–50% hospitals | 1.07 (1.03, 1.10) | <0.001 |
| eGFR effect in lagging (≤25%) hospitals | 1.02 (0.99, 1.06) | 0.2 |
| Acute β-Blockers | 0.7b | |
| eGFR effect in leading (>75%) hospitals | 1.01 (0.98, 1.04) | 0.8 |
| eGFR effect in 50–75% hospitals | 0.99 (0.98, 1.01) | 0.5 |
| eGFR effect in 25–50% hospitals | 1.03 (1.01, 1.06) | 0.005 |
| eGFR effect in lagging (≤25%) hospitals | 1.00(0.98, 1.02) | 0.7 |
| Acute clopidogrel | 0.006b | |
| eGFR effect in leading (>75%) hospitals | 1.03 (1.01, 1.05) | 0.001 |
| eGFR effect in 50–75% hospitals | 1.03, (1.02, 1.05) | <0.001 |
| eGFR effect in 25–50% hospitals | 1.03, (1.02, 1.05) | <0.001 |
| eGFR effect in lagging (≤25%) hospitals | 0.99, (0.97, 1.01) | 0.3 |
| Acute Heparin | 0.4b | |
| eGFR effect in leading (>75%) hospitals | 1.03 (0.97, 1.07) | 0.08 |
| eGFR effect in 50–75% hospitals | 1.05, (1.02, 1.07) | <0.001 |
| eGFR effect in 25–50% hospitals | 1.05, (1.02, 1.07) | <0.001 |
| eGFR effect in lagging (≤25%) hospitals | 1.01 (0.99, 1.03) | 0.2 |
| Acute GPIIb/IIIa inhibitors | 0.7b | |
| eGFR effect in leading (>75%) hospitals | 1.04 (1.02, 1.06) | <0.001 |
| eGFR effect in 50–75% hospitals | 1.08 (1.06, 1.10) | <0.001 |
| eGFR effect in 25–50% hospitals | 1.06 (1.06, 1.08) | <0.001 |
| eGFR effect in lagging (≤25%) hospitals | 1.05 (1.02, 1.07) | <0.001 |
Abbreviations: eGFR, estimated glomerular filtration rate; GP, glycoprotein.
Variables in the model – sex, white race, body mass index, age, heart rate, systolic blood pressure, family history of coronary artery disease, hypertension, diabetes, current/recent smoker, dyslipidemia, prior myocardial infarction, prior percutaneous coronary intervention, prior coronary artery bypass surgery, prior heart failure, prior stroke, ischemic electrocardiogram abnormalities, heart failure, positive cardiac markers; primary attending, insurance type, number of hospital beds, region, hospital capabilities, teaching/nonteaching hospital.
P-value for comparison of Odds Ratios between leading and lagging hospital quality ranks.
Table 4.
Associations between eGFR Effect (per 10 ml/min/1.73m2 increase) and 4 Guideline-recommended Discharge Therapies According to Hospital Performance Groups
| Category | Adjusted OR (95% CI)a | P-value |
|---|---|---|
| Discharge Aspirin | 0.02b | |
| eGFR effect in leading (>75%) hospitals | 1.06 (1.02, 1.11) | 0.003 |
| eGFR effect in 50–75% hospitals | 1.05 (1.02, 1.08) | 0.002 |
| eGFR effect in 25–50% hospitals | 1.06 (1.03, 1.09) | <0.001 |
| eGFR effect in lagging (≤25%) hospitals | 1.00 (0.98, 1.02) | 0.9 |
| Discharge clopidogrel | 0.02b | |
| eGFR effect in leading (>75%) hospitals | 1.03 (1.01, 1.048) | 0.002 |
| eGFR effect in 50–75% hospitals | 1.04 (1.03, 1.058) | <0.001 |
| eGFR effect in 25–50% hospitals | 1.02 (1.00, 1.03) | 0.08 |
| eGFR effect in lagging (≤25%) hospitals | 0.99 (0.97, 1.02) | 0.5 |
| Discharge lipid-lowering agentc | 0.01b | |
| eGFR effect in leading (>75%) hospitals | 1.050 (1.02, 1.08) | <0.001 |
| eGFR effect in 50–75% hospitals | 1.051 (1.02, 1.08) | 0.001 |
| eGFR effect in 25–50% hospitals | 1.04 (1.01, 1.07) | 0.007 |
| eGFR effect in lagging (≤25%) hospitals | 1.00 (0.96, 1.03) | 0.8 |
| Discharge ACE inhibitorsd | 0.05b | |
| eGFR effect in leading (>75%) hospitals | 1.02 (0.99, 1.04) | 0.2 |
| eGFR effect in 50–75% hospitals | 1.04 (1.01, 1.07) | 0.02 |
| eGFR effect in 25–50% hospitals | 1.00 (0.98, 1.03) | 0.9 |
| eGFR effect in lagging (≤25%) hospitals | 1.05 (1.03, 1.07) | <0.001 |
Abbreviations: eGFR, estimated glomerular filtration rate; ACE, angiotensin-converting enzyme.
Variables in the model – sex, white race, body mass index, age, heart rate, systolic blood pressure, family history of coronary artery disease, hypertension, diabetes, current/recent smoker, dyslipidemia, prior myocardial infarction, prior percutaneous coronary intervention, prior coronary artery bypass surgery, prior heart failure, prior stroke, ischemic electrocardiogram abnormalities, heart failure, positive cardiac markers; primary attending, insurance type, number of hospital beds, region, hospital capabilities, teaching/nonteaching hospital.
P-value for comparison of Odds Ratios between leading and lagging hospital rank groups
Among patients with history of dyslipidemia or low-density lipoprotein cholesterol levels >100 mg/dL
Among patients with history of, signs of, or in-hospital congestive heart failure, ejection fraction <40%, severe or moderate left ventricle dysfunction, diabetes mellitus, or hypertension
Four patterns of this eGFR effect emerged when comparing the highest and lowest performing hospital rank groups. First, an eGFR effect was present in both the leading and lagging hospital rank groups for acute GP IIb/IIIa inhibitors, indicating that there was a decrease in the use of this medication across the spectrum of eGFR for both leading and lagging quality ranks. However, the absence of significance when comparing leading and lagging quality ranks indicated that there were no significant differences across the highest and lowest hospital rank groups in the observed decrease in use of this medication. Second, an eGFR effect was present in the leading but not the lagging hospital rank groups for the majority (5 of 9) of the guideline-recommended therapies, including several acute (aspirin, clopidogrel) and discharge (aspirin, clopidogrel, lipid-lowering agent) therapies. In this case, several comparisons between leading and lagging quality ranks were significant (4 out of 5) indicating that the relationship between eGFR and decrease in use of these medications were different between leading and lagging hospital ranks. In the third pattern, we found the opposite of what was observed in the previous pattern: an eGFR effect was present in the lagging but not the leading hospital rank groups for a single discharge therapy—use of an ACE inhibitor. This pattern was consistent with the initial study hypothesis that when compared to lower performing hospitals, higher performing hospitals would have consistent rates of prescribing at all levels of eGFR, mitigating the pattern of underuse commonly found at lower levels of eGFR. Unexpectedly, we also found a fourth pattern in which no eGFR effect was present in either the leading or lagging hospital rank groups for acute β-blocker and heparin therapies, indicating that prescribing rates for these medications did not vary according to eGFR across hospitals of both the leading and lagging quality ranks.
Discussion
In a large contemporary cohort of patients admitted with NSTE ACS in all regions of the United States, we confirmed that administration of evidence-based therapies declines with lower levels of kidney function across hospitals of all performance levels. Despite better rates of prescribing at all levels of kidney function among higher performing hospitals, for most therapies the paradoxical underuse among the patients at highest-risk is not diminished by their overall higher guideline performance.
Our findings of greater underuse of medications for cardiovascular disease as kidney function declines are consistent with numerous prior studies.6–14 Underuse of recommended therapies is a problem that has long been recognized among patients with coronary artery disease.12 Paradoxical under-utilization of evidence-based therapies has also been described in other high-risk and under-represented patient subgroups such as the elderly,23 African-Americans,24 women,15 and patients with peripheral arterial disease,25 diabetes mellitus,26,27 or multiple chronic conditions.14,28 Overall, underuse of appropriate therapies is responsible for the majority of the quality gap throughout all of healthcare.29,30
However, the extent to which quality improvement initiatives have reduced existing gaps in quality has not been well characterized. We sought to determine the impact upon quality gaps in therapies among patients with CKD admitted with NSTE ACS. Despite a higher risk for poor outcomes, patients with lower levels of kidney function were less likely to receive nearly all guideline-based therapies except for acute β-blockers, even among higher performing hospitals. But when we compared higher performing and lower performing hospitals, four patterns emerged of how prescribing rates declined with decreasing levels of kidney function.
The first pattern demonstrated decreased use of GP IIb/IIIa inhibitors across the spectrum of eGFR without significant differences between leading and lagging quality ranks, suggesting that there may be a very strong reason for underuse with lower levels of kidney function. Because GP IIb/IIIa inhibitors are recommended for high-risk patients or those with ongoing and recurrent ischemia, overall use of this acute therapy was considerably lower than the others evaluated here. Nonetheless, patients with lower levels of kidney function were not more likely to be low-risk or have less ongoing and recurrent ischemia. The most likely explanation for the pattern observed is that the risk of bleeding increases substantially with lower levels of kidney function.31,32 The risk of major bleeding has been found to be about 1.5 times higher among patients with creatinine clearances between 30–60 mL/min and 2–2.5 times higher among patients with creatinine clearances <30 mL/min. Further, some episodes of bleeding after therapy with GP IIb/IIIa inhibitors may result in death.33 However, overdosing of GP IIb/IIIa inhibitor therapy increases in frequency among patients with lower levels of kidney function and may be responsible for many of these adverse bleeding events. Given the higher potential to overdose patients with lower eGFR, physicians may simply be avoiding such risks by not prescribing GP IIb/IIIa inhibitor therapy. Hopefully, future studies will provide better dosing algorithms that maximize the benefits of anti-platelet therapy while minimizing the adverse risks of bleeding.34
The majority of the therapies that we evaluated were characterized by the second pattern in which there were significant differences between leading and lagging quality ranks. Specifically, a decrease in use of these medications was observed in the leading but not the lagging hospital rank groups for several acute (aspirin, clopidogrel) and discharge (aspirin, clopidogrel, lipid-lowering agent) therapies. It is not clear why these treatment disparities by eGFR were highest among the highest performing hospitals. Inadequate experience due to low volumes of patients with lower eGFR is not likely to account for these differences because the leading hospitals provided care for almost one-third of patients and were likely to have more experience with ACS care as a result. Although the potential risks associated with these medications are not as severe as those for GP IIb/IIIa inhibitors, each one has a relatively higher rate of side effects in the setting of lower levels of kidney function.32,35 As a result, physicians at higher quality hospitals may have been more cautious in using these medications in patients with lower levels of kidney function while those at lower quality hospitals were less sensitive to these potential side effects and did not alter their prescribing pattern. Alternatively, prescribing rates at lower quality hospitals were much lower overall and as a result, may have obscured the impact of lower eGFR on treatment patterns. In addition to various local practices at higher quality hospitals, the presence of computer-based decision support systems may have guided medication dosing for patients with lower levels of kidney function.36 Nonetheless, it remains unclear whether this under prescribing is beneficial since several of these agents have been demonstrated to be effective and safe among patients with mildly to moderately decreased kidney function.37,38
Only one therapy demonstrated the pattern consistent with the initial study hypothesis that when compared to lower performing hospitals, higher performing hospitals would have higher rates of prescribing at all levels of eGFR. Unlike the patterns found among lower quality hospitals, underuse of ACE inhibitors as eGFR declined was not as prevalent at higher quality hospitals. Many physicians become concerned when the serum creatinine rises after initiating therapy, however, these patients may be the ones who benefit the most.39 Use of ACE inhibitors often declines with lower levels of kidney function,13,40 however, the benefits after myocardial infarction seen in the general population likely applies to those with mildly to moderately decreased kidney function as well.41 Because ACE inhibitor therapy can precipitate acute kidney failure in the presence of severe bilateral renal artery stenosis, many physicians withdraw ACE inhibitors when kidney function declines.42 Renal artery stenosis has long been recognized among patients who undergo coronary angiography and can be relatively common.43 Perhaps physicians at the higher performing hospitals were more likely to recognize the benefits of therapy, and in turn were more willing to treat with ACE inhibitors despite the potential of precipitating acute kidney failure.
Finally, the last pattern that we observed was unexpected: prescribing rates for acute β-blocker and heparin therapies did not vary according to eGFR across hospitals of leading and lagging quality ranks. Although a ceiling effect was likely present at the higher performing hospitals where rates of use were above 90–95%, there may still be some room for improvement among lower performing hospitals where rates of use were 70–80%. For β-blocker therapy, the consistency of prescribing rates across the entire range of kidney function is likely related to several factors. First, β-blocker therapy has long been known to be effective in reducing mortality after acute myocardial infarctions.44 Second, it is generally well tolerated and does not require renal dosage adjustments. Third, it has long been targeted in quality measurement efforts. In fact, improving rates of acute β-blocker therapy has been so successful that it was recently “put to rest” as a quality measure.45 Our findings are consistent with this decision that this measure no longer reflects significant variability in quality, particularly with respect to gaps among patients with lower levels of kidney function. Although prescribing rates did not vary according to eGFR across hospitals of leading and lagging quality ranks for heparin therapy, they did vary significantly for the middle 2 quality rank groups and the effect in the leading quality group was moderate, but not significant (OR 1.030; p=0.08). Thus, the pattern observed for acute heparin therapy was mixed and reflected a varied pattern of underuse according to eGFR rather than the truly flat response observed for β-blocker therapy.
The findings in our study must be considered in light of several limitations. First, CRUSADE hospitals were self-selected for those interested in this national quality improvement initiative and may not be fully representative of all community hospitals in the US. In addition, our study cohort excluded patients who were transferred to other facilities which likely biased the study sample at facilities with limited cardiac services by excluding lower-risk patients.46 As a result, patients who remained at hospitals without diagnostic catheterization capabilities may have been less likely to receive some acute therapies.47 Variability in creatinine measurements and the known imprecision of the MDRD Study equation among patients with normal kidney function and mild CKD may have lead to some inaccuracy in our eGFR estimates.20 Outcomes related to the underuse of the therapies evaluated in this study were not ascertained because of our limited ability to fully account for the selection bias among those who receive the various guideline-recommended treatments. We could not account for undocumented contraindications that may have significantly influenced treatment patterns, including possible site-level variation in listed contraindications for GP IIb/IIIa inhibitor therapy. In addition, we could not account for informed risk-benefit decisions between clinicians and patients that influenced lower use of these therapies. Because we only assessed medication use until discharge, we were not able to examine adherence after discharge when other studies have observed fewer differences in medication use among patients with lower levels of kidney function.48,49 Finally, we were not able to assess changes in medication use over time to determine whether there may have been improvements that reduced the underuse gap.
Despite a higher risk for poor outcomes, patients with lower levels of kidney function admitted with NSTE ACS were less likely to receive evidence-based therapies. Although higher performing hospitals had better rates of prescribing at all levels of kidney function, for most therapies the underuse among patients at highest-risk is not diminished by their higher overall performance according to established guidelines. In fact, treatment disparities by eGFR were highest among the highest performing hospitals, even among patients with mildly to moderately decreased kidney function. The reasons for persistently low prescribing rates of most therapies at lower levels of kidney function need to be explored, even among higher performing hospitals. Subsequent efforts to promote adherence to NSTE ACS guidelines may result in more favorable prescribing rates of recommended therapies among patients with CKD who are at particularly high-risk for adverse outcomes.
Acknowledgments
This study was supported by CRUSADE, a National Quality Improvement Initiative of the Duke Clinical Research Institute, which was funded by the Schering-Plough Corporation (Kenilworth, NJ). Bristol-Myers Squibb/Sanofi-Aventis Pharmaceuticals Partnership (New York, NY) and Millennium Pharmaceuticals (Cambridge, MA) provided additional funding support. Sponsors’ support was financial and none of the sponsors had a role in the design and conduct of the study; collection, management, analysis, and interpretation of the data; and preparation, or approval of the manuscript. Drs. Patel, Roe, Peterson, and Ms. Ou had full access to all of the data in the study and take responsibility for the integrity of the data and the accuracy of the data analysis. Dr. Patel is the recipient of grant K23 DK075929-01 from the National Institutes of Diabetes & Digestive & Kidney Diseases. Dr. Peterson is the recipient of grant R01 AG025312-01A1 from the National Institute on Aging.
Financial Disclosure: Dr Ohman reports having received research grants from Millennium Pharmaceuticals, Inc.; Bristol-Myers Squibb/Sanofi Pharmaceuticals Partnership; Schering Corporation; and Berlex; Dr Gibler reports having received research grants from Millennium Pharmaceuticals, Inc.; Schering Corporation; Bristol-Myers Squibb/Sanofi Pharmaceuticals Partnership; Dr Pollack Jr is on the Speakers bureau for Millennium Pharmaceuticals, Inc.; Schering Corp.; Genentech; Aventis. Research support from Aventis and serves as a consultant for Genentech, Aventis, and Millennium Pharmaceuticals, Inc. Dr Peterson reports having received research grants from Bristol-Myers Squibb, Bristol-Myers Squibb/Sanofi-Aventis Pharmaceuticals Partnership, Bristol-Myers Squibb/Merck, and Schering-Plough Corporation. Dr Roe is on the Speakers’ bureau for Millennium Pharmaceuticals, Inc., Bristol-Myers Squibb/sanofi-aventis Pharmaceuticals Partnership, Schering Corporation and reports having received research grants from Millennium Pharmaceuticals, Inc., Bristol-Myers Squibb/Sanofi-Aventis Pharmaceuticals Partnership, and Schering Corporation. The remaining authors report that they have no financial interests to disclose.
Footnotes
Presented in part at the American College of Cardiology 56th Annual Scientific Session, New Orleans, LA, March 24–27, 2007.
Publisher's Disclaimer: This is a PDF file of an unedited manuscript that has been accepted for publication. As a service to our customers we are providing this early version of the manuscript. The manuscript will undergo copyediting, typesetting, and review of the resulting proof before it is published in its final citable form. Please note that during the production process errors may be discovered which could affect the content, and all legal disclaimers that apply to the journal pertain.
References
- 1.Go AS, Chertow GM, Fan D, McCulloch CE, Hsu CY. Chronic kidney disease and the risks of death, cardiovascular events, and hospitalization. N Engl J Med. 2004;351(13):1296–1305. doi: 10.1056/NEJMoa041031. [DOI] [PubMed] [Google Scholar]
- 2.Executive Summary of the Third Report of the National Cholesterol Education Program (NCEP) Expert Panel on Detection, Evaluation, and Treatment of High Blood Cholesterol in Adults (Adult Treatment Panel III) JAMA. 2001;285(19):2486–2497. doi: 10.1001/jama.285.19.2486. [DOI] [PubMed] [Google Scholar]
- 3.Chobanian AV, Bakris GL, Black HR, et al. The Seventh Report of the Joint National Committee on Prevention, Detection, Evaluation, and Treatment of High Blood Pressure: the JNC 7 report. JAMA. 2003;289(19):2560–2572. doi: 10.1001/jama.289.19.2560. [DOI] [PubMed] [Google Scholar]
- 4.American Diabetes A. Standards of Medical Care in Diabetes. Diabetes Care. 2005;28(Suppl 1):S4–36. [PubMed] [Google Scholar]
- 5.National Kidney Foundation Kidney Disease Outcome Quality Initiative Advisory B. K/DOQI clinical practice guidelines for chronic kidney disease: evaluation, classification, and stratification. Kidney Disease Outcome Quality Initiative. Am J Kidney Dis. 2002;39(2 Suppl 1):S1–266. [PubMed] [Google Scholar]
- 6.Berger AK, Duval S, Krumholz HM. Aspirin, beta-blocker, and angiotensin-converting enzyme inhibitor therapy in patients with end-stage renal disease and an acute myocardial infarction. J Am Coll Cardiol. 2003;42(12):201–208. doi: 10.1016/s0735-1097(03)00572-2. [DOI] [PubMed] [Google Scholar]
- 7.Ezekowitz J, McAlister FA, Humphries KH, et al. The association among renal insufficiency, pharmacotherapy, and outcomes in 6,427 patients with heart failure and coronary artery disease. J Am Coll Cardiol. 2004;44(8):1587–1592. doi: 10.1016/j.jacc.2004.06.072. [DOI] [PubMed] [Google Scholar]
- 8.Wright RS, Reeder GS, Herzog CA, et al. Acute myocardial infarction and renal dysfunction: a high-risk combination. Ann Intern Med. 2002;137(7):563–70. doi: 10.7326/0003-4819-137-7-200210010-00007. [DOI] [PubMed] [Google Scholar]
- 9.Santopinto JJ, Fox KA, Goldberg RJ, et al. Creatinine clearance and adverse hospital outcomes in patients with acute coronary syndromes: findings from the global registry of acute coronary events (GRACE) Heart. 2003;89(9):1003–1008. doi: 10.1136/heart.89.9.1003. [DOI] [PMC free article] [PubMed] [Google Scholar]
- 10.McCullough PA, Sandberg KR, Borzak S, Hudson MP, Garg M, Manley HJ. Benefits of aspirin and beta-blockade after myocardial infarction in patients with chronic kidney disease. Am Heart J. 2002;144(2):226–232. doi: 10.1067/mhj.2002.125513. [DOI] [PubMed] [Google Scholar]
- 11.Shlipak MG, Heidenreich PA, Noguchi H, Chertow GM, Browner WS, McClellan MB. Association of renal insufficiency with treatment and outcomes after myocardial infarction in elderly patients. Ann Intern Med. 2002;137(7):555–562. doi: 10.7326/0003-4819-137-7-200210010-00006. [DOI] [PubMed] [Google Scholar]
- 12.Coca SG, Krumholz HM, Garg AX, Parikh CR. Underrepresentation of renal disease in randomized controlled trials of cardiovascular disease. JAMA. 2006;296(11):1377–1384. doi: 10.1001/jama.296.11.1377. [DOI] [PubMed] [Google Scholar]
- 13.Han JH, Chandra A, Mulgund J, et al. Chronic kidney disease in patients with non-ST-segment elevation acute coronary syndromes. Am J Med. 2006;119(3):248–254. doi: 10.1016/j.amjmed.2005.08.057. [DOI] [PubMed] [Google Scholar]
- 14.Roe MT, Peterson ED, Newby LK, et al. The influence of risk status on guideline adherence for patients with non-ST-segment elevation acute coronary syndromes. Am Heart J. 2006;151(6):1205–1213. doi: 10.1016/j.ahj.2005.08.006. [DOI] [PubMed] [Google Scholar]
- 15.Alexander KP, Roe MT, Chen AY, et al. Evolution in cardiovascular care for elderly patients with non-ST-segment elevation acute coronary syndromes: results from the CRUSADE National Quality Improvement Initiative. J Am Coll Cardiol. 2005;46(8):1479–1487. doi: 10.1016/j.jacc.2005.05.084. [DOI] [PubMed] [Google Scholar]
- 16.Peterson ED, Roe MT, Mulgund J, et al. Association between hospital process performance and outcomes among patients with acute coronary syndromes. JAMA. 2006;295(16):1912–1920. doi: 10.1001/jama.295.16.1912. [DOI] [PubMed] [Google Scholar]
- 17.Mehta RH, Montoye CK, Gallogly M, et al. Improving quality of care for acute myocardial infarction: The Guidelines Applied in Practice (GAP) Initiative. JAMA. 2002;287(10):1269–1276. doi: 10.1001/jama.287.10.1269. [DOI] [PubMed] [Google Scholar]
- 18.Marciniak TA, Ellerbeck EF, Radford MJ, et al. Improving the quality of care for Medicare patients with acute myocardial infarction: results from the Cooperative Cardiovascular Project. JAMA. 1998;279(17):1351–1357. doi: 10.1001/jama.279.17.1351. [DOI] [PubMed] [Google Scholar]
- 19.LaBresh KA, Ellrodt AG, Gliklich R, Liljestrand J, Peto R. Get with the guidelines for cardiovascular secondary prevention: pilot results. Arch Intern Med. 2004;164(2):203–209. doi: 10.1001/archinte.164.2.203. [DOI] [PubMed] [Google Scholar]
- 20.Levey AS, Bosch JP, Lewis JB, Greene T, Rogers N, Roth D. A more accurate method to estimate glomerular filtration rate from serum creatinine: a new prediction equation. Modification of Diet in Renal Disease Study Group. Ann Intern Med. 1999;130(6):461–470. doi: 10.7326/0003-4819-130-6-199903160-00002. [DOI] [PubMed] [Google Scholar]
- 21.Braunwald E, Antman EM, Beasley JW, et al. ACC/AHA 2002 guideline update for the management of patients with unstable angina and non-ST-segment elevation myocardial infarction--summary article: a report of the American College of Cardiology/American Heart Association task force on practice guidelines (Committee on the Management of Patients With Unstable Angina) J Am Coll Cardiol. 2002;40(7):1366–1374. doi: 10.1016/s0735-1097(02)02336-7. [DOI] [PubMed] [Google Scholar]
- 22.Zeger SL, Liang KY, Albert PS. Models for longitudinal data: a generalized estimating equation approach. Biometrics. 1988;44(4):1049–1060. [PubMed] [Google Scholar]
- 23.Ko DT, Mamdani M, Alter DA. Lipid-Lowering Therapy With Statins in High-Risk Elderly Patients: The Treatment-Risk Paradox. JAMA. 2004;291(15):1864–1870. doi: 10.1001/jama.291.15.1864. [DOI] [PubMed] [Google Scholar]
- 24.Bradley EH, Herrin J, Wang Y, et al. Racial and ethnic differences in time to acute reperfusion therapy for patients hospitalized with myocardial infarction. JAMA. 2004;292(13):1563–1572. doi: 10.1001/jama.292.13.1563. [DOI] [PubMed] [Google Scholar]
- 25.Hirsch AT, Criqui MH, Treat-Jacobson D, et al. Peripheral arterial disease detection, awareness, and treatment in primary care. JAMA. 2001;286(11):1317–1324. doi: 10.1001/jama.286.11.1317. [DOI] [PubMed] [Google Scholar]
- 26.Safford M, Eaton L, Hawley G, et al. Disparities in use of lipid-lowering medications among people with type 2 diabetes mellitus. Arch Intern Med. 2003;163(8):922–928. doi: 10.1001/archinte.163.8.922. [DOI] [PubMed] [Google Scholar]
- 27.Smith NL, Chen L, Au DH, McDonell M, Fihn SD. Cardiovascular risk factor control among veterans with diabetes: the ambulatory care quality improvement project. Diabetes Care. 2004;27(Suppl 2):B33–38. doi: 10.2337/diacare.27.suppl_2.b33. [DOI] [PubMed] [Google Scholar]
- 28.Redelmeier DA, Tan SH, Booth GL. The treatment of unrelated disorders in patients with chronic medical diseases. N Engl J Med. 1998;338(21):1516–1520. doi: 10.1056/NEJM199805213382106. [DOI] [PubMed] [Google Scholar]
- 29.McGlynn EA, Asch SM, Adams J, et al. The Quality of Health Care Delivered to Adults in the United States. N Engl J Med. 2003;348(26):2635–2645. doi: 10.1056/NEJMsa022615. [DOI] [PubMed] [Google Scholar]
- 30.Hayward RA, Asch SM, Hogan MM, Hofer TP, Kerr EA. Sins of omission. J Gen Intern Med. 2005;20(8):686–691. doi: 10.1111/j.1525-1497.2005.0152.x. [DOI] [PMC free article] [PubMed] [Google Scholar]
- 31.Freeman RV, Mehta RH, Al Badr W, Cooper JV, Kline-Rogers E, Eagle KA. Influence of concurrent renal dysfunction on outcomes of patients with acute coronary syndromes and implications of the use of glycoprotein IIb/IIIa inhibitors. J Am Coll Cardiol. 2003;41(5):718–724. doi: 10.1016/s0735-1097(02)02956-x. [DOI] [PubMed] [Google Scholar]
- 32.Collet JP, Montalescot G, Agnelli G, et al. Non-ST-segment elevation acute coronary syndrome in patients with renal dysfunction: benefit of low-molecular-weight heparin alone or with glycoprotein IIb/IIIa inhibitors on outcomes. The Global Registry of Acute Coronary Events. Eur Heart J. 2005;26(21):2285–2293. doi: 10.1093/eurheartj/ehi337. [DOI] [PubMed] [Google Scholar]
- 33.Brown DL. Deaths associated with platelet glycoprotein IIb/IIIa inhibitor treatment. Heart. 2003;89(5):535–537. doi: 10.1136/heart.89.5.535. [DOI] [PMC free article] [PubMed] [Google Scholar]
- 34.Alexander KP, Chen AY, Roe MT, et al. Excess dosing of antiplatelet and antithrombin agents in the treatment of non-ST-segment elevation acute coronary syndromes. JAMA. 2005;294(24):3108–3116. doi: 10.1001/jama.294.24.3108. [DOI] [PubMed] [Google Scholar]
- 35.Lexi-Comp I. Copyright (c) 1978–2007.
- 36.Chertow GM, Lee J, Kuperman GJ, et al. Guided medication dosing for inpatients with renal insufficiency. JAMA. 2001;286(22):2839–2844. doi: 10.1001/jama.286.22.2839. [DOI] [PubMed] [Google Scholar]
- 37.Tonelli M, Moye L, Sacks FM, Kiberd B, Curhan G. Pravastatin for secondary prevention of cardiovascular events in persons with mild chronic renal insufficiency. Ann Intern Med. 2003;138(2):98–104. doi: 10.7326/0003-4819-138-2-200301210-00010. [DOI] [PubMed] [Google Scholar]
- 38.Baigent C, Landray M, Leaper C, et al. First United Kingdom Heart and Renal Protection (UK-HARP-I) study: Biochemical efficacy and safety of simvastatin and safety of low-dose aspirin in chronic kidney disease. Am J Kidney Dis. 2005;45(3):473–484. doi: 10.1053/j.ajkd.2004.11.015. [DOI] [PubMed] [Google Scholar]
- 39.Ahmed A. Use of angiotensin-converting enzyme inhibitors in patients with heart failure and renal insufficiency: how concerned should we be by the rise in serum creatinine? J Am Geriatr Soc. 2002;50(7):1297–1300. doi: 10.1046/j.1532-5415.2002.50321.x. [DOI] [PubMed] [Google Scholar]
- 40.Frances CD, Noguchi H, Massie BM, Browner WS, McClellan M. Are we inhibited? Renal insufficiency should not preclude the use of ACE inhibitors for patients with myocardial infarction and depressed left ventricular function. Arch Intern Med. 2000;160(17):2645–2650. doi: 10.1001/archinte.160.17.2645. [DOI] [PubMed] [Google Scholar]
- 41.Tokmakova MP, Skali H, Kenchaiah S, et al. Chronic kidney disease, cardiovascular risk, and response to angiotensin-converting enzyme inhibition after myocardial infarction: the Survival And Ventricular Enlargement (SAVE) study. Circulation. 2004;110(24):3667–3673. doi: 10.1161/01.CIR.0000149806.01354.BF. [DOI] [PubMed] [Google Scholar]
- 42.Bakris GL, Weir MR. Angiotensin-converting enzyme inhibitor-associated elevations in serum creatinine: is this a cause for concern? Arch Intern Med. 2000;160(5):685–693. doi: 10.1001/archinte.160.5.685. [DOI] [PubMed] [Google Scholar]
- 43.Harding MB, Smith LR, Himmelstein SI, et al. Renal artery stenosis: prevalence and associated risk factors in patients undergoing routine cardiac catheterization. J Am Soc Nephrol. 1992;2(11):1608–1616. doi: 10.1681/ASN.V2111608. [DOI] [PubMed] [Google Scholar]
- 44.BHAT Study Group. A randomized trial of propranolol in patients with acute myocardial infarction. I Mortality results. JAMA. 1982;247(12):1707–1714. doi: 10.1001/jama.1982.03320370021023. [DOI] [PubMed] [Google Scholar]
- 45.Lee TH. Eulogy for a quality measure. N Engl J Med. 2007;357(12):1175–1177. doi: 10.1056/NEJMp078102. [DOI] [PubMed] [Google Scholar]
- 46.Roe MT, Boden W, Chen AY, et al. Is the “Hub-and-Spoke” Model Working? Patterns of Transfer for High-Risk Acute Coronary Syndromes Patients From Community Hospitals Without Revascularization Capacity. J Am Coll Cardiol. 2004;43(5 Suppl A):1A. [Google Scholar]
- 47.Roe MT, Chen AY, Delong ER, et al. Patterns of transfer for patients with non-ST-segment elevation acute coronary syndrome from community to tertiary care hospitals. Am Heart J. 2008 Jul;156(1):185–192. doi: 10.1016/j.ahj.2008.01.033. [DOI] [PubMed] [Google Scholar]
- 48.Winkelmayer WC, Charytan DM, Brookhart MA, Levin R, Solomon DH, Avorn J. Kidney function and use of recommended medications after myocardial infarction in elderly patients. Clin J Am Soc Nephrol. 2006;1(4):796–801. doi: 10.2215/CJN.00150106. [DOI] [PubMed] [Google Scholar]
- 49.Winkelmayer WC, Levin R, Setoguchi S. Associations of kidney function with cardiovascular medication use after myocardial infarction. Clin J Am Soc Nephrol. 2008;3(5):1415–1422. doi: 10.2215/CJN.02010408. [DOI] [PMC free article] [PubMed] [Google Scholar]


