

Abstract
Purpose
To compare high-resolution optical coherence tomography (OCT) and fluorescein angiography (FA) in detection of macular edema (ME) of various etiologies.
Methods
In a retrospective study over a 12-month period at one retina center, data for consecutive eyes that had undergone simultaneous conventional FA (HRA; Heidelberg Engineering, Vista, CA) and StratusOCT (Carl Zeiss Meditec, Dublin, CA) to rule out ME were reviewed. A subset of patients underwent additional examination with extremely high-resolution (6-μm)/ultrahigh-speed spectral OCT/scanning laser ophthalmoscopy (OTI, Inc., Toronto, Ontario, Canada).
Results
Of 1,272 eyes, 1,208 (94.97%) had the finding of ME or subretinal fluid confirmed by both techniques. There were 49 eyes (3.86%) for which FA showed dye leakage in the macular area and OCT showed normal foveal contour. Of 10 eyes in this group that underwent imaging with ultrahigh-speed spectral OCT/scanning laser ophthalmoscopy, 8 had subtle diffuse lucencies in the retina. For 15 eyes (1.17%), OCT showed intraretinal and subretinal fluid, which was missed by FA.
Conclusions
Both FA and high-resolution OCT are highly sensitive techniques and correlate well in detection of ME. However, there is a small chance that when performed alone they might miss existing subtle ME.
Keywords: macular edema, fluorescein angiography, optical coherence tomography
Macular edema (ME) is a common denominator for the decrease of central vision in many diseases affecting the posterior segment of the eye. Intraretinal fluid in the macula can result from subretinal disease such as choroidal neovascularization as well as from diseases causing breakdown of the blood-retina barrier at the level of retinal vessels causing leakage of intraretinal fluid from perifoveal abnormal capillary vessels or microaneurysms, such as aphakic or pseudophakic ME, uveitis, or vascular occlusion.1-6 Most recently, great emphasis has been placed upon detection and changes in intramacular fluid seen in patients with choroidal neovascularization to monitor and guide treatment of that disease with anti-vascular endothelial growth factor agents such as bevacizumab (Avastin; Genentech, Inc., South San Francisco, CA) and ranibizumab (Lucentis; Genentech, Inc.).7,8 ME is clinically defined as an increase in the retinal tissue resulting in an increase in foveal thickness. In its cystoid variant, cystoid macular edema (CME), cystoid changes have a predilection to the outer plexiform layer and the inner nuclear layer.9-11
ME can be diagnosed using noncontact stereoscopic biomicroscopy/contact lens biomicroscopy, fluorescein angiography (FA), and optical coherence tomography (OCT). Although FA can assess ME qualitatively, OCT provides quantitative measurement of foveal thickness.12 Therefore, the pathophysiologic aspect of ME can be determined by FA, and its anatomical features such as the extent of retinal thickening and the retinal layer involved can be assessed best using OCT. Previous studies have shown that both FA and OCT are highly sensitive in detection of ME of various etiologies, with OCT superior to FA according to certain parameters.13-15 The noninvasive character of OCT compared with FA makes it a much more popular option among patients and among some clinicians. With the extensive use of OCT for the diagnosis of ME, there is a tendency toward the less frequent use and even abandoning of FA, especially during frequent follow-up visits. Some indirect observations have also mentioned occasional cases of discrepancy between OCT and FA findings.16-18
Previous studies have carefully compared OCT with clinical examination for detection of ME,19 and small studies have evaluated OCT in comparison with FA. The latter studies either analyzed one cause of ME13 or used OCT2 technology.15,16 We conducted the current study to assess the ability of both techniques to detect ME of various etiologies in cases in which ME has been confirmed by either one of them. We determined the frequency of discrepancy between the two techniques and possible explanations for such discrepancy.
Patients and Methods
Charts of and results of imaging studies for patients from one retina clinic (W.R.F.) who had simultaneously undergone both FA and OCT with a diagnosis of confirmed or suspected ME over a 12-month period (October 1, 2005, to October 1, 2006) were reviewed from a database at the Shiley Eye Center, University of California at San Diego (La Jolla, CA). The causes of ME included diabetes, central or branch vein occlusion, uveitis, and dye leakage associated with choroidal neovascularization syndromes. Approval for this review was obtained from the Institutional Review Board of the University of California at San Diego.
A conventional fundus camera (TRC-50VT; Topcon Corporation, Tokyo, Japan) was used for color fundus photography, and the HRA confocal scanning laser ophthalmoscope (Heidelberg Engineering, Vista, CA) was used for FA. For high-resolution OCT, we used the StratusOCT (Model 3000; Carl Zeiss Meditec, Dublin, CA) with axial and transversal resolutions of ≈10 μm and 20 μm, respectively. Upon availability of instrumentation, a subset of patients underwent imaging using extremely high-resolution/ultrahigh-speed spectral OCT/scanning laser ophthalmoscopy (OTI, Inc., Toronto, Ontario, Canada) with an axial tissue resolution of 6 μm.
For FA, we used a standard late-phase frame technique, and the presence of edema was evaluated by comparing early-phase and late (10-minute)-phase frames. The presence of late-phase leakage in the fovea of the perifoveal area defined ME. For StratusOCT, the macular map protocol of 6 slow (512 A-scans per B-scan) radial scans was used centered over the fovea. Retinal thickness measurements between single scans are interpolated to calculate a topographic macular thickness. All poor-quality FA and OCT images or OCT scans not exactly centered were excluded from the analysis. ME was defined as a loss of central foveal contour, presence of intraretinal cysts, subretinal fluid, or diffuse thickening of the foveal and perifoveal area of >250 μm. The FA and OCT images had to be taken the same day, and only the first examination per patient per year was analyzed.
For all eyes, four independent retina trained specialists, separately, in 2 groups (I.K. and V.L.M.; and B.L. and I.F.), and on separate occasions, evaluated the presence of ME on both FA and OCT images from the screen monitors of one instrument at a time. Stereo viewers were used for the evaluation of ME by FA. The paired graders discussed their grading while reading the images on the screen but did not consult graders in the other group. The consensus of presence or absence of edema was agreed upon in all cases, based on the above-mentioned definition of ME. The outcome was “ME present” or “ME absent.” We then calculated κ of agreement between the two groups of graders using observed and expected percent agreement. Because a true gold standard does not exist, we determined the sensitivity of both techniques by using the presence of ME determined by either instrument as the gold standard for the presence of ME and the absence of ME determined by both instruments as a true-negative finding.
Results
Six hundred fifty-four simultaneous, good-quality FA/OCT examinations (618 bilateral) were included in the study (309 men; 345 women). We excluded 35 eyes due to poor quality or image decentration. Only one examination (the first chronological) was analyzed if the patient underwent scanning several times during the 12-month period. The average age of all patients ± SD was 54 ± 12.1 years.
Of 1,272 eyes (654 patients; 36 unilateral examinations), 1,208 (94.97%) had confirmation of the diagnosis of ME by both techniques. Sensitivity of OCT for CME was 96.1% and that of FA for CME was 98.7%, after pooling data from both groups of masked evaluators. κ for interrater reliability using percent agreement was 0.90. There were 49 eyes (3.86%) for which FA showed dye leakage in the macular area and both B-scanning and retinal map OCT showed normal foveal contour and normal thickness of the adjacent retina (Figs. 1-5; Table 1). For 15 eyes in the whole cohort (1.17%), OCT showed intraretinal as well as subretinal fluid, which was missed by FA (Figs. 7-10; Table 1). Most cases of discrepancy were found in age-related macular degeneration and diabetes, with FA being more sensitive than OCT for diabetic ME and equal for age-related macular degeneration (Table 2). Of 10 eyes in the group that underwent imaging with extremely high-resolution/ultrahigh-speed spectral OCT/scanning laser ophthalmoscopy, 8 had subtle diffuse lucencies in the retina (Fig. 6).
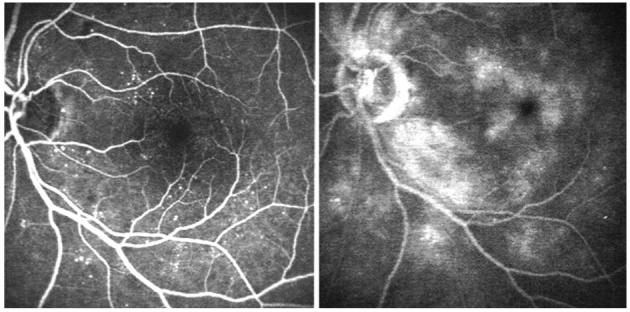
Fig. 1.
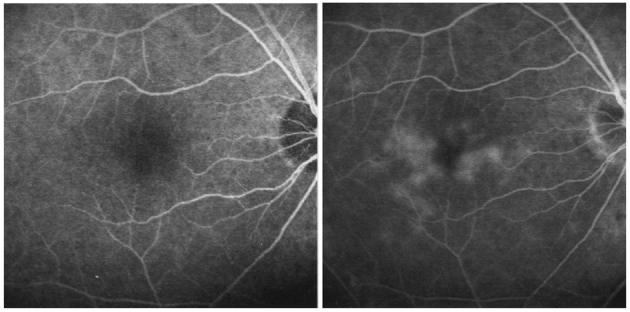
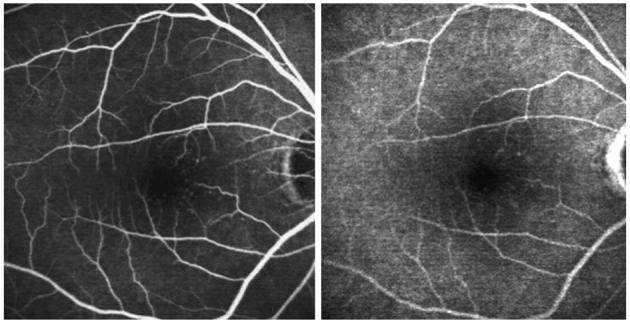
Left, Early-phase fluorescein angiography of the right eye of a patient with chronic uveitis. Right, Late-phase fluorescein angiography of the same eye showing leakage of the dye associated with macular edema.
Fig. 5.
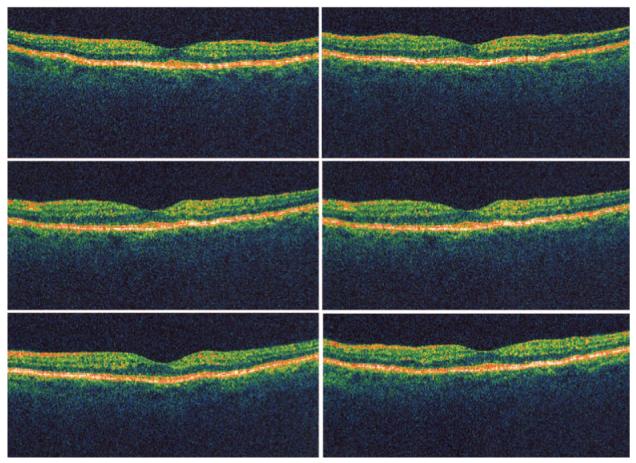
Six radial optical coherence tomography scans of the eye from Figure 4 showing normal foveal architecture with absence of retinal fluid or thickening.
Table 1.
Presence or Absence of ME Detected by FA and OCT
| ME Present by FA | ME Absent by FA | |
|---|---|---|
| ME present by OCT | 1,208 (94.97) | 15 (1.17) |
| ME absent by OCT | 49 (3.86) | 0 |
Data are no. (%) of eyes.
ME, macular edema; FA, fluorescein angiography; OCT, optical coherence tomography.
Fig. 7.
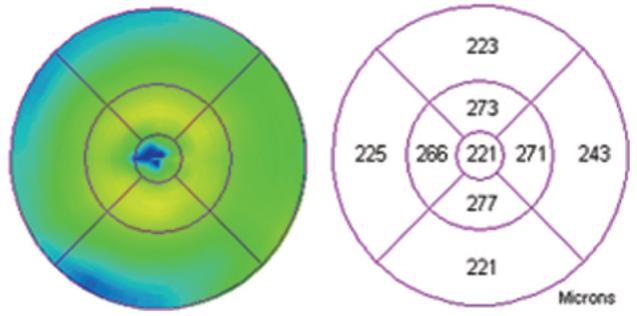
Retinal map analysis of the eye from Figure 4 showing largely normal thickness of the fovea and perifoveal area.
Fig. 10.
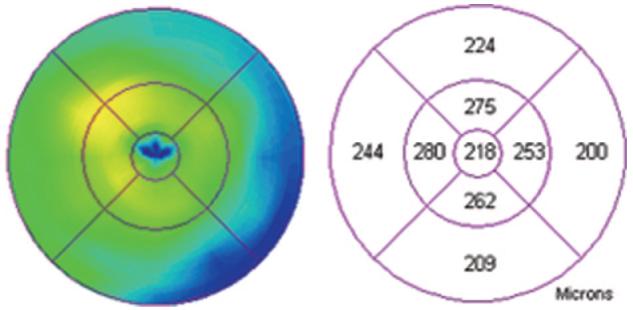
Retinal map analysis of the eye from Figure 8 showing normal thickness of the fovea and slight segmental elevation of the perifoveal area.
Table 2.
Distribution of Causes of Macular Edema in Studied Cohort and Proportional Occurrence of Discrepancy Between FA and OCT in Detection of Macular Edema
| Diagnosis | No. (%) of Eyes in the Cohort | No. (%) of Eyes With Discrepancy | Total No. (%) of Eyes per Diagnosis | No. (%) of Eyes Detected by FA, Missed by OCT | No. (%) of Eyes Detected by OCT, Missed by FA |
|---|---|---|---|---|---|
| Diabetes | 620 (48.7) | 27 (42.2) | 4.3 | 25 (51.0) | 2 (13.3) |
| AMD | 541 (42.6) | 27 (42.2) | 5.0 | 14 (28.6) | 13 (86.7) |
| Uveitis | 48 (3.8) | 6 (9.4) | 12.5 | 6 (12.2) | 0 |
| Vein occlusion | 39 (3.1) | 4 (6.2) | 10.2 | 4 (8.2) | 0 |
| Pseudophakia | 21 (1.6) | 0 | 0 | 0 | 0 |
| Others* | 3 (0.2) | 0 | 0 | 0 | 0 |
| Total | 1,272 (100) | 64 (5.03) | NA | 49 (3.86) | 15 (1.17) |
FA, fluorescein angiography; OCT, optical coherence tomography; AMD, age-related macular degeneration; NA, not applicable.
Including radiation retinopathy, idiopathic papilledema, toxic maculopathy, and status post retinal detachment repair.
Fig. 6.
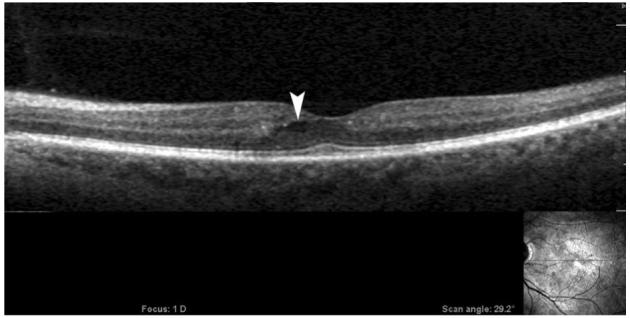
An image from extremely high-resolution/ultrahigh speed spectral optical coherence tomography/scanning laser ophthalmoscopy (OTI, Inc., Toronto, Ontario, Canada) of the patient in Figure 3 showing a pocket of fluid surrounded by lucency of the retinal tissue in the area of leakage on a fluorescein angiogram (white arrowhead) that was not detected by StratusOCT (Model 3000; Carl Zeiss Meditec, Dublin, CA). Horizontal scan is shown in the right-lower-corner inset.
Discussion
It is commonly recognized that the clinical assessment of ME may be subjective and variable. According to earlier reports, stereoscopic fundus examination usually only detects retinal thickening of ≈100 μm.20 Using comparison between contact lens biomicroscopy and OCT in detection of diabetic ME, Brown et al21 found overall agreement between the results of the two methods to be 69%, which was only 23% in cases of mild foveal thickening and 85% when the eyes with mild foveal thickening were excluded. This suggests that contact lens biomicroscopy is relatively insensitive for detection of mild foveal thickening apparent by OCT.
Another well-known diagnostic approach to detect ME is FA, which is known to be a sensitive method for the qualitative assessment of fluid leakage.22 However, actual macular thickening is better correlated with loss of visual acuity. In addition, the information provided by FA is qualitative, and interpretation of the results may be subjective. In a comparison of the two methods for detection of ME in diabetic patients, Ozdek et al13 found that the sensitivity of OCT was higher than that of FA, especially for the cystoid pattern of ME.
In our clinical practice, we noticed some discrepancy in the findings between OCT and FA in detection of ME. We observed cases in which FA showed obvious patterns of macular leakage but lacked any corresponding changes in retinal thickness by OCT. The scans sectioned the areas that were leaking by FA, excluding the sampling error. The same phenomenon was recently reported by Lehmer (AAO meeting poster 346), who described vision loss due to ME that was not detected by OCT in seven eyes using StratusOCT only. In our cohort 1,272 eyes were analyzed over a 12-month period, and this phenomenon was seen in 3.85% of eyes.
We have also studied the reverse phenomenon and have seen that in some cases FA can miss intraretinal fluid and, especially, subretinal fluid apparent by OCT. The prevalence of the latter was much smaller (1.17%). Even though only results from good-quality examinations were included, some of these could represent images obtained after difficult venous access when not all fluorescein volume was injected (when the fluorescein signal is weaker and gain must be increased to be able to see fluorescein in the circulation). Another explanation may be the presence of so-called tractional CME, which is a variant of the vitreomacular traction syndrome. This is a well-recognized complication of partial posterior vitreous detachment, which remains adherent to the foveola and in which fluorescein leakage is often minimal or absent.23,24 Angiographically negative ME also has been seen in drug toxicity.25,26
On the other hand, agreement between the two techniques was high—almost 95%. Sensitivity of OCT for CME detection was 96.1% and that of FA was 98.7%. We calculated κ, which is most often used to measure agreement between a binary variable. Its value was 0.9, which represents very good agreement among the two grading groups.27
An observation similar to ours relating to FA/OCT discrepancy was reported previously by Eter and Spaide26 during a comparison of FA and OCT after photodynamic therapy. Even though macular cystoid changes were detected better by OCT than by FA, some of their patients had leakage by FA that did not have any observable OCT abnormality attributable to fluid accumulation. This might have been the result of the subtle diffusion of dye that does not produce or is not associated with retinal tissue changes, which could be detected by available OCT resolution. We might assume a similar mechanism in our cases. The difference is, perhaps, that the retinal condition in most of them had been long standing and that morphologic changes had had time to occur as opposed to a recent intervention like photodynamic therapy in the above-mentioned report. As shown in Table 2, none of the studied diagnoses showed propensity to this discrepancy, even though some diagnoses were underrepresented. However, FA in retinovascular diseases such as diabetes is more sensitive than in age-related macular degeneration. The same trend was seen in uveitis and vein occlusion, but small numbers in these subgroups preclude parallel conclusions. It may be that leaky vessels in these diseases cause more diffuse dye infiltration into the tissue, whereas pockets of fluid are more common in age-related macular degeneration. Similarly, Soliman et al28 found that early morphologic changes in diabetic ME may be seen better with FA than with OCT.
The pathophysiology of ME may include excessive fluid leakage from vessels, abnormal mechanisms of removing fluid, sequestration of fluid, or a combination of these. Especially in diseased retina, fluorescein flows out of the vessels to lie in pools in the cystic spaces or stains the edematous (noncystic) retinal tissue. Disruption of the blood-retina barrier leads to protein and fluid entering the extracellular space, and the subsequent binding of water to large osmotically active molecules results in retinal thickening. According to recent observations by Otan and Kishi,29 in diabetic ME, dye pooling within a petaloid pattern in the fovea corresponds to cystic spaces in the outer plexiform layer, and a honey-comb pattern corresponds to cystic spaces in the inner plexiform layer. Fluorescein staining of noncystoid edema is diffuse and irregular and not confined to well-demarcated spaces. This could, therefore, be missed by the current resolution capacity of commercially available OCT instruments.
When some of the patients underwent scanning with ultrahigh-speed spectral OCT/scanning laser ophthalmoscopy, which has higher resolution than StratusOCT, we could identify more lucencies in the retina in areas, which corresponded to leakage by FA. We assume that the lucencies actually represent retinal areas where dye accumulates in the absence of cystic changes. Expansion of the intracellular fluid space may also lead to CME, and accumulation of fluid in the intracellular space may lead to CME without evidence of leakage by FA. Fine and Brucker30 performed a light and electron microscopic study on eyes with CME and assumed that the fluorescein dye probably accumulated within edematous Müller cells. Retinal swelling without cystic spaces, as seen by retinal lucency, may therefore represent dye accumulation in the swollen Müller cells.
In summary, OCT has gained widespread popularity in detection of macular changes in various diseases. It is a safe, noninvasive, and rapid technology that provides objective documentation of foveal and retinal morphology. In some practices, it is an alternative to FA in the follow-up of changes in retinal thickness. However, it does not provide information about the perfusion state of the retina and occasionally can miss foveal changes as demonstrated by this study. We, therefore, recommend the use of both techniques in the detection of macular changes.
Fig. 2.
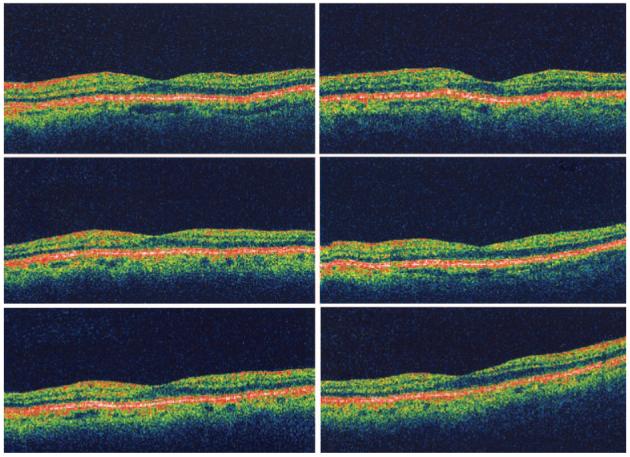
Six radial optical coherence tomography scans of the eye from Figure 1 showing normal foveal architecture with absence of retinal fluid or thickening.
Fig. 3.
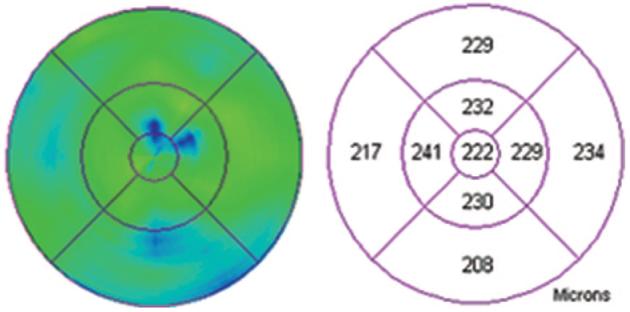
Retinal map analysis of the eye from Figure 1 showing normal thickness of the fovea and perifoveal area.
Fig. 4.
Left, Early-phase fluorescein angiography of the right eye of a patient with nonproliferative diabetic retinopathy. Right, Late-phase fluorescein angiography of the same eye showing perifoveal leakage of the dye.
Fig. 8.
Left, Early-phase fluorescein angiography of the right eye of a patient with perifoveal diabetic microangiopathy. Right, Late-phase fluorescein angiography of the same eye showing staining of the microaneurysms.
Fig. 9.
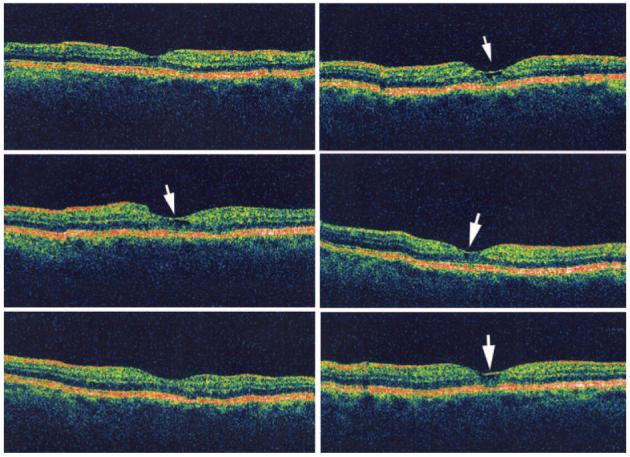
Six radial optical coherence tomography scans of the eye from Figure 6 showing a small pocket of retinal fluid (white arrows on scans where visible) not detected by fluorescein angiography.
Acknowledgments
Supported in part by an unrestricted grant from Research to Prevent Blindness, Inc. (New York, NY), to the University of California at San Diego.
References
- 1.Bresnick GH. Diabetic macular edema: a review. Ophthalmology. 1986;93:989–997. doi: 10.1016/s0161-6420(86)33650-9. [DOI] [PubMed] [Google Scholar]
- 2.Van de Moere A, Sandhu SS, Talks SJ. Correlation of optical coherence tomography and fundus fluorescein angiography following photodynamic therapy for choroidal neovascular membranes. Br J Ophthalmol. 2006;90:304–306. doi: 10.1136/bjo.2005.079947. [DOI] [PMC free article] [PubMed] [Google Scholar]
- 3.Taban M, Thomas EL, Boyer DS, et al. Efficacy of verteporfin photodynamic therapy on laser-induced choroidal neovascularization and the ancillary effect on diabetic microvasculopathy. Curr Eye Res. 2004;28:291–295. doi: 10.1076/ceyr.28.4.291.27829. [DOI] [PubMed] [Google Scholar]
- 4.Taylor DM, Sachs SW, Stern AL. Aphakic cystoid macular edema. Long-term clinical observations. Surv Ophthalmol. 1984;28:437–441. doi: 10.1016/0039-6257(84)90225-x. [DOI] [PubMed] [Google Scholar]
- 5.Traill A, Stawell R, Hall A, Zamir E. Macular thickening in acute anterior uveitis. Ophthalmology. 2007;114:402. doi: 10.1016/j.ophtha.2006.07.028. [DOI] [PubMed] [Google Scholar]
- 6.Chen SD, Sundaram V, Lochhead J, Patel CK. Intravitreal triamcinolone for the treatment of ischemic macular edema associated with branch retinal vein occlusion. Am J Ophthalmol. 2006;141:876–883. doi: 10.1016/j.ajo.2005.12.011. [DOI] [PubMed] [Google Scholar]
- 7.Lazic R, Gabric N. Intravitreally administered bevacizumab (Avastin) in minimally classic and occult choroidal neovascularization secondary to age-related macular degeneration. Graefes Arch Clin Exp Ophthalmol. 2007;245:68–73. doi: 10.1007/s00417-006-0466-4. [DOI] [PubMed] [Google Scholar]
- 8.Rosenfeld PJ, Rich RM, Lalwani GA. Ranibizumab: phase III clinical trial results. Ophthalmol Clin North Am. 2006;19:361–372. doi: 10.1016/j.ohc.2006.05.009. [DOI] [PubMed] [Google Scholar]
- 9.Newsom WA, Hood CI, Horwitz JA, Fine SL, Sewell JH. Cystoid macular edema: histopathologic and angiographic correlations. A clinicopathologic case report. Trans Am Acad Ophthalmol Otolaryngol. 1972;76:1005–1009. [PubMed] [Google Scholar]
- 10.Frangieh GT, Green WR, Engel HM. A histopathologic study of macular cysts and holes. Retina. 1981;1:311–336. [PubMed] [Google Scholar]
- 11.Wolter JR. The histopathology of cystoid macular edema. Albrecht Von Graefes Arch Klin Exp Ophthalmol. 1981;216:85–101. doi: 10.1007/BF00414576. [DOI] [PubMed] [Google Scholar]
- 12.Hee MR, Puliafito CA, Wong C, et al. Quantitative assessment of macular edema with optical coherence tomography. Arch Ophthalmol. 1995;113:1019–1029. doi: 10.1001/archopht.1995.01100080071031. [DOI] [PubMed] [Google Scholar]
- 13.Ozdek SC, Erdinc MA, Gurelik G, et al. Optical coherence tomographic assessment of diabetic macular edema: comparison with fluorescein angiographic and clinical findings. Ophthalmologica. 2005;219:86–92. doi: 10.1159/000083266. [DOI] [PubMed] [Google Scholar]
- 14.Massin P, Girach A, Erginay A, Gaudric A. Optical coherence tomography: a key to the future management of patients with diabetic macular oedema. Acta Ophthalmol Scand. 2006;84:466–474. doi: 10.1111/j.1600-0420.2006.00694.x. [DOI] [PubMed] [Google Scholar]
- 15.Kang SW, Park CY, Ham DI. The correlation between fluorescein angiographic and optical coherence tomographic features in clinically significant diabetic macular edema. Am J Ophthalmol. 2004;137:313–322. doi: 10.1016/j.ajo.2003.09.016. [DOI] [PubMed] [Google Scholar]
- 16.Antcliff RJ, Stanford MR, Chauhan DS, et al. Comparison between optical coherence tomography and fundus fluorescein angiography for the detection of cystoid macular edema in patients with uveitis. Ophthalmology. 2000;107:593–599. doi: 10.1016/s0161-6420(99)00087-1. [DOI] [PubMed] [Google Scholar]
- 17.Surguch V, Gamulescu MA, Gabel VP. Optical coherence tomography findings in idiopathic juxtafoveal retinal teleangiectasis. Graefes Arch Clin Exp Ophthalmol. 2007;245:783–788. doi: 10.1007/s00417-006-0432-1. [DOI] [PubMed] [Google Scholar]
- 18.Paunescu LA, Ko TH, Duker JS, et al. Idiopathic juxtafoveal retinal teleangiectasis. New findings by ultra-high resolution optical coherence tomography. Ophthalmology. 2006;113:48–57. doi: 10.1016/j.ophtha.2005.08.016. [DOI] [PMC free article] [PubMed] [Google Scholar]
- 19.Hee MR, Puliafito CA, Duker JS, et al. Topography of diabetic macular edema with optical coherence tomography. Ophthalmology. 1998;105:360–370. doi: 10.1016/s0161-6420(98)93601-6. [DOI] [PMC free article] [PubMed] [Google Scholar]
- 20.Shahidi M, Ogura Y, Blair NP, et al. Retinal thickness analysis for quantitative assessment of diabetic macular edema. Arch Ophthalmol. 1991;109:1115–1119. doi: 10.1001/archopht.1991.01080080075032. [DOI] [PubMed] [Google Scholar]
- 21.Brown JC, Solomon SD, Bressler SB, et al. Detection of diabetic foveal edema: contact lens biomicroscopy compared with optical coherence tomography. Arch Ophthalmol. 2004;122:330–335. doi: 10.1001/archopht.122.3.330. [DOI] [PubMed] [Google Scholar]
- 22.Maumenee AE. Further advances in the study of the macula. Arch Ophthalmol. 1967;78:151–165. doi: 10.1001/archopht.1967.00980030153008. [DOI] [PubMed] [Google Scholar]
- 23.Johnson MW. Tractional cystoid macular edema: a subtle variant of the vitreomacular traction syndrome. Am J Ophthalmol. 2005;140:184–192. doi: 10.1016/j.ajo.2005.01.033. [DOI] [PubMed] [Google Scholar]
- 24.Joshi MM, Garretson BR. Paclitaxel maculopathy. Arch Ophthalmol. 2007;125:709–710. doi: 10.1001/archopht.125.5.709. [DOI] [PubMed] [Google Scholar]
- 25.Teitelbaum BA, Tresley DJ. Cystic maculopathy with normal capillary permeability secondary to docetaxel. Optom Vis Sci. 2003;80:277–279. doi: 10.1097/00006324-200304000-00004. [DOI] [PubMed] [Google Scholar]
- 26.Eter N, Spaide RF. Comparison of fluorescein angiography and optical coherence tomography for patients with choroidal neovascularization after photodynamic therapy. Retina. 2005;25:691–696. doi: 10.1097/00006982-200509000-00002. [DOI] [PubMed] [Google Scholar]
- 27.Byrt T. How good is agreement? [letter to editor] Epidemiology. 1996;7:561. doi: 10.1097/00001648-199609000-00030. [DOI] [PubMed] [Google Scholar]
- 28.Soliman W, Sander B, Hasler PW, Larsen M. Correlation between intraretinal changes in diabetic macular oedema seen in fluorescein angiography and optical coherence tomography. Acta Ophthalmol Scand. 2008;86:34–39. doi: 10.1111/j.1600-0420.2007.00989.x. [DOI] [PubMed] [Google Scholar]
- 29.Otani T, Kishi S. Correlation between optical coherence tomography and fluorescein angiography findings in diabetic macular edema. Ophthalmology. 2007;114:104–107. doi: 10.1016/j.ophtha.2006.06.044. [DOI] [PubMed] [Google Scholar]
- 30.Fine BS, Brucker AJ. Macular edema and cystoid macular edema. Am J Ophthalmol. 1981;92:466–481. doi: 10.1016/0002-9394(81)90638-3. [DOI] [PubMed] [Google Scholar]