

Abstract
Arginase has been suggested to compete with nitric oxide synthase (NOS) for their common substrate, L-arginine. To study the mechanisms underlying this interaction, we compared arginase expression in isolated airways and the consequences of inhibiting arginase activity in vivo with NO production, lung inflammation, and lung function in both C57BL/6 and NOS2 knockout mice undergoing ovalbumin-induced airway inflammation, a mouse model of asthma.
Arginases I and II were measured by western blot in isolated airways from sensitized C57BL/6 mice exposed to ovalbumin aerosol. Physiological and biochemical responses---inflammation, lung compliance, airway hyperreactivity, exhaled NO concentration, arginine concentration--were compared with the responses of NOS2 knockout mice. NOS2 knockout mice had increased total cells in lung lavage, decreased lung compliance, and increased airway hyperreactivity. Both arginase I and arginase II were constitutively expressed in the airways of normal C57BL/6 mice. Arginase I was up-regulated approximately 8-fold in the airways of C57BL/6 mice exposed to ovalbumin. Expression of both arginase isoforms were significantly upregulated in NOS2 knockout mice exposed to ovalbumin, with about 40- and 4-fold increases in arginases I and II, respectively. Arginine concentration in isolated airways was not significantly different in any of the groups studied. Inhibition of arginase by systemic treatment of C57BL/6 mice with a competitive inhibitor, Nω-hydroxy-nor-L-arginine (nor-NOHA), significantly decreased the lung inflammatory response to ovalbumin in these animals.
We conclude that NOS2 knockout mice are more sensitive to ovalbumin-induced airway inflammation and its sequelae than are C57BL/6 mice, as determined by increased total cells in lung lavage, decreased lung compliance, and increased airway hyperreactivity, and that these findings are strongly correlated with increased expression of both arginase isoforms in the airways of the NOS2 knockout mice exposed to ovalbumin.
Keywords: asthma, nitric oxide, animal model, airway inflammation, eosinophils, airway hyperreactivity
INTRODUCTION
The roles of nitric oxide (NO) in lung injury and repair are highly controversial. Exhaled NO is presently being used as a biomarker for assessing severity of asthma, and drugs that suppress the activity of nitric oxide synthases are in clinical trials for treatment of asthma and various other lung diseases. However, we still do not know whether increased NO in the lung is bad or good. There are three isoforms of nitric oxide synthase present in the lung [Vercelli, 2003] that convert L-arginine into NO and L-citrulline. Thus, production of NO may be regulated by a combination of the amount of active nitric oxide synthase (NOS) enzyme available, and the availability of the substrate for NOS, L-arginine. Arginine levels, in turn, are thought to be regulated by the enzyme arginase, which exists in two isoforms called I and II. The arginase enzymes convert L-arginine into L-ornithine and urea and are thought to be capable of indirectly regulating NO production by competing with NOS for arginine [King et al., 2004; Ricciardolo, 2003; Meuers et al., 2003]. The interplay between the two pathways is thought to be rate limiting for the generation of NO [Meuers et al., 2003].
Changes in arginase gene expression in the lung have been linked to asthma both in clinical studies of human patients and in mouse models of allergen-induced airway inflammation. Expression of arginase is up-regulated by IL-4 and IL-13 during allergic inflammation, which is believed to decrease the amount of arginine available for production of NO [King et al., 2004]. In a seminal study, Zimmerman et al. reported that lung tissue from Balb/c mice undergoing allergen (either ovalbumin or A. fumigatis)-induced experimental asthma expressed higher levels of the mRNAs for arginases I and II, as evaluated by gene array analysis [Zimmermann et al., 2003]. The relative increase in mRNA expression for arginase I between ovalbumin- and saline-treated mice was about 10-fold higher than that for arginase II [King et al., 2004]. These observations have been confirmed at the protein level by Zimmerman et al. [2003] and by Fajardo et al. [2004], who found increased arginase I (but apparently not arginase II) in the lungs of C57BL/6 mice treated with ovalbumin. In patients with asthma, elevated serum arginase activity coincides with a decrease in plasma arginine levels [Morris et al., 2004].
A paradigm has emerged that allergen-induced airway inflammation should show a peak inflammatory response at which time recruitment of leukocytes into the lung reaches peak values, airway hyperreactivity is increased, arginase and NOS2 content of the airways are at maximal amounts, and arginine concentration in the airways is at minimal amounts. While the individual components of this paradigm have been demonstrated, the relevant literature combines data from a wide range of different animal models, human samples, cell culture studies, gene array data as a surrogate for the relevant enzymes themselves, and work from several different laboratories.
Ovalbumin-induced airway inflammation in the mouse provides a readily available animal model of asthma that allows us to test this paradigm under consistent well-controlled experimental conditions. Our prior experience with this model [Kenyon et al., 2002, 2003a, 2003b] encouraged us to test the overarching hypothesis that arginase regulates the production of NO by NOS2 in the airways of mice undergoing allergen-induced airway inflammation. In our earlier work we have demonstrated that NOS2-knockout mice are more sensitive to ovalbumin-induced airway inflammation than are their wild-type C57BL/6 counterparts (Kenyon et al., 2003b) and that increased expression of arginase in isolated airways prepared from the lungs of ovalbumin-exposed Balb/c mice was correlated with levels of lung inflammation in these mice Kenyon et al., 2008). These observations prompted us to ask whether the differences we had previously observed in response to ovalbumin exposure in the NOS2 knockout animals was also related to levels of arginase expression in their airways.
To perform this analysis we examined allergic inflammatory cell populations obtained from whole lung by lavage, arginase I and II enzyme expression and arginine concentration in isolated airway preparations, lung compliance and airway hyperreactivity measurements in response to methacholine challenge, and the concentration of exhaled NO in the breath of the mice. These parameters were measured after 2 weeks of challenge with ovalbumin, the time of peak inflammatory response in this model, to examine the interaction of each of these responses.
To focus on the possible role of NOS2-derived NO in the measured responses, we studied two strains of mice: C57BL/6 and a NOS2 knockout (NOS2−/−) line derived from the C57BL/6 mice. We first tested the hypothesis that the known greater inflammatory response of the NOS2−/− mice at 2 weeks of exposure to ovalbumin aerosol in our model [Kenyon et al., 2003b] would be accompanied by greater decrements in pulmonary function and larger changes in arginine and NO metabolism. Then, we tested the second hypothesis that the content of the arginase I and/or arginase II enzymes would be increased in the lungs of sensitized mice exposed to ovalbumin aerosol. Finally, we tested the third hypothesis that average concentrations of arginine in the conducting airways of mice exposed to ovalbumin would be lower during the peak inflammatory response, due to increased levels of arginase in the airway inflammatory and epithelial cells, as compared to concentrations in matched control animals, and that these changes would return back towards normal levels with continued exposure.
EXPERIMENTAL PROCEDURES
Animals
C57BL/6 mice (25–30 g, adult 8–12 wk old males) were purchased from Charles River Wilmington, MA), certified as chronic respiratory disease free by the supplier, and routinely screened for health status by serology and histology by our veterinary animal resources facility. Details of animal housing and care have been described previously [Kenyon et al., 2003b]. Mice were euthanized at the end of an experiment with an intraperitoneal (ip) overdose of pentobarbital. The NOS2−/− strain used (designated C57BL/6 Ai-[KO]NOS2N5) has been described previously [Kenyon et al., 2002]. In the experiments with NOS2−/− mice we used both male and female littermates derived from our own colony; male age-matched C57BL/6 animals were used. There was no significant difference between male and female animals in response to ovalbumin in any of the assays we used.
Exposure of mice to ovalbumin aerosol
Mice were exposed to ovalbumin aerosol after prior sensitization by ip injection of ovalbumin (2 × 10 μg/0.1 mL, 2 weeks apart). Exposure to ovalbumin aerosols was performed using chambers and generators we have described elsewhere [Kenyon et al, 2003b]. Exposures to ovalbumin aerosol were performed as described elsewhere (Kenyon et al. (2008). Age-matched control animals were injected ip with ovalbumin + alum adjuvant (sensitized) and were exposed only to filtered air. Preliminary experiments demonstrated comparable responses in control mice exposed to either filtered air or to PBS aerosols, and significantly increased plasma IgE concentrations in sensitized mice exposed to ovalbumin aerosols.
Whole lung lavage
Mice were killed by an overdose of phenobarbital and dilantin administered ip. Animals were placed on a restraining board and the lungs were lavaged with a total of 2 mL of phosphate-buffered saline (pH=7.4), as described previously [Kenyon et al., 2003b]. The total viable (trypan blue exclusion) lavaged cell number was counted with a hemacytometer and the cell differentials were examined in cytocentrifuge preparations as described previously [Kenyon et al., 2003b]. Aliquots (100 μl) of this cell suspension were processed onto glass slides in a cytocentrifuge at 1,650 rpm for 15 minutes, then stained with hematoxylin and eosin according to the manufacturer’s instructions using the Protocol Hema3 Stain Set (Fisher Scientific Company, Kalamazoo, MI), and protected with coverslips. Cells were classified as pulmonary alveolar macrophages, polymorphonuclear leukocytes (neutrophils), eosinophils, lymphocytes, or “other” based upon staining color and characteristic morphology.
Measurement of exhaled NO and nitrate/nitrite
We collected a 5-minute sample of exhaled gases from the exhalation port of the ventilator immediately after insertion of a mouse into the plethysmograph. NO, nitrate, and nitrite, were determined using the Sievers NO Analyzer (Sievers, Boulder, CO) [Silkoff et al., 1999; Kenyon et al., 2008].
Lung compliance and resistance measurements
We measured dynamic compliance and resistance of the respiratory system with a plethysmograph for restrained animals. (Buxco Inc., Troy, NY) as described previously (Kenyon et al., 2008). Compliance and resistance measurements were made at baseline and immediately following serial 3-minute nebulizations of saline and methacholine (0.1–2.0 mg/ml), as described elsewhere [Schuster et al., 2008].
Western blot analysis of tissue
Isolated airways were prepared and analyzed as described in detail previously with minor modifications (Kenyon et al., 2008). Supernantant total protein concentration was determined by BCA assay and aliquots of 20 μg of total protein were removed and diluted in 4x loading buffer. Samples were incubated at 65°C for 15 min and electroporated under reducing conditions. The membranes were incubated in 0.4 μg/ml of goat, anti-mouse arginase I, 0.4 μg/ml of goat, anti-mouse arginase II, or 0.4 μg/ml of rabbit anti-mouse α-actinin IgG in blocking solution overnight at 4°C. The membranes were then incubated in 40 ng/ml horseradish peroxidase (HRP)-conjugated donkey anti-goat IgG (Pierce Biotechnology, IL) or 40 ng/ml of horseradish peroxidase (HRP)-conjugated goat anti-rabbit IgG (Pierce Biotechnology, IL). Bands were visualized using Immobilon western chemiluminescent HRP substrate kit (Millipore) and digitally converted for integrated band intensity calculation using Image J version 1.38 (free access program provided by NIH). Equal loading of samples was confirmed by staining for α-actinin.
Tissue arginine measurements
Aliquots of supernatants containing 50 μg of total protein were prepared from homogenates of isolated microdissected airways, deproteinized with 4 volumes of acetone, and evaporated to dryness in a vacuum centrifuge. These deproteinized samples were analyzed for their content of basic amino acids by HPLC after pre-column derivatization with phenylisothiocyanate as described previously [Sarwar and Botting, 1990].
Inhibition of arginase activity
Mice were sensitized to ovalbumin by i.p. injection as described above and divided into four groups: PBS injected/filtered air-exposed, PBS injected/ovalbumin-exposed, Nω-hydroxy-nor-L-arginine (nor-NOHA) injected/filtered air-exposed, nor-NOHA injected/ovalbumin-exposed. Cohorts were administered either 100 μg of nor-NOHA/0.1 ml PBS or 0.1 ml of PBS alone via ip injection 30 min prior to each challenge (ovalbumin aerosol or filtered air). All subsequent processing of mice after the final aerosol or filtered air challenge was the same as described above.
Statistical analysis of data
Results are presented as mean values±SEM. Means were compared by t-test or ANOVA, with Tukey’s correction for multiple comparisons and Bartlett’s test for differing variance in the data applied where appropriate (Graphpad Prism 4.0, San Diego, CA). A P value of 0.05 or less was taken to indicate significance. Analysis of data for correlation was by linear regression analysis, using the Prism software package.
RESULTS
Ovalbumin exposure and inflammation
We have previously described the response of C57BL/6 and NOS2−/− mice to ovalbumin exposure [Kenyon et al., 2003b]. In that study, we primarily focused on the lung’s inflammatory and fibrotic responses in both of these mouse strains after 4–10 weeks of exposure to ovalbumin. The time course of this response in the C57BL/6 mice showed a significant increase in total cells in the lavage fluid after 1 week of exposure [Kenyon et al., 2003b], with a gradual increase occurring between the first and second week. There was then a gradual decrease in total lavage cells over time until 4 weeks, where we found a significant (P<0.05) decrease in total cells in the lavage fluid as compared to the values at 2 weeks. In the current study we focused mainly on inflammatory, biochemical, and functional responses of the lung after 2 weeks of exposure to ovalbumin, when the peak inflammatory response occurs. The total cells in the lavage fluid for the OVA-exposed animals (451,000±53,800) are significantly higher than the air controls (51,900±5,490) after the 2-week duration of exposure.
Differential cell counts of the cells in the lavage fluid demonstrate a significant increase in the percentage of eosinophils as compared to air controls after 2 weeks of exposure, as shown in Figure 1. The total numbers of eosinophils present in the lung are significantly increased after 2 weeks; total eosinophils may be calculated by multiplying % eosinophils as shown in Figure 1 by total cells in the lavage fluid (see above).
Figure 1.

Percentage of eosinophils in lung lavage fluid from C57BL/6 and NOS2−/− mice exposed to ovalbumin aerosol for 2 weeks. N, the number of mice tested (ANOVA) in each group, is noted in parentheses. **, P<0.001 versus air controls; *, P<0.001 versus C57BL/6 strain.
The NOS2−/− results follow a similar trend to the results observed with the C57BL/6 mice. The total cell count in the lung lavage fluid shows an elevated inflammatory response in the mice exposed to ovalbumin, with a peak response at 2 weeks of exposure. The NOS2−/− time course also showed a significant increase in cells at 1 week [Kenyon et al., 2003b], the peak response at 2 weeks, and a gradual decrease in total inflammatory cells until 4 weeks of exposure, where we observed a significant decrease in total lavage cell number (P<0.001) as compared with the values at 2 weeks. However, while the overall trends parallel each other when the C57BL/6 and NOS2−/− mice are compared, the total number of lavaged cells in the NOS2−/− mice after 2 weeks of exposure to ovalbumin (1,637,000±271,000) is significantly (P<0.001) higher than the total number of cells from the C57BL/6 animals.
Differential cell counts of the cells in the lavage fluid from the NOS2−/− mice also demonstrate a significant increase in the percentage of eosinophils as compared to air controls after 2 weeks of exposure, as shown in Figure 1. The relative percentage of eosinophils remains significantly elevated as compared to air controls for at least 4 weeks of exposure to ovalbumin aerosol. There were essentially no eosinophils in the lavage fluid from control NOS2−/− mice exposed only to filtered air (0.04±0.04%, N=25); this value is not significantly different than the negligible percentage observed in air controls for the C57BL/6 strain, 0.27±0.14.
Ovalbumin exposure and the concentration of exhaled NO
There was a significant increase in the concentration of exhaled NO observed after 2 weeks of exposure of C57BL/6 mice as compared to control animals exposed only to filtered air; we found a mean value±SEM (N) of 6.0±0.7 (28) for mice exposed for 2 weeks versus 3.4±0.3 (30) for the controls (Figure 2). We then examined whether there was a similar response to ovalbumin exposure in the NOS2−/− strain of mice, as shown in Figure 2. In contrast with the results from C57BL/6 mice, there were no significant differences in exhaled NO between the NOS2−/− air controls and the NOS2−/− mice exposed to ovalbumin, suggesting a major role for NOS2 in the production of increased NO in response to ovalbumin-induced airway inflammation. In addition, the concentration of exhaled NO was significantly (P<0.05) lower in the NOS2−/− mice exposed to ovalbumin than in the exposed C57BL/6 animals. On the other hand, the values for exhaled NO in the air controls are similar for both C57BL/6 and NOS2−/− strains of mice (3.4±0.3 versus 4.3±0.2 ppb of exhaled NO, respectively).
Figure 2.

Concentration of NO in expired air from C57BL/6 or NOS2−/− mice exposed to ovalbumin aerosol for 2 weeks. N, the number of mice tested (ANOVA) in each group, is noted in parentheses. **, P<0.01 versus air controls; *, P<0.05 versus C57BL/6 strain.
Ovalbumin exposure and pulmonary function
We analyzed total lung compliance and resistance of the respiratory system of C57BL/6 and NOS2−/− mice at baseline and after bronchoprovocation with a series of increasing doses of methacholine aerosol (0.5, 1.0 and 2.0 mg/ml). After methacholine challenge (Figure 3a), we found a significant (P<0.001) decrease in lung compliance in the C57BL/6 mice exposed for 2 weeks that presumably reflects the degree of total inflammatory cell burden in the lung. We examined whether there was any correlation between the decreased lung compliance observed after methacholine challenge and the amount of exhaled NO by linear regression analysis of the results from individual animals, including mice not otherwise reported on in this study (some of which were exposed to ovalbumin aerosol for shorter times than 2 weeks) for which we had both sets of data, concentration of NO exhaled and lung compliance measurements (n=47). The slope of the resulting line was significantly (P=0.0305) different than zero (slope=0.7134±0.3193; F=4.992, DFn, DFd 1.000, 45.00). Higher levels of exhaled NO were associated with greater decreases in lung compliance after methacholine challenge in these mice, which included animals exposed to ovalbumin and their matched air controls. This is consistent with the use of NO as a clinical surrogate for poor asthma control in humans.
Figure 3.


Figure 3a. Percent decrease in lung compliance after methacholine challenge for C57BL/6 or NOS2−/− mice exposed to ovalbumin aerosol for 2 weeks. Percent decrease in compliance was measured as percent change from values at 0 mg/ml for mice given a 2.0 mg/ml dose of methacholine. N, the number of mice tested (ANOVA) in each group, is noted in parentheses. *, P<0.001 versus matched air controls; **, P<0.01 versus C57BL/6 mice exposed to ovalbumin.
Figure 3b. Percent increase in airway resistance after methacholine challenge for C57BL/6 or NOS2−/− mice exposed to ovalbumin aerosol for 2 weeks. Percent increase in resistance was measured as percent change from values at 0 mg/ml for mice given a 2.0 mg/ml dose of methacholine. N, the number of mice tested (ANOVA) in each group, is noted in parentheses.
Lung compliance was also measured for the NOS2−/− mice (Figure 3). The mice exposed to ovalbumin for 2 weeks showed significant (P<0.001) decreases in baseline lung compliance as compared to the air controls. Compliance after methacholine challenge was significantly (P<0.001) decreased from baseline values. The decrease in lung compliance after methacholine challenge for the NOS2−/− mice was significantly (P<0.01) greater than the corresponding value for the C57BL/6 animals (Figure 3a).
Airway resistance was also measured for C57BL/6 and NOS2−/− mice. In contrast to the C57BL/6 mice, the NOS2−/− group exposed for 2 weeks to ovalbumin aerosol had significantly higher baseline airway resistance as compared to the filtered air controls (data not shown, P<0.01). Airway reactivity was calculated as the percent change from baseline value in airway resistance. Airway reactivity was significantly (P<0.001) greater in the NOS2−/− group exposed for 2 weeks to ovalbumin as compared to both the C57BL/6 filtered air controls and the ovalbumin-exposed C57BL/6 mice. There was a noticeable trend (Figure 3b) towards greater increases in airway hyperreactivity for the NOS2−/− mice exposed to ovalbumin aerosol than was observed with the C57BL/6 animals (51% versus 0% increase).
Thus, as we observed with the measured parameters of cellular inflammation (Figure 1), while the overall qualitative trends in airway compliance and resistance are similar when the C57BL/6 and NOS2−/− mice are compared, the response to ovalbumin exposure is greater in the NOS2−/− mice.
Arginase expression in isolated airways of C57BL/6 and NOS2 −/− mice exposed to ovalbumin
We examined the relationship between ovalbumin exposure and expression of arginase I (Figure 4) and of arginase II (Figure 5), as evaluated by Western blots of extracts from isolated airways of C57BL/6 mice and their NOS2−/− strain counterparts. Arginase I content was significantly (P<0.001) increased, by about 8-fold, as compared to control values in the airways of C57BL/6 mice exposed for 2 weeks (P<0.001) to ovalbumin aerosol. In comparison, arginase I expression was significantly (P<0.001) increased, by about 42-fold (P<0.001), in the airways of NOS2−/− mice exposed for 2 weeks to OVA as compared to the filtered air controls. The relative increase in arginase I content was significantly (P<0.001) greater in the NOS2−/− mice than in the C57BL/6 strain.
Figure 4.
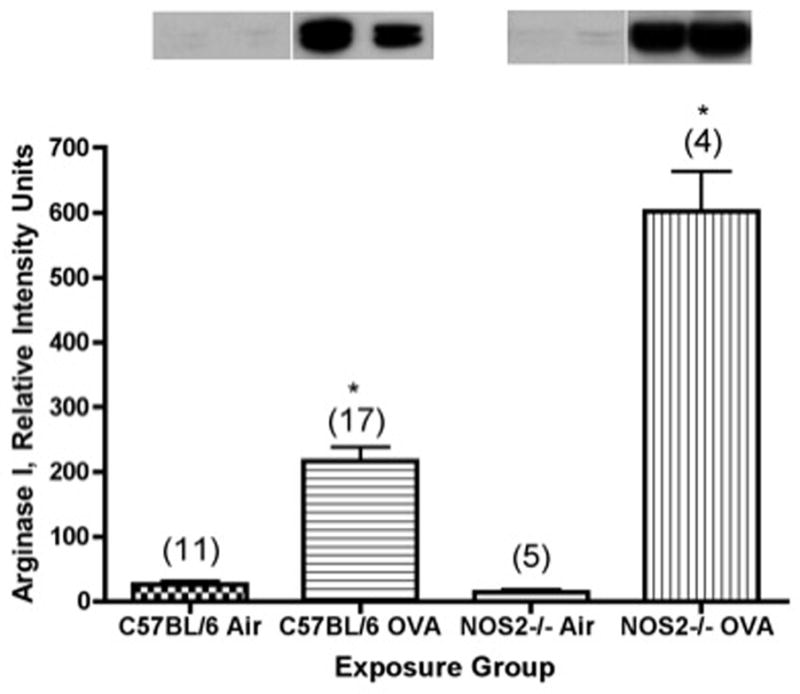
Arginase I content (measured as relative intensity units from densitometry) determined by Western blot analysis in microdissected airways from C57BL/6 or NOS2−/− mice exposed to ovalbumin aerosol for 2 weeks. Representative western blots are shown above each bar. N, the number of mice tested (ANOVA) in each group, is noted in parentheses. *, P<0.001 versus matched air controls.
Figure 5.
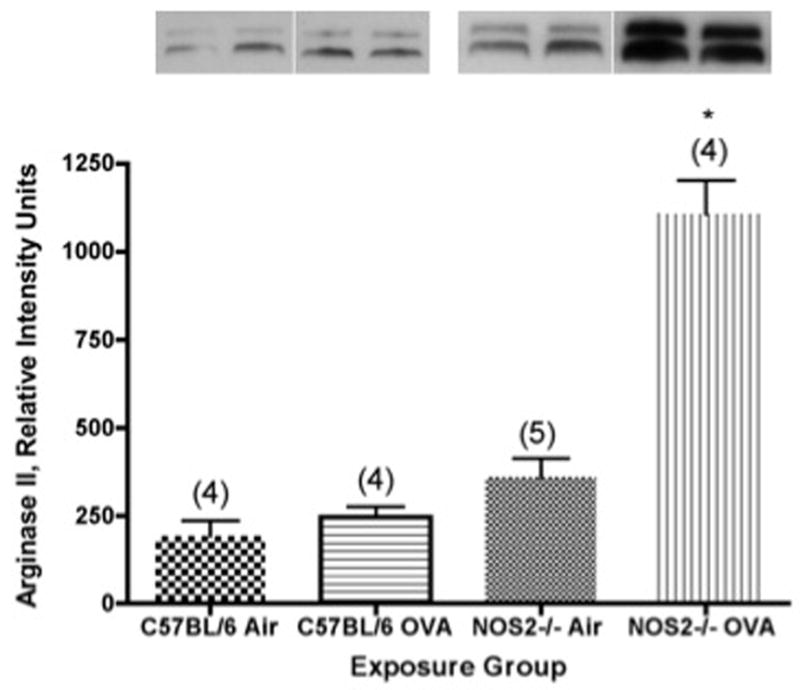
Arginase II content (measured as relative intensity units from densitometry) determined by Western blot analysis in microdissected airways from C57BL/6 or NOS2−/− mice exposed to ovalbumin aerosol for 2 weeks. Representative western blots are shown above each bar. N, the number of mice tested (ANOVA) in each group, is noted in parentheses. *, P<0.001 versus matched air controls and also versus the C57BL/6 strain results.
Arginase II levels in the isolated airways from C57BL/6 and NOS2−/− mice showed a different pattern of findings than we observed for arginase I. In the C57BL/6 mice, we observed no significant differences in the level of expression of arginase II between the filtered air controls and the mice exposed for 2 weeks to ovalbumin aerosol (Figure 5). On the other hand, there was a 3-fold increase (P<0.001) in the level of expression of arginase II between air controls and the NOS2−/− mice exposed for 2 weeks to OVA aerosol (Figure 5). Consistent with the results for arginase I (and the other inflammatory and functional parameters evaluated above), the relative increase in arginase II content was significantly (P<0.001) greater in the NOS2−/− mice than in the C57BL/6 strain.
Arginine content of isolated airways
We measured the concentration of arginine in our preparations of isolated, microdissected airways. Data were normalized to the protein content of the samples so that equivalent amounts of airway were analyzed. Comparing the C57BL/6 with the NOS2−/− strain, we found an average concentration of 70 and 95 pmol of arginine/50 μg of protein, respectively, in the air control animals, with no significant differences (t test) from these measured concentrations of airway arginine among any of the groups in either mouse strain exposed to ovalbumin. These results correspond to an airway arginine concentration of 1.4–1.9 nmol of arginine/mg of protein. In our earlier paper (Kenyon et al., 2008) with Balb/c mice exposed to ovalbumin for 0 or 2 weeks, we found values between 5.5 and 3 nmol of arginine/mg of protein in isolated airways prepared and analyzed in an identical manner, indicating that there may be significant differences in airway arginine concentration between mouse strains.
The microdissected airways are homogenized in 500 μl of saline solution prior to analysis; thus, the concentrations we obtain by HPLC analysis are lower than the actual concentrations in vivo. Because of the microdissection technique used, each airway preparation is unique. However, we can calculate an average dilution factor to estimate the actual concentration of arginine in the airway preparations. The mean total protein content±SEM of the microdissected airways we obtained from the air control group (pooled data for NOS2−/− and C57BL/6 animals) was 1.368±0.259 mg of protein in 500 μl of buffer (N=9). If we assume that the average arginine content of the airways is 82 pmol/50 μg of protein [(70 + 95)/2 = 82], then we can calculate that there is an average of (1368/50) × 82 = 2.24 nmol of arginine in 500 μl of added buffer, or 4.5 nmol per ml, in the airway preparations, giving an average concentration of arginine in the microdissected airways of 4.5 μM. This calculation does not include a correction for uptake of buffer by the airways during lung dissection, so the result is lower by an indeterminate amount than the actual arginine concentrations in vivo.
In this context we should note that plasma arginine values (mouse and human) that we determine with the same HPLC methodology (but without dilution of samples prior to analysis) are consistent with the reported values in the literature (Kenyon et al., 2008). Thus, the absolute values we report above can’t be directly related to intracellular concentrations in vivo; however, the relative changes (or lack thereof) are almost certainly an accurate reflection of what is occurring in the airways in vivo.
Effect of treatment of C57BL/6 mice with an arginase inhibitor
Mice were treated systemically with nor-NOHA, a competitive inhibitor of both isoforms of arginase (Ki about 0.5 μM in vitro). Our working hypothesis was that inhibition of arginase would shunt arginine into the NOS pathway, which in turn would increase airway epithelial cell NO production and thereby partially block the inflammatory effects of ovalbumin on the lungs of C57BL/6 mice. This hypothesis seems reasonable given the greater inflammation seen in NOS2−/− mice than in the C57BL/6 strain after exposure to the same concentration × time product of ovalbumin. This was indeed the case, as shown in Figure 6. There was no significant difference in the number of cells in the lung lavage from nor-NOHA-treated or untreated mice exposed to filtered air. Mice exposed to OVA showed a significant (P<0.01) increase in the total cells recovered from lung lavage fluid. Sensitized C57BL/6 mice treated with nor-NOHA showed about 65% fewer total cells in their lung lavage (P<0.05) than their untreated counterparts after exposure to ovalbumin aerosol; there was no significant difference in the total cells in the lavage fluid between the nor-NOHA treated animals exposed to air or to ovalbumin. Consistent with the decreased inflammation seen as fewer total cells in the lung lavage fluid in mice exposed to ovalbumin and treated with nor-NOHA was a significantly smaller percentage decrease in lung compliance after methacholine challenge (from about 37% to 25% in the mice treated with nor-NOHA, data not shown).
Figure 6.

Effect of nor-NOHA treatment on lung inflammatory response in C57BL/6 mice exposed for 2 weeks to ovalbumin. Lung inflammation is quantified as total cells in lung lavage fluid. N, the number of mice tested (ANOVA) in each group, is noted in parentheses. *, P<0.01 versus air or air + nor-NOHA; **, P<0.05 versus OVA or versus air controls.
DISCUSSION
The response of C57BL/6 mice to ovalbumin exposure in these experiments was consistent with our previously reported results in this strain [Kenyon et al., 2002; 2003b]. Qualitatively similar responses to those in C57BL/6 mice were observed with the NOS2−/− strain, but the magnitude of the responses was greater. The NOS2−/− animals were more susceptible to ovalbumin exposure by all of the measured inflammatory and functional parameters than were the wild-type C57BL/6 mice. Total cells in lung lavage fluid and the percentage of eosinophils were higher than with C57BL/6 mice. Exhaled NO in air control animals was similar for the C57BL/6 mice and the NOS2−/− strain, suggesting that NOS1 and/or NOS3 were the predominant contributors for this exhaled NO in C57BL/6 mice breathing filtered air.
However, the NOS2−/− mice were not able to increase their concentration of exhaled NO in response to challenge with ovalbumin aerosol, even though they showed a greater total inflammatory cell and eosinophilic response and greater changes in lung compliance and airway hyperreactivity. This result suggests that the NOS isoform responsible for synthesizing NO in the airways after ovalbumin challenge is NOS2. Hjoberg et al. [2004] have previously suggested that NOS2 produces NO that is beneficial for improving lung function based upon experiments with transgenic mice conditionally overproducing NOS2. Even though direct measurement of airway arginine concentrations after 2 weeks of exposure to ovalbumin did not show significant differences, the greater changes in arginase content of the airways of the NOS2−/− mice after ovalbumin exposure (Figures 4 and 5) suggest that larger changes in arginine metabolism are occurring in the NOS2−/− animals.
If we compare the data in Figure 1 with the results in Figure 3, an important generalization emerges. The peak inflammatory response occurs at 2 weeks for both the C57BL/6 and NOS2−/− mouse strains. Airway hyperreactivity is markedly elevated in the NOS2−/− mice at 2 weeks of exposure suggesting that this strain has the more “asthmatic” phenotype, not just in terms of inflammatory infiltrate but also airway reactivity. The most likely mechanism to explain this observation is the inability of the NOS2−/− mouse strain to mount an NO response as a bronchodilator in response to ovalbumin exposure (Figure 2).
We observed relatively small amounts of constitutively produced arginase I and arginase II by western blot analysis of isolated microdissected airways from normal (filtered air control) mice. This is a reasonable result based upon findings by gene array analysis of whole lungs from C57BL/6 mice [Endo et al., 2003]. Our analyses of arginases I and II by western blot analysis of microdissected airways reported in this paper suggest either that the expression of arginase I is relatively greater in the large airways of the mouse than in the remainder of the lung, or that the arginase I protein has a long half-life relative to its mRNA. In any case, only relatively low levels of either of the arginase isoforms were detected by western blot analysis of isolated airways from unexposed C57BL/6 and NOS2−/− mice. Comparable analyses of isolated microdissected airways from the NOS2−/− mice showed interesting differences compared to the C57BL/6 strain after 2 weeks of exposure to ovalbumin. For arginase I, the results were qualitatively similar, with a strong up-regulation at 2 weeks of exposure to ovalbumin; however, the relative quantitative response was 5-fold greater in the NOS2−/− animals than in the C57BL/6 strain. For the arginase II isoform, the results were qualitatively different from the C57BL/6 strain which showed no observable up-regulation of arginase II after exposure to ovalbumin. However, in NOS2−/− mice, arginase II significantly increased with exposure to ovalbumin. It is possible that some, or all, of the increased sensitivity of the NOS2−/− mice to ovalbumin may be related to these observations. There are suggestions in the literature that arginase regulates NOS2 and NOS3 expression not only by competition for their common substrate arginine, but also by decreasing the rate of translation and stability of NOS2 [El-Gayar et al., 2003; Durante et al., 2007; Lee et al., 2003]. Thus, the absence of this vital control mechanism in the NOS2−/− mouse strain may predispose it to an exaggerated response to ovalbumin exposure.
Based upon the existing literature, we initially hypothesized that under conditions of increased NO production (e.g. ovalbumin exposure) we would observe increased amounts of arginase in the isolated airways. Our results in Figure 4 and 5 strongly support this hypothesis. The occurrence of arginase II constitutively in airway epithelial cells is reasonable as arginase is essential for the synthesis of protein biosynthesis precursors; proline and glutamate. With airway epithelial mucous cell hyperplasia and proliferation occurring during airway remodeling in the ovalbumin model, it is reasonable to assume a need for baseline levels of arginase in the airway epithelium [Li et al., 2001, 2002] and that this role is played predominantly by arginase II in the mouse.
Arginase I is a cytosolic enzyme, while arginase II is located in the mitochondria [Li et al., 2001; Levillain et al., 2005; Grody et al., 1987]. Interestingly, human arginase II is located on chromosome 14q24 (Gotoh et al., 1997), the same location as has been reported for a candidate gene for asthma susceptibility (Hakonarson et al., 2002; Szalai et al., 2008). Thus, regulation and activity of arginase II may be of interest in subpopulations of humans or mice with increased asthma susceptibility. Despite similarity in initial function, the localization of these two enzyme isoforms may result in different roles in the production of polyamine synthesis (primarily Arginase I) [Li et al., 2001] and proline and glutamate synthesis (primarily Arginase II) [Grody et al., 1987] In the C57BL/6 mice, we see a consistent pattern of peak responses at 2 weeks of exposure to ovalbumin. These responses include total inflammatory cells and eosinophils in lung lavage (Figure 1), exhaled NO (Figure 2), airway hyperresponsiveness (Figure 3), and arginase I content of microdissected airways (Figure 4). However, arginase II did not increase upon exposure of C57BL/6 mice to ovalbumin, while the relative content of arginase I increased by 3-fold (Figure 4). Thus, there would appear to be an association between all of these parameters except arginase II in normal (C57BL/6) mice, but our data do not allow us to distinguish between whether any or all of these changes are occurring in the same cellular population(s) or whether some or all of these changes are biomarkers of the shifting cell populations in the airways of mice undergoing allergen-induced airway inflammation.
It is tempting to speculate that the increased susceptibility of the NOS2−/− mice to ovalbumin, as demonstrated by greater responses in all of the parameters evaluated, may be related directly or indirectly to the observed difference in the behavior of arginase II between the two mouse strains upon exposure to ovalbumin. These results suggest the possibility of a regulatory role for NOS2, or for NOS2-produced NO, in the production of arginase I and/or II in the airway. In this context, we have determined by western blot analysis (data not shown) that NOS2 content of isolated microdissected airways from C57BL/6 mice follows the same pattern of peak values at 2 weeks of OVA exposure, significantly increased above air controls as we see for most of the other measured parameters in this strain. Whether the differences in the expression of arginase I and/or arginase II between C57BL/6 and NOS2−/− mice are related to the increased sensitivity of the NOS2−/− mice to ovalbumin remains speculative at this time. Finally, we were unable to demonstrate any changes in the concentration of arginine in the isolated airways, despite the changes we observed in arginase I and/or arginase II in the same airways. These results may indicate that the airway cells defend their normal cellular arginine content in these strains of mouse (at least on the time scale of weeks that we studied in this work), which should be easily accomplished by uptake of exogenous arginine from the circulating blood.
One limitation of our study that needs discussion is the apparent strain-specific nature of our results. We have recently published data examining the consequences of arginine and arginase modulation in Balb/c mice [Kenyon et al., 2008]. Responses to ovalbumin in the Balb/c strain are much more similar to those in the NOS2−/− mice than in their C57BL/6 wild type counterparts. After exposure to ovalbumin, Balb/c mice had a significant increase in arginase I and II content in their airways and this corresponded to a significant decrease in airway arginine content. This drop in arginine content at two weeks of exposure was transient and time-dependent. The increase in arginase I and II content in the airways correlated strongly with the lung lavage inflammatory cell counts. The differences noted in the airway arginine content between C57BL/6 and Balb/c mice suggest a genotypic contribution to both allergic airway inflammation and to arginine and NO metabolism. The genotypic difference seen in these mouse strains may reflect the spectrum of responses across different individuals in human inflammatory airway diseases such as asthma.
The consequences of an increase in arginase expression and the resulting decrease in arginine concentration would include down-regulation of NOS2 activity (Berkowitz et al., 2003), which could serve as an “off-switch” for the increases in exhaled NO in the ovalbumin model we observe during the peak inflammatory response at 2 weeks of exposure, and for down-regulating the inflammatory response itself. We hypothesize that an early event in mice exposed to ovalbumin aerosol is an increase in production of NO in the ciliated airway epithelial cells, a known source of NO in the airways [Li et al., 2000]. This NO could have an anti-proliferative effect. With continued exposure to ovalbumin, we see a strong eosinophilic inflammatory response, increased arginase content leading to decreased production of NO by NOS2 and increased biosynthesis of amino acids and polyamines required for cellular proliferation, and proliferation of airway mucous cells, leading to airway remodeling. Upon further exposure to ovalbumin, we have seen decreased (but sustained and predominantly lymphocytic) inflammation and decreased arginase content with establishment of a new homeostatic state accompanied by sustained airway remodeling, mucous cell hyperplasia, increased airway hyperreactivity, decreased lung compliance, airway submucosal fibrosis, and the progression to “irreversible asthma” [Kenyon et al., 2003b; Kenyon and Last, 2005]. There are significant differences in arginase I and II response and exhaled NO in the NOS2−/− mice, suggesting the possibility of an important regulatory role for the interplay between NOS2 and arginase I and II in the airway epithelial cells. Taken together, these results suggest that strains of mice with the most “asthmatic” phenotypes—Balb/c and NOS2−/− mice in our hands—demonstrate alterations in arginine metabolism, and that these strains (and by extension humans with asthma) might benefit from targeted therapies such as L-arginine or arginase inhibition. Our findings also highlight the fact that predictors of response to such interventions must be defined if these approaches are to be taken into clinical studies.
Acknowledgments
We thank Erin O’Roark for technical assistance with several of the earlier experiments performed in this study. This work was funded in part through grants from the NIEHS (ES-05707, J.A.L.), an American Lung Association Research Grant (B.M.M.), a grant from the NHLBI (K08 HL-076415), and NCRR Grant UL1RR024146, a component of the NIH Roadmap for Medical Research (N.J.K.). Michael Last was supported by an NIH training grant (TW-05718) during this study.
Footnotes
CONFLICT OF INTEREST STATEMENT: The authors declare that there are no conflicts of interest for any of the authors.
Publisher's Disclaimer: This is a PDF file of an unedited manuscript that has been accepted for publication. As a service to our customers we are providing this early version of the manuscript. The manuscript will undergo copyediting, typesetting, and review of the resulting proof before it is published in its final citable form. Please note that during the production process errors may be discovered which could affect the content, and all legal disclaimers that apply to the journal pertain.
References
- Berkowitz DE, White R, Li D, Minhas KM, Cernetich A, Kim S, Burke S, Shoukas AA, Nyhan D, Champion HC, Hare JM. Arginase reciprocally regulates nitric oxide synthase activity and contributes to endothelial dysfunction in aging blood vessels. Circulation. 2003;108:2000–2006. doi: 10.1161/01.CIR.0000092948.04444.C7. [DOI] [PubMed] [Google Scholar]
- Durante W, Johnson FK, Johnson RA. Arginase: a critical regulator of nitric oxide synthesis and vascular function. Clin Exp Pharmacol Physiol. 2007;34:906–911. doi: 10.1111/j.1440-1681.2007.04638.x. [DOI] [PMC free article] [PubMed] [Google Scholar]
- El-Gayar S, Thuring-Nahler H, Pfeilschifter J, Rollinghoff M, Bogdan C. Translational control of inducible nitric oxide synthase by IL-13 and arginine availability in inflammatory macrophages. J Immunol. 2003;171:4561–4568. doi: 10.4049/jimmunol.171.9.4561. [DOI] [PubMed] [Google Scholar]
- Endo M, Oyadomari S, Terasaki Y, Takeya M, Suga M, Mori M, Gotoh T. Induction of arginase I and II in bleomycin-induced fibrosis of mouse lung. Am J Physiol Lung Cell Mol Physiol. 2003;285:L313–321. doi: 10.1152/ajplung.00434.2002. [DOI] [PubMed] [Google Scholar]
- Fajardo I, Svensson L, Bucht A, Pejler G. Increased levels of hypoxia-sensitive proteins in allergic airway inflammation. Am J Respir Crit Care Med. 2004;170:477–484. doi: 10.1164/rccm.200402-178OC. [DOI] [PubMed] [Google Scholar]
- Gotoh T, Araki M, Mori M. Chromosomal Localization of the Human Arginase II Gene and Tissue Distribution of Its mRNA. Biochem Biophys Res Commun. 1997;233:487–491. doi: 10.1006/bbrc.1997.6473. [DOI] [PubMed] [Google Scholar]
- Grody WW, Dizikes GJ, Cederbaum SD. Human arginase isozymes. Isozymes Curr Top Biol Med Res. 1987;13:181–214. [PubMed] [Google Scholar]
- Hakonarson H, Unnur S, Bjornsdottir US, Halapi E, Palsson S, Adalsteinsdottir E, Gislason D, Finnbogason G, Gislason T, Kristjansson K, Arnason T, Birkisson I, Frigge ML, Kong A, Gulcher JR, Stefansson K. A Major Susceptibility Gene for Asthma Maps to Chromosome 14q24. Am J Hum Genet. 2002;71:483–491. doi: 10.1086/342205. [DOI] [PMC free article] [PubMed] [Google Scholar]
- Hjoberg J, Shore S, Kobzik L, Okinaga S, Hallock A, Vallone J, Subramaniam V, De Sanctis GT, Elias JA, Drazen JM, Silverman ES. Expression of nitric oxide synthase-2 in the lungs decreases airway resistance and responsiveness. J Appl Physiol. 2004;97:249–259. doi: 10.1152/japplphysiol.01389.2003. [DOI] [PubMed] [Google Scholar]
- Kenyon NJ, Bratt JM, Linderholm AL, Last MS, Last JA. Arginases I and II in lungs of ovalbumin-sensitized mice exposed to ovalbumin: Sources and consequences. Toxicol Appl Pharmacol. 2008;230:269–275. doi: 10.1016/j.taap.2008.03.004. [DOI] [PMC free article] [PubMed] [Google Scholar]
- Kenyon NJ, Gohil K, Last JA. Susceptibility to ovalbumin-induced airway inflammation and fibrosis in inducible nitric oxide synthetase-deficient mice: mechanisms and consequences. Toxicol Appl Pharmacol. 2003b;191:2–11. doi: 10.1016/s0041-008x(03)00227-8. [DOI] [PubMed] [Google Scholar]
- Kenyon NJ, Last JA. Reversible and irreversible airway inflammation and fibrosis in mice exposed to inhaled ovalbumin. Inflammation Res. 2005;54:57–65. doi: 10.1007/s00011-004-1325-6. [DOI] [PubMed] [Google Scholar]
- Kenyon NJ, van der Vliet A, Schock BC, Okamoto T, McGrew GM, Last JA. Susceptibility to ozone-induced acute lung injury in iNOS-deficient mice. Am J Physiol Lung Cell Mol Physiol. 2002;282:L540–545. doi: 10.1152/ajplung.00297.2001. [DOI] [PubMed] [Google Scholar]
- Kenyon NJ, Ward RW, Last JA. Airway fibrosis in a mouse model of airway inflammation. Toxicol Appl Pharmacol. 2003a;186:90–100. doi: 10.1016/s0041-008x(02)00025-x. [DOI] [PubMed] [Google Scholar]
- King NE, Rothenberg ME, Zimmermann N. Arginine in asthma and lung inflammation. J Nutr. 2004;134:2830S–2836S. doi: 10.1093/jn/134.10.2830S. [DOI] [PubMed] [Google Scholar]
- Lee J, Ryu H, Ferrante RJ, Morris SM, Jr, Ratan RR. Translational control of inducible nitric oxide synthase expression by arginine can explain the arginine paradox. Proc Natl Acad Sci USA. 2003;100:4843–4848. doi: 10.1073/pnas.0735876100. [DOI] [PMC free article] [PubMed] [Google Scholar]
- Levillain O, Balvay S, Peyrol S. Mitochondrial expression of arginase II in male and female rat inner medullary collecting ducts. J Histochem Cytochem. 2005;53:533–541. doi: 10.1369/jhc.4A6489.2005. [DOI] [PubMed] [Google Scholar]
- Li H, Meininger CJ, Hawker JR, Jr, Haynes TE, Kepka-Lenhart D, Mistry SK, Morris SM, Jr, Wu G. Regulatory role of arginase I and II in nitric oxide, polyamine, and proline syntheses in endothelial cells. Am J Physiol Endocrinol Metab. 2001;280:E75–82. doi: 10.1152/ajpendo.2001.280.1.E75. [DOI] [PubMed] [Google Scholar]
- Li H, Meininger CJ, Kelly KA, Hawker JR, Jr, Morris SM, Jr, Wu G. Activities of arginase I and II are limiting for endothelial cell proliferation. Am J Physiol Regul Integr Comp Physiol. 2002;282:R64–R69. doi: 10.1152/ajpregu.2002.282.1.R64. [DOI] [PubMed] [Google Scholar]
- Li D, Shirakami G, Zhan X, Johns RA. Regulation of ciliary beat frequency by the nitric oxide-cyclic guanosine monophosphate signaling pathway in rat airway epithelial cells. Am J Respir Cell Mol Biol. 2000;23:175–181. doi: 10.1165/ajrcmb.23.2.4022. [DOI] [PubMed] [Google Scholar]
- Meurs H, Maarsingh H, Zaagsma J. Arginase and asthma: novel insights into nitric oxide homeostasis and airway hyperresponsiveness. Trends Pharmacol Sci. 2003;24:450–455. doi: 10.1016/S0165-6147(03)00227-X. [DOI] [PubMed] [Google Scholar]
- Morris CR, Poljakovic M, Lavrisha L, Machado L, Kuypers FA, Morris SM., Jr Decreased arginine bioavailability and increased serum arginase activity in asthma. Am J Respir Crit Care Med. 2004;170:148–153. doi: 10.1164/rccm.200309-1304OC. [DOI] [PubMed] [Google Scholar]
- Ricciardolo FL. cNOS-iNOS paradigm and arginase in asthma. Trends Pharmacol Sci. 2003;24:560–561. doi: 10.1016/j.tips.2003.09.007. [DOI] [PubMed] [Google Scholar]
- Sarwar G, Botting HG. Rapid analysis of nutritionally important free amino acids in serum and organs (liver, brain, and heart) by liquid chromatography of precolumn phenylisothiocyanate derivatives. J Assoc Off Anal Chem. 1990;73:470–475. [PubMed] [Google Scholar]
- Schuster GU, Kenyon NJ, Stephensen CB. Vitamin A deficiency decreases and high dietary vitamin A increases disease severity in the mouse model of asthma. J Immunol. 2008;180:1834–1842. doi: 10.4049/jimmunol.180.3.1834. [DOI] [PubMed] [Google Scholar]
- Schwarze J, Hamelmann E, Bradley KL, Takeda K, Gelfand EW. Respiratory syncytial virus infection results in airway hyperresponsiveness and enhanced airway sensitization to allergen. J Clin Invest. 1997;100:226–233. doi: 10.1172/JCI119516. [DOI] [PMC free article] [PubMed] [Google Scholar]
- Silkoff PE, Wakita S, Chatkin J, Ansarin K, Gutierrez C, Caramori M, McClean P, Slutsky AS, Zamel N, Chapman KR. Exhaled nitric oxide after beta2-agonist inhalation and spirometry in asthma. Am J Respir Crit Care Med. 1999;159:940–944. doi: 10.1164/ajrccm.159.3.9805044. [DOI] [PubMed] [Google Scholar]
- Szalai C, Ungvári I, Pelyhe L, Tölgyesi G, Falus A. Asthma from a pharmacogenomic point of view. Brit J Pharmacol. 2008;153:1602–1614. doi: 10.1038/bjp.2008.55. [DOI] [PMC free article] [PubMed] [Google Scholar]
- Vercelli D. Arginase: marker, effector, or candidate gene for asthma? J Clin Invest. 2003;111:1815–1817. doi: 10.1172/JCI18908. [DOI] [PMC free article] [PubMed] [Google Scholar]
- Walter MJ, Morton JD, Kajiwara N, Agapov E, Holtzman MJ. Viral induction of a chronic asthma phenotype and genetic segregation from the acute response. J Clin Invest. 2002;110:165–175. doi: 10.1172/JCI14345. [DOI] [PMC free article] [PubMed] [Google Scholar]
- Zimmermann N, King NE, Laporte J, Yang M, Mishra A, Pope SM, Muntel EE, Witte DP, Pegg AA, Foster PS, Hamid Q, Rothenberg ME. Dissection of experimental asthma with DNA microarray analysis identifies arginase in asthma pathogenesis. J Clin Invest. 2003;111:1863–1874. doi: 10.1172/JCI17912. [DOI] [PMC free article] [PubMed] [Google Scholar]