Abstract
The aerosol OT/l-α-phosphatidylcholine/isooctane/water system forms a rigid mesophase that transitions from reverse hexagonal to multilamellar in structure at specific water contents. This study shows that characteristics of ordered liquid-crystalline mesophases can be distinguished and imaged in high clarity using cryo-field emission scanning electron microscopy (cryo-FESEM). The reverse hexagonal phase consists of bundles of long cylinders, some with length scales of over 2 μm, that are randomly oriented as part of a larger domain. Cryo-imaging allows the visualization of the intercylinder spacings and the details of transitions from one domain to another. The multilamellar structured mesophase consists of spherical vesicles of 100 nm to 10 μm in diameter, with intervening noncrystalline isotropic regions. Coexistence regions containing both the reverse hexagonal and lamellar structures are also observed in the transition from the reverse hexagonal to the lamellar phase. These results complement and qualitatively verify our earlier studies with small-angle neutron scattering, high-field nuclear magnetic resonance spectroscopy, and freeze-fracture direct imaging transmission electron microscopy. The information is useful in understanding materials templating in these rigid systems.
1. Introduction
Surfactants self-assemble into a multitude of interesting structures (e.g., micelles,1,2 reverse micelles,3-6 elongated micelles,2,7-9 ribbons,9,10 disks,11,12 vesicles,2,13-15 and liquid-crystalline mesophases16) above the critical micelle concentration.17 Of particular interest are rigid gel-like crystalline mesophases that can be aligned through shear or extrusion and can be used to template materials in both the aqueous and/or nonaqueous domains.18-20 We have extensively studied such a system that consists of bis(2-ethylhexyl) sodium sulfosuccinate, the zwitterionic surfactant l-α-phosphatidylcholine (lecithin), isooctane, and water. The system has similar proportions of water and oil and forms gel-like rigid mesophases with low shear viscosities of up to 105 Pa s. The system is optically clear with no phase separation indicating nanostructured water and oil regions.18,21-23 The microstructure of these mesophases has been previously characterized using small-angle neutron scattering (SANS)18,22,23 and nuclear magnetic resonance (NMR) spectroscopy.24,25 The mesophases consist of columnar reverse hexagonal and/or lamellar domains that are highly dependent on temperature and water content.22,23 At low temperatures or water content, the hexagonal phase persists, which gradually transitions into the lamellar phase though an intermediate coexistence regime.22,23 These rigid mesophases have potential in templated materials synthesis.19,20
Although SANS and NMR studies are extremely useful in providing a quantitative analysis of the mesophases, the direct visualization of the mesophase through electron microscopy is the clearest confirmation of the results of these studies. In an earlier paper, we have used freeze-fracture direct imaging (FFDI) transmission electron microscopy26 to corroborate SANS results and observed that the lamellar domains of the surfactant mesophase are multilamellar vesicles instead of lamellar sheets.26 This observation stresses the importance of direct imaging to provide a more complete picture of mesophase structure unattainable through quantitative means.
Here, we report the use of cryo-field emission scanning electron microscopy (cryo-FESEM) as a final complementary technique of our study to provide a complete picture of these surfactant mesophases. Cryo-SEM can cover length scales beyond that of TEM, allowing us to get an idea of domains in crystalline structures. Additionally, cryo-SEM provides valuable information on surface morphologies of soft hydrated materials. In a recent paper, environmental SEM has been used successfully but at relatively low resolution to image a reverse hexagonal phase in the system of glycerol monooleate/water/tricaprylin/phosphatidylcholine, where the reverse hexagonal phase is visualized.27 We consider cryo-field emission SEM to be a superior alternative because of the nanometer-scale resolution afforded by the technique. In the current study described below, we show clear domains of the reverse hexagonal phase at high resolution, where the cross section of the tubular structures is visualized and can be correlated with results from SANS and NMR. We also attempt to show the details of the transition from the uniquely existing reverse hexagonal phase to the coexisting reverse hexagonal + lamellar phase and thence to the uniquely existing lamellar phase of multilamellar vesicles.
2. Experimental Section
Materials
l-α-Phosphatidylcholine (lecithin, 95% purity) extracted from soybeans was purchased from Avanti Polar Lipids, Inc. Bis(2-ethylhexyl) sodium sulfosuccinate (AOT, 98% purity) was purchased from Sigma. Isooctane (99.7+% purity) was purchased from Alfa Aesar. All chemicals were used without any further treatment or purification. Distilled water was used for incorporation into the surfactant mesophases.
Preparation of Mesophases
The rigid surfactant mesophases were prepared by dissolving 1.89 g of AOT (0.85 M) and 1.59 g of lecithin (0.42 M) in 5 mL of isooctane by sonication in a warm water bath until completely homogeneous, clear, transparent solutions were obtained. All solution compositions were fixed so that the effect of increasing the water content on the mesophase could be determined. Water was gradually introduced into the system in increments of 0.5 mL, and the mesophase was vortex mixed after each incremental addition of water to obtain a homogeneous mixture. This was performed until the desired W0 (W0 = [H2O]/[AOT] = 70, 140, and 200) value was attained. The samples were allowed to equilibrate at room temperature for 2 to 3 days.
Cryo-Field Emission Scanning Electron Microscopy
The mesophases were transferred using a micropipette into rivets that were fastened securely onto the cryo-SEM sample holder (Figure 1) under ambient conditions. The cryo-SEM sample holder was plunged into slushed liquid nitrogen at -190 °C (Alto 2500, Gatan) so that the sample was frozen immediately. The sample was subsequently transferred under vacuum to the cryo-SEM sample preparation chamber where the sample temperature was maintained at -150 °C by seating the sample holder on a cold stage. The temperature of the anticontaminator in the sample preparation chamber was held at -190 °C. The sample was subsequently fractured using a cold knife maintained at -150 °C to reveal a clean surface of the frozen mesophase. The sample was sublimed for more than 5 min at -100 °C to etch away water on the surface of the mesophases following fracturing. The sample temperature was then lowered to -135 °C, and once the temperature remained steady, the sample was sputter coated at 11 mA for at least 39 s to deposit a thin layer of conductive platinum on top of the sample. The sample was then transferred under the protection of high vacuum into the cryo-FESEM (Hitachi S-4800) microscope chamber and imaged at an accelerating voltage of 2 kV and at a working distance of 5 to 6 mm.
Figure 1.
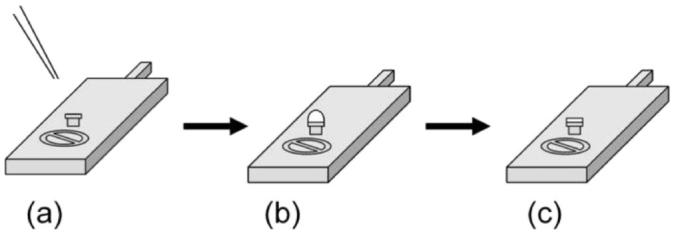
(a) Initially, a drop of the crystalline mesophase is deposited on a clean, empty rivet that is held in place on the cryo-sample stage at room temperature. (b) The sample stage with the crystalline mesophase is immediately frozen in slushed liquid nitrogen and transferred under vacuum to the cryo-SEM. (c) The sample is subsequently fractured to reveal a clean surface that is then sublimed and sputter coated with platinum prior to imaging.
3. Results and Discussion
The AOT-lecithin-isooctane-water system forms a rigid crystalline mesophase with nanostructured aqueous and organic domains for the W0 values used in this study (W0 = 70-200). The temperature of the mesophase was held constant at 25 °C while the water content of the system was varied from W0 = 70-200. Over this range of water content, specific mesophases are detected: a reverse hexagonal mesophase at the lower water levels, a lamellar mesophase at the higher water contents, and coexisting reverse hexagonal + lamellar mesophases at intermediate water contents.23 Figure 2 illustrates the phase diagram of the AOT-lecithin-isooctane-water surfactant mesophase and the samples (W0 = 70, 140, and 200) that were imaged in this study.
Figure 2.
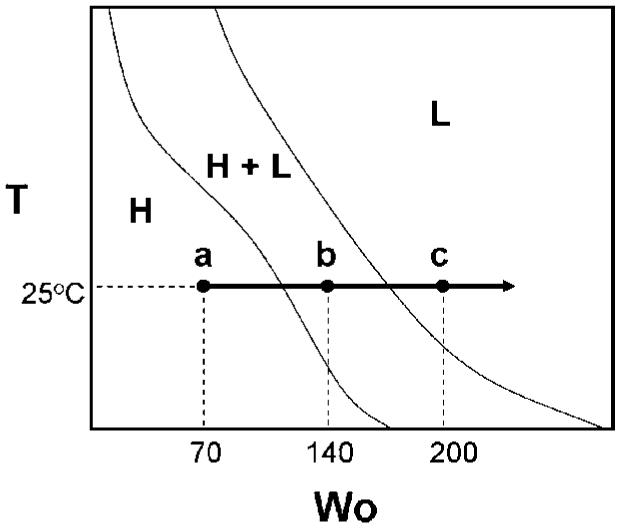
Phase diagram of the AOT-lecithin-isooctane-water crystalline mesophase.
Upon fracturing the mesophase and sublimation of the sample to etch away surface water, the morphological details of the AOT-lecithin-isooctane-water surfactant mesophase at a water content of W0 = 70 (Figure 2, point a) are revealed. At this particular water content, SANS23 and NMR studies25 both indicate that the mesophase structure is reverse hexagonal. For ease of reference, the corresponding TEM image of the mesophase obtained through freeze-fracture direct imaging26 is supplied as an inset to Figure 3. Cryo-SEM reveals randomly oriented microdomains of long cylinders, which are expected for the reverse hexagonal phase. Some of the long tubules extend more than 2 μm in length, and their cross section is observed in regions of the micrograph (Figure 3). These tubules are originally filled with water. However, upon sublimation of the sample prior to imaging, some water is removed to reveal the porosity of the structures. A higher-magnification image showing the cross-section of the tubes is found as an inset to Figure 3. SANS results of the system indicate a d spacing of the hexagonal (10) planes on the order of 10-20 nm.23 It is difficult to see this clearly from the pore structure, but the striations indicating the tubelike structures of the HII phase appear to be separated by spacings of this length scale. The cryo-TEM results in the inset are a better indicator of d spacing. What is quite remarkable in the cryo-SEM is the visualization of mesophase domains with boundaries that appear to be reasonably sharp.
Figure 3.
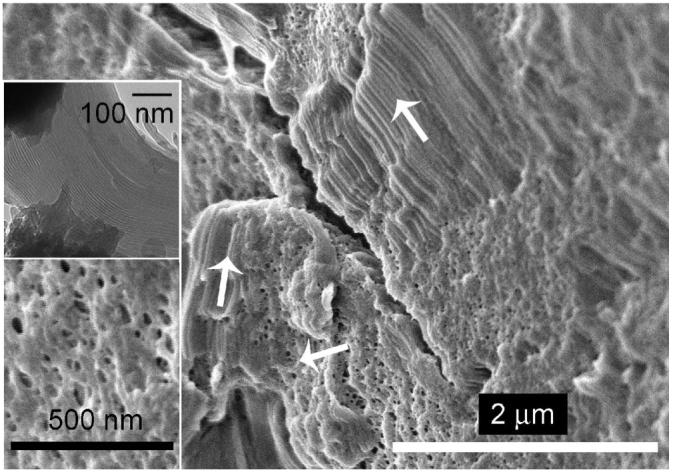
Randomly oriented polycrystalline microdomains (shown by arrows) consisting of long cylinders are observed for the reverse hexagonal phase of the AOT-lecithin-isooctane-water crystalline mesophase (W0 = 70). A higher-magnification image of a cross section of the crystalline mesophase is shown in the lower inset. The TEM image of the mesophase is provided in the upper inset for ease of reference.26
Rather than describing the transition region, we will first focus on the other end of the phase trajectory seen with water addition where lamellar structures are the uniquely existing phase. At a water content of W0 = 200 (point c in Figure 2), there is a prevalence of vesicles, such as that shown in Figure 4. Considerable variation is observed in the diameter of the circular vesicles, with diameters ranging from 100 nm to more than 10 μm. A cryo-FESEM image of such a giant vesicle is shown in Figure 4b. Such giant vesicles would not have been retained or imaged on the TEM because of their large size. On more than one occasion, vesicles embedded within vesicles are observed (e.g., in Figure 4c, 200-400 nm vesicles are found to be enclosed within a 5-μm-wide vesicle). Cryo-FESEM not only provides evidence of the size of vesicles but also lends insight into the multilamellar organization of spherical vesicles, as disclosed in certain micrographs. Figure 4d, for example, shows a vesicle with part of its layers removed during sample fracture (indicated by the arrow), signifying that the vesicle consists of more than one layer. The FFDI cryo-TEM image (inset to Figure 4d) shows a multilamellar vesicle in detail.
Figure 4.
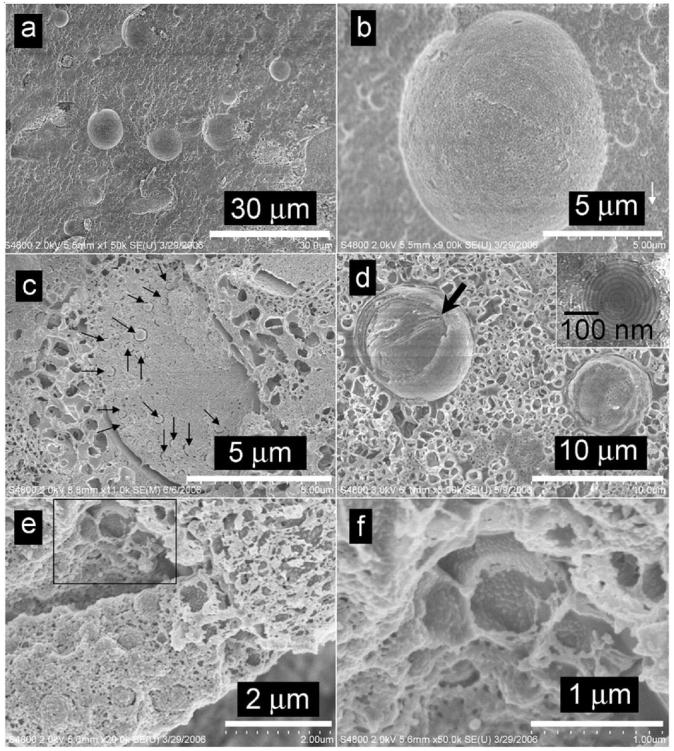
Lamellar domains of the AOT-lecithin-isooctane-water crystalline mesophase (W0 = 200). (a) Giant vesicles, 10 μm wide. (b) Giant and small vesicles are present in the mesophase. White arrow points to a tiny vesicle that is 200 nm wide. (c) Smaller vesicles embedded within a large vesicle. (d) A vesicle with part of its layers removed (arrow) during sample fracture. A TEM image of the lamellar phase is provided in the inset as a reference.26 (e) Concave morphologies are left behind by spherical vesicles removed during sample fracture. (f) A higher-magnification image of the boxed region in e.
Figure 4e illustrates concave morphologies left behind by vesicles that have been removed when the sample was fractured. The micrograph also clearly shows embedded vesicles. A higher-magnification image aiding the improved visualization of these pitlike structures is shown in Figure 4f. Of interest are the noncrystalline, space-filling regions between the vesicles. These regions cannot be easily probed by scattering because they represent concentrated surfactant regions with no evident crystallinity. However, they are amenable to NMR methods, and our recent work indicates both isotropic surfactant signatures and the signature of surfactant arranged in lamellar structures in the NMR spectrum of the sample.25
Finally, it is of interest to examine the surfactant mesophase of intermediate water content (W0 = 140) where both the reverse hexagonal and lamellar domains coexist (point b in Figure 2). In this transition stage, a micrograph illustrating a local variation in morphology where large porous regions intermingle with dense areas is found in Figure 5. The region composed of large pores (indicated by arrows) is indicative of lamellar domains where multilamellar vesicles have been extracted as a result of sample fracture. In alternate locations in the surfactant mesophase, spheres representative of multilamellar vesicles (inset to Figure 5) are observed. Again, the cryo-SEM indicates the demarcations between the hexagonal and lamellar system and provides useful visualizations of these coexisting phases. It is quite remarkable that the double scattering peak seen in our earlier SANS experiments is thus shown to be valid through the cryo-SEM results.23
Figure 5.
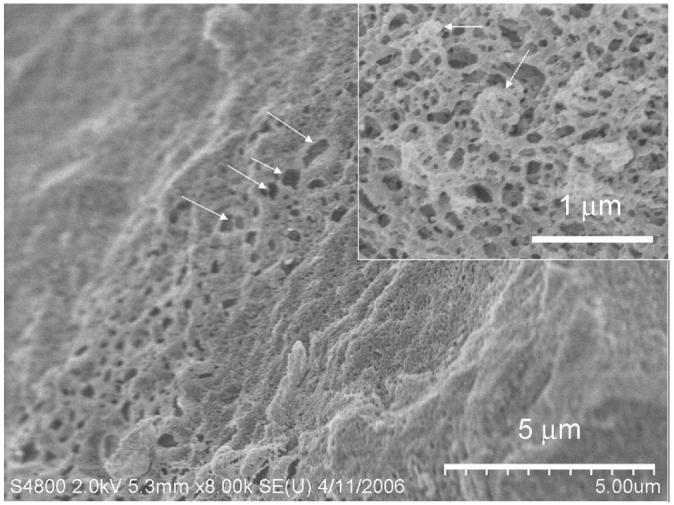
Image showing possible coexistence regions containing both the reverse hexagonal and lamellar phases of the AOT-lecithin-isooctane-water crystalline mesophase (W0 = 140). The inset shows spherical vesicles (arrows) representative of the lamellar phase.
In conclusion, cryo-FESEM provides valuable information on sample morphology. We show that the reverse hexagonal domains and the lamellar phases of a rigid surfactant mesophase can be captured and provide clear verification of SANS and NMR results. Such surfactant mesophases have potential in use as vehicles for drug delivery of both hydrophilic and hydrophobic species, especially in formulations for topical applications. They are also useful as template materials.19,20 The visualization of materials synthesized in these phases using such a technique is a natural extension of the research and will provide insight into materials templating by surfactant mesophases.
Acknowledgment
Funding from the National Science Foundation (grant 0438463), the National Institutes of Health (grant RO1 EB006493-01), and NASA (NAG-1-02070) is gratefully acknowledged.
References
- (1).Imai M, Yoshida I, Iwaki T, Nakaya K. J. Chem. Phys. 2005;122:044906. doi: 10.1063/1.1839559. [DOI] [PubMed] [Google Scholar]
- (2).Singh M, Ford C, Agarwal V, Fritz G, Bose A, John VT, McPherson GL. Langmuir. 2004;20:9931–9937. doi: 10.1021/la048967u. [DOI] [PubMed] [Google Scholar]
- (3).Kitchens CL, Bossev DP, Roberts CB. J. Phys. Chem. B. 2006;110:20392–20400. doi: 10.1021/jp063844z. [DOI] [PubMed] [Google Scholar]
- (4).Faeder J, Ladanyi BM. J. Phys. Chem. B. 2005;109:6732–6740. doi: 10.1021/jp045202m. [DOI] [PubMed] [Google Scholar]
- (5).Sawada K, Ueda M. J. Chem. Technol. Biotechnol. 2004;79:369–375. [Google Scholar]
- (6).Merdas A, Gindre M, Ober R, Nicot C, Urbach W, Waks M. J. Phys. Chem. 1996;100:15180–15186. [Google Scholar]
- (7).Porte G, Appell J. J. Phys. Chem. 1981;85:2511–2519. [Google Scholar]
- (8).Bernheim-Groswasser A, Zana R, Talmon Y. J. Phys. Chem. B. 2000;104:4005–4009. [Google Scholar]
- (9).Oda R, Huc I, Homo JC, Heinrich B, Schmutz M, Candau S. Langmuir. 1999;15:2384–2390. [Google Scholar]
- (10).Bergstrom M, Pedersen JS. Langmuir. 1999;15:2250–2253. [Google Scholar]
- (11).Oda R, Huc I, Schmutz M, Candau SJ, MacKintosh FC. Nature. 1999;399:566–569. doi: 10.1038/21154. [DOI] [PubMed] [Google Scholar]
- (12).Bergstrom M, Pedersen JS. Langmuir. 1998;14:3754–3761. [Google Scholar]
- (13).Oda R, Bourdieu L, Schmutz M. J. Phys. Chem. B. 1997;101:5913–5916. [Google Scholar]
- (14).Zhai L, Zhao M, Sun D, Hao J, Zhang L. J. Phys. Chem. B. 2005;109:5627–5630. doi: 10.1021/jp044596e. [DOI] [PubMed] [Google Scholar]
- (15).Yuet PK, Blankschtein D. Langmuir. 1996;12:3819–3827. doi: 10.1021/la9600513. [DOI] [PubMed] [Google Scholar]
- (16).Strey R, Schomacker R, Roux D, Nallet F, Olsson U. J. Chem. Soc., Faraday Trans. 1990;86:2253–2261. [Google Scholar]
- (17).Israelachvili J. Intermolecular and Surface Forces. 2nd ed. Academic Press; San Diego, CA: 1991. [Google Scholar]
- (18).Singh M, Agarwal V, De Kee D, McPherson G, John V, Bose A. Langmuir. 2004;20:5693–5702. doi: 10.1021/la049700y. [DOI] [PubMed] [Google Scholar]
- (19).Liu L, Singh M, John VT, McPherson GL, He J, Agarwal V, Bose A. J. Am. Chem. Soc. 2004;126:2276–2277. doi: 10.1021/ja0375636. [DOI] [PubMed] [Google Scholar]
- (20).Liu L, Tan G, Agarwal V, Bose A, He J, McPherson GL, John VT. Chem. Commun. 2005:4517–4519. doi: 10.1039/b506171g. [DOI] [PubMed] [Google Scholar]
- (21).Li S, Irvin GC, Simmons B, Rachakonda S, Ramannair P, Banerjee S, John VT, McPherson GL, Zhou W, Bose A. Colloids Surf., A. 2000;174:275–281. [Google Scholar]
- (22).Simmons B, Agarwal V, Singh M, McPherson G, John V, Bose A. Langmuir. 2003;19:6329–6332. [Google Scholar]
- (23).Simmons BA, Irvin GC, Agarwal V, Bose A, John VT, McPherson GL, Balsara NP. Langmuir. 2002;18:624–632. [Google Scholar]
- (24).Liu L, John VT, McPherson G, Maskos K, Bose A. Langmuir. 2005;21:3795–3801. doi: 10.1021/la0477901. [DOI] [PubMed] [Google Scholar]
- (25).Liu L, Tan G, McPherson G, John V, Maskos K, Bose A. Langmuir. 2008 doi: 10.1021/la801130w. in press. [DOI] [PMC free article] [PubMed] [Google Scholar]
- (26).Agarwal V, Singh M, McPherson G, John V, Bose A. Langmuir. 2004;20:11–15. doi: 10.1021/la035375n. [DOI] [PubMed] [Google Scholar]
- (27).Libster D, BenIshai P, Aserin A, Shoham G, Garti N. Langmuir. 2008;24:2118–2127. doi: 10.1021/la702570v. [DOI] [PubMed] [Google Scholar]


