

Abstract
Heat shock proteins (HSPs) are a family of genes classically used to measure levels of organism stress. We have previously identified two HSP70 genes (HSP70A and HSP70B) in sub-tidal populations of the Antarctic limpet (Nacella concinna). These genes are up-regulated in response to increased seawater temperatures of 15°C or more during acute heat shock experiments, temperatures that have very little basis when considering the current Antarctic ecology of these animals. Therefore, the question was posed as to whether these animals could express HSP70 genes when subjected to more complex environmental conditions, such as those that occur in the inter-tidal. Inter-tidal limpets were collected on three occasions in different weather conditions at South Cove, Rothera Point, over a complete tidal cycle, and the expression levels of the HSP70 genes were measured. Both genes showed relative up-regulation of gene expression over the period of the tidal cycle. The average foot temperature of these animals was 3.3°C, far below that of the acute heat shock experiments. These experiments demonstrate that the temperature and expression levels of HSP production in wild animals cannot be accurately extrapolated from experimentally induced treatments, especially when considering the complexity of stressors in the natural environment. However, experimental manipulation can provide molecular markers for identifying stress in Antarctic molluscs, provided it is accompanied by environmental validation, as demonstrated here.
Electronic supplementary material
The online version of this article (doi:10.1007/s12192-008-0015-7) contains supplementary material, which is available to authorized users.
Keywords: Antarctic, Heat shock protein, Stress, Temperature, Inter-tidal
Introduction
To successfully colonise and reproduce in a particular environment, any organism has to be responsive to and able to adapt to changes in their physical surroundings. This is particularly crucial for marine inter-tidal invertebrates as they regularly experience conditions that for most species would constitute acute and potentially lethal stress (for Antarctic inter-tidal stresses, see Waller et al. 2006). As part of their daily routine, they have to cope with periodic tidal emersion and the consequential changes in temperature, desiccation, humidity and ultraviolet irradiation. How animals cope with regular acute stresses has always been of interest to biologists. In particular, thermal biologists/ecologists are interested in how tolerance of temperature varies between species and the effect this has on setting species range boundaries and how species distribution patterns might be affected by climate change (reviewed in Somero 2002; Hofmann 2005).
A key tool in the investigation of stress tolerance has been the characterisation and monitoring of heat shock proteins (HSPs). These are a family of highly conserved proteins, which act as chaperones to stabilise and refold denatured proteins, preventing the formation of cytotoxic aggregates (Parsell and Lindquist 1993; Hartl 1996; Fink 1999; Gross 2004). Numerous families of HSPs have been identified, the naming of which is related to their weight in kilodaltons. One such is the HSP70 family, which, although up-regulated under different stress conditions, is classically associated with transcriptional up-regulation in response to elevated environmental temperatures in most organisms studied to date.
The induction and expression of these HSP70 genes is highly plastic. Levels of induction are influenced by thermal history such as seasonal temperature cycling, vertical zonation and biogeography (reviewed in Somero 2002; Hofmann 2005). Certainly, prior exposure to slightly elevated temperatures (such as summer versus winter water temperatures) increases the temperature at which the HSP70 genes are induced (Buckley et al. 2001; Tomanek 2002). Furthermore, the height of the vertical zonation of animals in the inter-tidal region does influence their heat shock thresholds (Halpin et al. 2002; Stillman 2002; Tomanek 2002). The animals in the studies described above are eurythermal. However, this work has lead to great interest in the response of Antarctic marine organisms, which are highly stenothermal (Somero and DeVries 1967; Peck and Conway 2000; Peck 2002) and lose critical biological functions with temperature elevations of only 1–2°C above current summer maximum seawater temperatures (0–1.8°C; Peck et al. 2004).
The first studies of heat shock responses in Antarctic marine ectotherms showed that both microorganisms and fish did not increase HSP70 expression when warmed (Carratù et al. 1998; Hofmann et al. 2000). However, recent data (Clark et al. 2008) on the heat shock response of Antarctic marine mollusks have shown that the classical heat shock response is initiated in the Antarctic limpet (Nacella concinna) at 15°C and the Antarctic clam (Laternula elliptica) at 8°C. Given that these are temperatures in excess of that which is currently experienced by these animals (Waller et al. 2006), the obvious question to ask is whether these animals express HSP70 when subjected to longer, lower levels of elevated temperatures in the natural environment or in response to multiple environmental insults; that is, is there an environmental context to this response?
N. concinna is an ideal candidate species with which to pose these questions. It is a common Antarctic inter-tidal species and therefore regularly experiences periods of acute stress when it is uncovered at low tide. Inter-tidal limpets were collected on both sunny and cloudy days during the austral summer at South Cove, Rothera Point, from the high water level over a complete tidal cycle. For comparative seasonal data, samples were also collected from the same site at the end of spring. The temperatures of the air, water, limpet foot and shell were logged, and muscle tissue was assayed for the expression of previously characterised inducible HSP70 genes. The objective of this study was to take HSP70 genes, which are known to be up-regulated in response to temperature with a 15°C threshold temperature in laboratory experiments and identify their threshold limits in the field.
Materials and methods
Animal sampling and experimental work
N. concinna were collected from South Cove, Rothera Research Station, Adelaide Island (67°34′11″ S, 68°07′88″ W) during the austral summer (January 2004) and the late spring, whilst there was still snow cover (November 2004). Each sample batch consisted of five animals. Control samples were collected using scuba from sub-tidal populations (6 m depth). Experimental (inter-tidal) samples were collected from the mean mid-tide water level over a complete tidal cycle, and so subsequent batches experienced progressively longer exposure to air temperatures (five collections were made for the sunny day, whilst six collections were made for each of the cloudy and spring days). Hence, batch 1 was just exposed to air, batch 2 had 1 h exposure and subsequent batches at hourly intervals until they were re-immersed (see Supplemental Tables 2, 3 and 4 for full details). Only one set of spring samples was collected, but two batches of summer samples were collected under sunny and cloudy conditions on separate occasions; the air and water temperatures were recorded (±0.1°C) at each sampling point. Limpet shell and foot temperatures were recorded to an accuracy of ±0.1°C in situ using a handheld non-contact infrared thermometer (Supplemental Tables 1, 2, 3 and 4). The shell temperature of the limpet was recorded before the animal was gently pried from the rock. After removal, animals were carefully placed in the shade, and the foot temperature, shell length, width and height were recorded using vernier calipers (±0.1 mm). The shells were removed, and a small (approximately 200 mg) sample of the foot muscle tissue was kept for ribonucleic acid (RNA) extraction later. These samples were stored at 4°C overnight, then at −80°C until required.
Sample analysis
RNA extraction Total RNA was extracted from N. concinna whole foot muscle using TRI reagent (Sigma) according to the manufacturer’s instructions. One microgram of total RNA was DNAse treated using 0.4 U DNase I (Ambion) in 10 mM dithiothreitol/100 mM MgCl2 buffer and reverse transcribed using a first-strand synthesis kit (Promega).
Quantitative polymerase chain reaction Species-specific HSP and actin sequences had been previously characterised (Clark et al. 2008) and were amplified using the following primer sets: HSP70A, Nco1F: ATTCGATGACGAGACGGTTCA and Nco1Rev2P: AACGTCTTCAATTCGCTTTTGTA; HSP70B, Nco3F: AGTTCACCGACGACACAGTAC and Nco3Rev: TATTTTAGTCTCTGATTTGTACTC; and actin primers, NcoActinF: GAGAAATCGTCCGAGACATCAA and NcoActinRev4: CAGCAGATTCCATACCCAAGAA using Brilliant SYBR® Green QPCR Master Mix (Stratagene) with Sure Start® Taq DNA polymerase and an MX3000P (Stratagene). Polymerase chain reaction (PCR) conditions were as follows: 95°C, 10 min, 40 cycles of 95°C 30 s, 60°C, 1 min and 72°C for 1 min with a final dissociation curve step as per manufacturer’s recommendations. The plate setup for each quantitative PCR (Q-PCR) experiment consisted of five control individuals and five “treated” individuals amplified with a specific HSP primer set (designated Expt 1) and an actin control primer set (designated Normaliser). Each HSP and actin amplification experiment was reproduced in triplicate. Each primer set was checked to ensure that no primer dimers were produced during the course of the amplification reaction. RSq values and PCR efficiencies were checked over a fourfold 10× dilution series, and the values were calculated using the MxPro—MX3000P v 3.00 Build 311 Schema 74 software (for RSq and efficiency details, see Clark et al. 2008). Amplifications were analysed using the MxPro—MX3000P v 3.00 Build 311 Schema 74 software, and Ct (dR) values were exported into Excel. Relative expression ratios of the HSP genes compared to the actin housekeeping genes between the control and treated samples were derived using the Relative Expression Software Tool (http://www.gene-quantification.info/; Pfaffl 2001; Pfaffl et al. 2002). This is an Excel macro that incorporates both a mathematical model to calculate relative expression ratios on the basis of the PCR efficiency and crossing point derivation of the investigated samples and a two-sided pairwise fixed reallocation randomisation test. This test makes no assumptions about distribution (such as normality of distribution) and assumes that treatments were randomly allocated. The randomisation test repeatedly and randomly reallocates the observed values to the two groups and notes the apparent effect (expression ratio). The proportion of these effects, which are as great as that actually observed in the experiment, provides the p value of the test. Two thousand randomisations were used in the test (Pfaffl 2001; Pfaffl et al. 2002). These results were then followed by further statistical analysis (MINITAB v 14) using a two-way analysis of variance (ANOVA) to test for the significance of an effect of either gene or batch number. Overall results for each primer pair under each sampling regime were subjected to a two-sample t test to assign significance of results from random variation.
Results
Both HSP genes (HSP70A and HSP70B) were induced under all inter-tidal conditions surveyed. A two-way ANOVA of the three combined datasets showed an effect of batch number (at the 10% level; F4, 4 = 2.48, p = 0.77) but no effect of gene (F1, 4 = 1.54, p = 0.229). Analysing the datasets individually using a two-way ANOVA showed no effect of either gene or batch number for the sunny day samples (F1, 4 = 3.01, p = 0.158; F4, 4 = 1.03, p = 0.49, respectively), although the individual p values for batches 1 and 2 for HSP70A were significant at the 10% level (Fig. 1). The cloudy day samples showed no effect of either gene or batch number (F1, 4 = 6.19, p = 0.68; F4, 4 = 2.56, p = 0.193, respectively) but again provided individually significant results with batch 1 for HSP70A significant at the 5% level and levels of HSP70B significant at the 5% (batch 4) and 10% levels (batches 3 and 6; Fig. 2). The spring day samples showed no effect of either gene (F1, 4 = 2.55, p = 0.185) but showed an effect of batch at the 10% level (F4, 4 = 4.62, p = 0.084). An individually significant result at the 5% level was shown for HSP70B, batch 5 only (Fig. 3). Within the three groups of samples, relative gene expression levels varied from 27.70 to 0.41 for HSP70A and 14.22 to 3.90 for HSP70B, with the highest relative expression levels for HSP70A being more apparent at the early tidal cycle batches where the animals are just becoming uncovered.
Fig. 1.
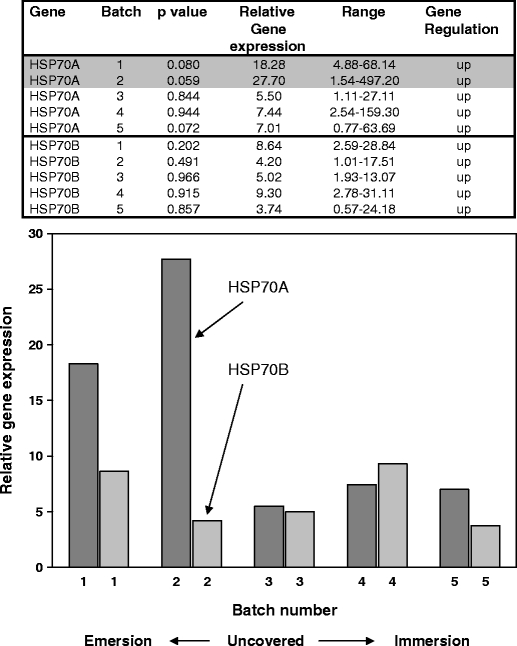
Q-PCR results for N. concinna HSP70A and HSP70B genes from animals collected on a sunny day in the austral summer. Relative expression ratios of the HSP genes from control compared to experimental animals are shown both in table format and graphically. Significant individual p values (10% level) with the different batches are shaded. Two-sample t test of HSP70A expression levels in environmental samples compared to controls gave a p value of 0.000. Two-sample t test of HSP70B expression levels in environmental samples compared to controls gave a p value of 0.000
Fig. 2.
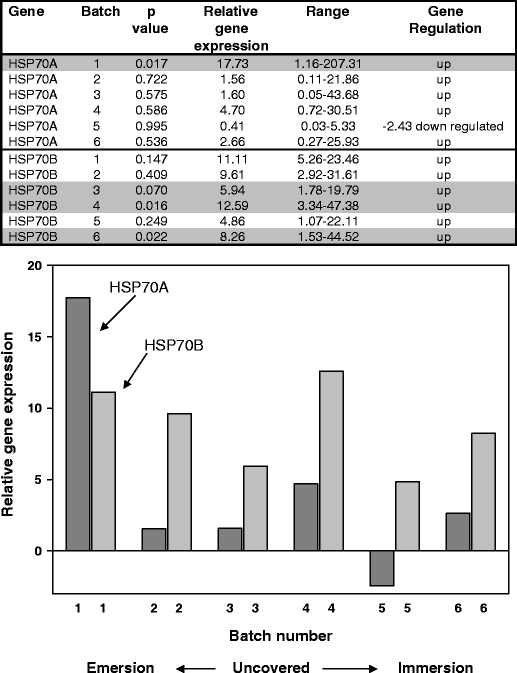
Q-PCR results for N. concinna HSP70A and HSP70B genes from animals collected on a cloudy day in the austral summer. Relative expression ratios of the HSP genes from the control compared to experimental animals are shown both in table format and graphically. Significant individual p values (5% and 10% level) with the different batches are shaded. Two-sample t test of HSP70A expression levels in environmental samples compared to controls gave a p value of 0.062. Two-sample t test of HSP70B expression levels in environmental samples compared to controls gave a p value of 0.000
Fig. 3.
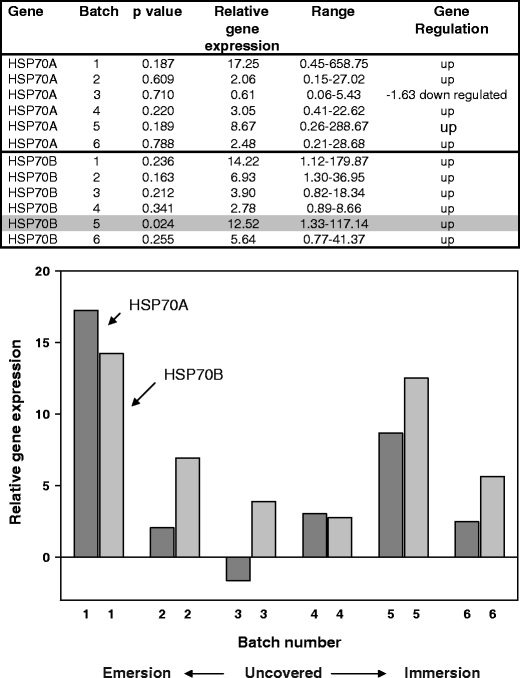
Q-PCR results for N. concinna HSP70A and HSP70B genes from animals collected on a late day in the austral summer. Relative expression ratios of the HSP genes from control compared to experimental animals are shown both in table format and graphically. Significant individual p values (5% and 10% level) with the different batches are shaded. Two-sample t test of HSP70A expression levels in environmental samples compared to controls gave a p value of 0.011. Two-sample t test of HSP70B expression levels in environmental samples compared to controls gave a p value of 0.000
The average foot temperature of the sunny day animals was 3.3°C with an SD of 1.07 and a range of 4.6 (data from Supplemental Table 2). The average foot temperature of the animals on a cloudy day was 3.8°C with an SD of 1.26 and a range of 5.5 (data from Supplemental Table 3). The spring samples, whilst overall having a lower mean foot temperature of 2.1°C, showed a much wider temperature range of 9.4°C, which is reflected in the higher SD of 2.0 when compared to the other two samplings (data from Supplemental Table 4). In this sampling set, it was noted that some of the animals that were taken were in the sun and therefore were exposed to higher levels of solar radiation.
Discussion
Previous experiments (Clark et al. 2008) have indicated that N. concinna has a 15°C induction threshold for the HSP70A and HSP70B genes. The data presented here show that in the natural inter-tidal environment, these genes are up-regulated when the foot temperatures of the animals are only 3°C. HSPs were named initially because of their role in cellular protection from heat stress but are, in fact, generalised stress proteins and are activated under several different conditions, e.g. hypoxia, cadmium etc. (reviewed in Sorensen et al. 2003). Inter-tidal animals, in particular, have many different environmental conditions to accommodate: periodic tidal emersion, changes in temperature, desiccation, oxygen availability, humidity and ultraviolet irradiation (Menge and Branch 2001). In Antarctica, these stresses are enhanced by physical disturbance from ice, low temperature freezing and extreme seasonality of resource availability (Peck et al. 2006). The overall stress load on inter-tidal limpets is therefore great, and it may be that the combined stress is equivalent to the higher temperatures needed in the laboratory to elicit a heat shock response (cf. Halpin et al. 2002; Todgham et al. 2006).
Overall, there is a statistically significant effect (at the 10% level) of batch indicating that tidal emersion and immersion play a role in the induction of heat shock genes in these animals. Comparing the individual p values and the ANOVA analyses, there appears to be a difference in the relative expression levels of HSP70A compared to HSP70B over the period of the tidal cycle, with HSP70A most highly expressed when the animals are first uncovered and significant results for HSP70B present in the latter half of the tidal cycle (when the animals are becoming covered again). This difference in expression pattern between paralogous genes is not uncommon. The most parsimonious explanation for the presence of two closely related HSP70 genes is a gene duplication event, and the maintenance of such duplicates is invariably by a process of sub-functionalisation (Force et al. 1999), with each gene performing a slightly different but vital cellular function. Work is currently underway in our laboratory to identify the triggers of HSP70 expression in these animals, as factors other than heat are clearly involved given the HSP threshold induction temperature of 15°C in Clark et al. (2008).
The statistical significance of the results under the three different environmental conditions is confounded by high individual genetic variability (discussed in greater detail in Clark et al. 2008). Hence, care has to be taken with the Q-PCR results and regarding the relative differences in gene expression as an absolute figure. In reality, the data have to be examined more globally, and general trends have to be extracted. Virtually all the different batches of animal collections show up-regulation of both HSP70A and HSP70B expression. If this was a random event, 50% up-regulation and 50% down-regulation would be expected. These results are highly significant as shown by the results of the two-sample t tests. Therefore, the environmentally sampled animals do show significant up-regulation of both HSP70 genes compared to the sub-tidal control animals, indicating higher endogenous levels of chronic stress. Sub-tidal animals were chosen as the controls as they inhabit a stable environment and were the animals shown to have an acute HSP threshold temperature of 15°C. The tides at Rothera are normally limited to 0.8 m, and therefore all animals in this zone will experience a wider range of temperatures even when covered by water.
For decades, it was considered that the Antarctic inter-tidal zone did not have permanent residents and species; for example, N. concinna were merely transient. Recent intensive sampling has shown that in fact many diverse species occur there and that some, again such as N. concinna, survive below the icefoot covering the inter-tidal in winter (Waller et al. 2006). Although the long-term monitoring of air temperatures at Rothera shows variation between +5°C and −25°C and seawater at 15 m depth ranging from +1.8°C to −1.8°C (Fig. 4a and b), microhabitat temperatures, e.g. rock surfaces, can differ considerably from this, and the animals will be affected by zonation (Fig. 4c). Few marine invertebrates are capable of colonising the high inter-tidal zone and surviving there (Waller et al. 2006), so N. concinna probably experiences amongst the widest temperature ranges of any marine Antarctic endemic species (Barnes et al. 2006). This is true for both sub-tidal and inter-tidal N. concinna because of its wide geographic and tidal range (Barnes et al. 2006). Therefore, despite being an Antarctic endemic, the model organism we studied is in some ways extreme.
Fig. 4.
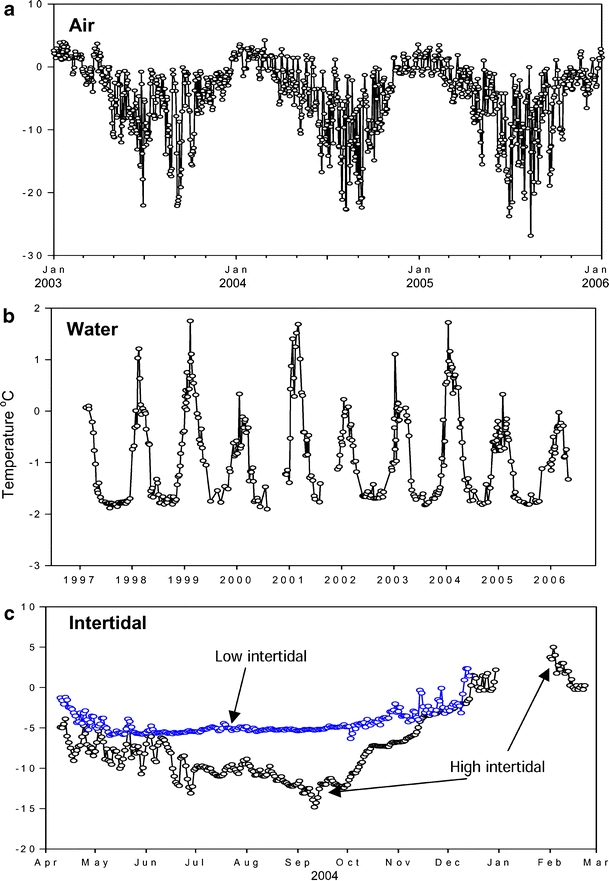
Mean air (a), seawater (b) and inter-tidal temperatures (c) recorded at Rothera Research Station. Air temperature data were provided by the British Antarctic Meteorological Department, seawater temperatures (at 15 m depth) were taken from the Rothera oceanographic Time series (RaTS) and inter-tidal data were taken from Waller (PhD thesis, 2007)
We have now shown that two very distantly related Antarctic molluscs (N. concinna and L. elliptica) have the ability to up-regulate HSPs (Clark et al. 2008). We have extended these laboratory-based studies with an investigation of HSP expression in wild N. concinna, which shows that the temperature and expression levels of HSP production in wild animals cannot be accurately predicted using experimentally induced acute heat shock treatments (cf. Lund et al. 2002), especially in this case when considering the much more complex stresses of the inter-tidal zone. However, the controlled laboratory-based physiological experiments were essential for the cloning of the genes and defining the nature of the heat shock response, particularly against a high background of inter-individual genetic variation. Our work on N. concinna has provided us with a methodology for identifying molecular stress markers in Antarctic mollusks and their validation in environmental monitoring studies. These data take advantage of the inter-tidal ecosystem and demonstrate for the first time the effective combination of field ecology and physiology in Polar research.
Electronic supplementary material
Below is the link to the electronic supplementary material.
Details of control animals collected by SCUBA divers from 6 m depth, South Cove: January 17, 2004 (DOC 24.5 KB)
Environmental and morphometric details of inter-tidal N. concinna collected on a summer “sunny” day: January 11, 2004 (DOC 57.0 KB)
Environmental and morphometric details of inter-tidal N. concinna collected on a summer “cloudy” day: January 07, 2004 (DOC 97.5 KB)
Environmental and morphometric details of inter-tidal N. concinna collected during November (spring): November 15, 2004 (DOC 60.5 KB)
Acknowledgements
This paper was produced within the BAS Q3 LATEST and BAS Q4 BIOREACH/BIOFLAME core programmes. Thanks to all members of the Rothera Dive Team for providing samples and to Pete Rothery for statistics advice. Overall diving support was provided by the NERC National Facility for Scientific Diving at Oban.
Footnotes
Electronic supplementary material
The online version of this article (doi:10.1007/s12192-008-0015-7) contains supplementary material, which is available to authorized users.
References
- Barnes DKA, Fuentes V, Clarke A, Schloss IR, Wallace M (2006) Spatial and temporal variation in shallow seawater temperatures around Antarctica. Deep-Sea Res Part 2 53:853–865 [DOI]
- Buckley BA, Owen M-E, Hofmann GE (2001) Adjusting the thermostat: the threshold induction temperature for the heat-shock response in intertidal mussels genus Mytilus) changes as a function of thermal history. J Expt Biol 204:3571–3579 [DOI] [PubMed]
- Carratù L, Gracey AY, Buono S, Maresca B (1998) Do Antarctic fish respond to heat shock? In: di Prisco G, Pisano E, Clarke A (eds) Fishes of Antarctica. A biological overview. Springer, Italy
- Clark MS, Fraser KPPF, Peck LS (2008) The HSP70 heat shock response in Antarctic marine molluscs. Cell Stress Chaperones (in press) [DOI] [PMC free article] [PubMed]
- Fink AL (1999) Chaperone-mediated protein folding. Physiol Rev 79:425–449 [DOI] [PubMed]
- Force A, Lynch M, Pickett FB, Amores A, Yan YL, Postlethwait J (1999) Preservation of duplicate genes by complementary, degenerative mutations. Genetics 151:1531–1545 [DOI] [PMC free article] [PubMed]
- Gross M (2004) Emergency services: a bird’s eye perspective on the many different functions of stress proteins. Curr Protein Peptide Sci 5:213–223 [DOI] [PubMed]
- Halpin PM, Sorte CJ, Hofmann GE, Menge BA (2002) Patterns of variation in levels of Hsp70 in natural rocky shore populations from microscales to mesoscales. Am J Physiol Integr Comp Biol 42:815–824 [DOI] [PubMed]
- Hartl FU (1996) Molecular chaperones in cellular protein folding. Nature 381:571–580 [DOI] [PubMed]
- Hofmann GE (2005) Patterns of gene expression in ectothermic marine organisms on small to large-scale biogeographical patterns. Intergr Comp Biol 45:247–255 [DOI] [PubMed]
- Hofmann GE, Buckley BA, Airaksinen S, Keen JE, Somero GN (2000) Heat-shock protein expression is absent in the Antarctic fish Trematomus bernacchii (family Nototheniidae). J Expt Biol 203:2331–2339 [DOI] [PubMed]
- Lund SG, Caissie D, Cunjak RA, Vijayan MM, Tufts BL (2002) The effects of environmental heat stress on heat-shock mRNA and protein expression in Miramichi Atlantic salmon (Salmo salar) parr. Can J Fish Aquat Sci 59:1553–1562 [DOI]
- Menge BA, Branch GM (2001) Rocky intertidal communities. In: Bertness MD, Gaines SD, Hay ME (eds) Marine community ecology. Sinauer, Sunderland, MA, pp 221–251
- Parsell DA, Lindquist S (1993) The function of heat-shock proteins in stress tolerance – degradation and reactivation of damaged proteins. Ann Rev Genet 27:437–496 [DOI] [PubMed]
- Peck LS (2002) Ecophysiology of Antarctic marine ectotherms: limits to life. Polar Biol 25:31–40 [DOI]
- Peck LS, Conway LZ (2000) The myth of metabolic cold adaptation: oxygen consumption in stenothermal Antarctic bivalve molluscs. In: Harper E, Crame AJ (eds) Evolutionary biology of the bivalvia. Geological Society of London Special publication no. 177. Cambridge University Press, Cambridge, pp 441–450
- Peck LS, Webb KE, Bailey DM (2004) Extreme sensitivity of biological function to temperature in Antarctic marine species. Funct Ecol 18:625–630 [DOI]
- Peck LS, Convey P, Barnes DKA (2006) Environmental constraints on life histories in Antarctic ecosystems: tempos, timings and predictability. Biol Rev 81:75–109 [DOI] [PubMed]
- Pfaffl MW (2001) A new mathematical model for relative quantification in real-time RT-PCR. Nucleic Acids Res 29:2002–2007 [DOI] [PMC free article] [PubMed]
- Pfaffl MW, Horgan GW, Dempfle L (2002) Relative expression software tool (REST©) for group-wise comparison and statistical analysis of relative expression results in real-time PCR. Nucleic Acids Res 30:1–10 [DOI] [PMC free article] [PubMed]
- Somero GN (2002) Thermal physiology and vertical zonation of intertidal animals: optima, limits and costs of living. Am J Physiol Integr Comp Biol 42:780–789 [DOI] [PubMed]
- Somero GN, DeVries AL (1967) Temperature tolerance of some Antarctic fishes. Science 156:257–258 [DOI] [PubMed]
- Sorensen JG, Kristensen TN, Loeschcke V (2003) The evolutionary and ecological role of heat shock proteins. Ecol Lett 6:1025–1037 [DOI]
- Stillman JH (2002) Causes and consequences of thermal tolerance limits in rocky intertidal porcelain crabs, genus Petrolishes. Am J Physiol Integr Comp Biol 42:790–796 [DOI] [PubMed]
- Todgham AE, Iwama GK, Schulte PM (2006) Effects of the natural tidal cycle and artificial temperature cycling on Hsp levels in the tidepool sculpin Oligocottus maculosus. Physiol Biochem Zool 79:1033–1045 [DOI] [PubMed]
- Tomanek L (2002) The heat shock response: its variation, regulation and ecological importance in intertidal gastropods (genus Tegula). Am J Physiol Integr Comp Biol 42:797–807 [DOI] [PubMed]
- Waller CL (2007) Life across the divide: comparative studies of the ecology and physiology of species across the Antarctic intertidal zone. Open University
- Waller C, Barnes DKA, Convey P (2006) Ecological contrasts across an Antarctic land–sea interface. Austral Ecol 31:656–666 [DOI]
Associated Data
This section collects any data citations, data availability statements, or supplementary materials included in this article.
Supplementary Materials
Below is the link to the electronic supplementary material.
Details of control animals collected by SCUBA divers from 6 m depth, South Cove: January 17, 2004 (DOC 24.5 KB)
Environmental and morphometric details of inter-tidal N. concinna collected on a summer “sunny” day: January 11, 2004 (DOC 57.0 KB)
Environmental and morphometric details of inter-tidal N. concinna collected on a summer “cloudy” day: January 07, 2004 (DOC 97.5 KB)
Environmental and morphometric details of inter-tidal N. concinna collected during November (spring): November 15, 2004 (DOC 60.5 KB)