

Summary
The Xenopus oocyte has been a favored model system in which to study spatio-temporal mechanisms of intracellular Ca2+ dynamics, in large part because this giant cell facilitates intracellular injections of Ca2+ indicator dyes, buffers and caged compounds. However, the recent commercial availability of membrane-permeant ester forms of caged IP3 (ci-IP3) and EGTA, now allows for facile loading of these compounds into smaller mammalian cells, permitting control of [IP3]i and cytosolic Ca2+ buffering. Here, we establish the human neuroblastoma SH-SY5Y cell line as an advantageous experimental system for imaging Ca2+ signaling, and characterize IP3-mediated Ca2+ signaling mechanisms in these cells. Flash photorelease of increasing amounts of i-IP3 evokes Ca2+ puffs that transition to waves, but intracellular loading of EGTA decouples release sites, allowing discrete puffs to be studied over a wide range of [IP3]. Puff activity persists for minutes following a single photorelease, pointing to a slow rate of i-IP3 turnover in these cells and suggesting that repetitive Ca2+ spikes with periods of 20-30s are not driven by oscillations in [IP3]. Puff amplitudes are independent of [IP3], whereas their frequencies increase with increasing photorelease. Puff sites in SH-SY5Y cells are not preferentially localized near the nucleus, but instead are concentrated close to the plasma membrane where they can be visualized by total internal reflection microscopy, offering the potential for unprecedented spatio-temporal resolution of Ca2+ puff kinetics.
Introduction
A major mechanism of cellular Ca2+ signaling involves the liberation of Ca2+ ions from the endoplasmic reticulum through inositol 1,4,5-trisphosphate receptor-channels (IP3Rs). [1-3]. Opening of the IP3R channel requires binding of the second messenger IP3 together with Ca2+ to receptor sites on the cytosolic face. Gating by Ca2+ is biphasic, such that small elevations of cytosolic Ca2+ induce channel opening whereas larger elevations cause inactivation [4, 5]. The positive feedback by Ca2+ underlies the process known as Ca2+-induced Ca2+ release (CICR), whereby Ca2+ is released in a regenerative manner that may remain restricted to a cluster of IP3R producing local Ca2+ signals known as Ca2+ puffs [6], or propagate throughout the cell as a saltatory wave involving the recruitment of multiple puff sites by successive cycles of Ca2+ diffusion and CICR. Thus, IP3-mediated Ca2+ signaling represents a hierarchy of Ca2+ events of differing magnitudes [7, 8].
Xenopus oocytes have been a favored model cell system in which to study the physiology of fundamental and elementary IP3-mediated elementary Ca2+ release events [9-14] and their roles in supporting global Ca2+ waves [15, 16]. Advantages of the oocyte include its lack of ER Ca2+ release channels other than IP3Rs (e.g., ryanodine receptors (RyRs) and cADP-ribose receptors) [17] and its large size (∼1 mm diameter), which facilitates experimental procedures such as injection of cell-impermeant compounds. In particular, intracellular injection of caged IP3 permits precise control of [IP3]i via flash photolysis [18, 19] and, in conjunction with intracellular loading of the ‘slow’ Ca2+ buffer EGTA to disrupt CICR between puff sites and thereby ‘balkanize’ global Ca2+ events into multiple independent puff loci, has enabled detailed analysis of puff dynamics as a function of [IP3]i [10, 20].
Following the original discovery of Ca2+ puffs in Xenopus oocytes [21, 22], analogous events have been observed in numerous cell types, indicating that puffs are a ubiquitous feature of cellular Ca2+ signaling [15, 23, 24]. They form the building blocks from which global Ca2+ signals are constructed [1, 25] and may also serve local signaling functions in their own right, such as controlling action potential propagation at neuritic branch points by activating Ca2+-dependent K+ channels to reduce neuronal excitability [26]. However, studies of Ca2+ puffs in neurons and other mammalian cells of ‘normal’ size have been greatly hindered by inability to control [IP3]i. Bootman and colleagues [2, 15, 27] made extensive studies in HeLa and other cultured cell lines employing extracellular agonists to evoke IP3 production, but this method provides only an imprecise regulation of [IP3]i within the narrow concentration ‘window’ required to evoke puffs; as does an alternative approach of incubating cells with membrane-permeant IP3 esters to cause a slow increase in [IP3]i [23]. Although caged IP3 can be introduced into small cells by whole-cell patch-clamping [28-30], this method is technically demanding and severely limits the throughput at which multiple cells can be examined.
In order to circumvent this problem, we describe here the use of a membrane permeant caged-IP3 (ci-IP3) [31-33] [34] to characterize elementary Ca2+ release events in the human neuroblastoma SH-SY5Y cell line. We show that strong UV flash photolysis of ci-IP3 causes the generation of Ca2+ oscillations, whereas weaker photo-release evokes puffs. Intracellular loading of EGTA via a membrane-permeant ester devolves the waves evoked by even strong photo-release of IP3 into discrete, highly localized and transient puffs, that persist for several minutes. The frequency of Ca2+ puff sites is highly sensitive to increasing [IP3]i and there is also a significant heterogeneity between sites with some evoking a high frequency and others a lower frequency of puffs to similar [IP3]i. Puff sites in the SH-SY5Y cells are not preferentially localized near the nucleus, but instead are concentrated very close to the plasma membrane where they can be visualized with high resolution by total internal reflection (TIRF) microscopy.
Materials and Methods
Cell Culture
Human neuroblastoma SH-SY5Y cells were cultured in a mixture of Ham's F12 medium and Eagle's minimal essential medium (1:1 mixture), supplemented with 10% (v/v) fetal calf serum and 1% nonessential amino acids. Cells were incubated at 37 °C in a humidified incubator gassed with 95% air and 5% CO2, passaged every 7 days and used for up to 20 passages. When required for fluorimetric studies, cells were harvested in phosphate-buffered saline (PBS) without Ca2+ or Mg2+ and sub-cultured on glass coverslips at a seeding density of 3×10⁴ cells/ml. Changes in [Ca2+]i were measured in SH-SY5Y cells adherent to glass coverslips after 4 days in culture. For intracellular loading, cells were incubated at room temperature with HEPES-buffered saline (HBS - composition in mM; NaCl 135, KCl 5, MgSO4 1.2, CaCl2 2.5, HEPES 5, and glucose 10) containing 1 μM ci-IP3/PM for 45 mins, after which 1 μM fluo-4AM was added to the loading solution for a further 45 min before washing and allowing at least 30 mins for desterification. A further 45 min incubation with 1 μM EGTA-AM was performed for experiments requiring intracellular loading of EGTA.
Bright Field and Total Internal Reflection Microscopy
Imaging of changes in [Ca2+]i was accomplished using a home-built microscope system that could be used in either wide-field epifluorescence or total internal reflection (TIRF) modes [35]. The system was based around an Olympus IX 70 microscope equipped with an Olympus 60× TIRF objective (N.A. 1.45). Excitation light from the expanded beam of an argon ion laser (488 nm) was reflected by a dichroic mirror and brought to a focus at the rear focal plane of the objective. Translation of a focusing lens allowed the beam to be introduced either at the extreme edge of the objective aperture (for TIRF excitation) or more centrally (for “wide field” excitation). An adjustable rectangular aperture placed at a conjugate image plane in the excitation path restricted illumination to within the imaging field of the camera, and the aperture was overfilled by collimated laser light emerging from a 10× beam expander to provide Koehler illumination. Emitted fluorescence was collected through the same objective, passed through an Olympus fluorescence cube (490 nm dichroic, 510–600 nm bandpass barrier filter) and imaged using a Cascade 128+ electron-multiplied c.c.d. camera (Roper Scientific).
Fluorescence signals are expressed as ratios (F/F0 or ΔF/F0) of the fluorescence (F) at each pixel relative to the mean resting fluorescence (F0) prior to stimulation. Data are presented as mean ± 1 S.E.M. IP3 was photoreleased from a caged precursor by delivering flashes of UV light (350 – 400 nm) focused uniformly throughout the field of view. The amount of photo-released i-IP3 was controlled by varying flash duration. Image data were streamed to computer memory and then stored on disc for offline analysis using the MetaMorph software package (Molecular Dynamics).
Materials
The membrane permeant caged IP3 analogue ci-IP3/PM (D-2,3-O-Isopropylidene-6-O-(2-nitro-4,5-dimethoxy)benzyl-myo-Inositol 1,4,5-trisphosphate-Hexakis(propionoxymethyl) Ester) was diluted in pluronic F-127 (20% solution in DMSO) to a stock concentration of 200 μM and frozen down into 2 μl aliquots until needed. ci-IP3/PM was purchased from SiChem (Bremen, Germany). EGTA-AM, Fluo-4 AM, calcein green-AM and pluronic F-127 were from Invitrogen (Carlsbad, CA). Thiazole orange was obtained from AnaSpec, (San Jose, CA). All other reagents were purchased from Sigma (St. Louis).
Results
Local and global Ca2+ signals evoked by agonist activation and by photoreleased IP3
We first characterized the patterns of Ca2+ signals evoked in SH-SY5Y cells by agonist activation, employing wide-field epifluorescence imaging of the Ca2+ indicator dye Fluo-4. Bath application of relatively high (100 μM) concentrations of the muscarinic agonist carbachol evoked global cellular Ca2+ elevations that oscillated in 32% of cells (n = 45) with periods of 20-30 s (Fig. 1A). The remaining non-oscillatory cells displayed a single Ca2+ transient that decayed to baseline with a half time of 29.37 ± 3.86s. In HELA cells [2, 27] low concentrations of agonist have been shown to evoke discrete Ca2+ puffs without triggering global Ca2+ waves, but our attempts using a range of carbachol concentrations (1 nM - 1 μM) to exclusively evoke localized events failed. Low concentrations of carbachol either gave no response at all, or triggered Ca2+ waves that swept throughout the cell. However, in the latter case localized puffs could often be identified on the rising phase of Ca2+ waves (Fig. 1B).
Figure 1. Local and global Ca2+ signals evoked using agonist or UV-flash photolysis of ciIP3 in SH-SY5Y cells.
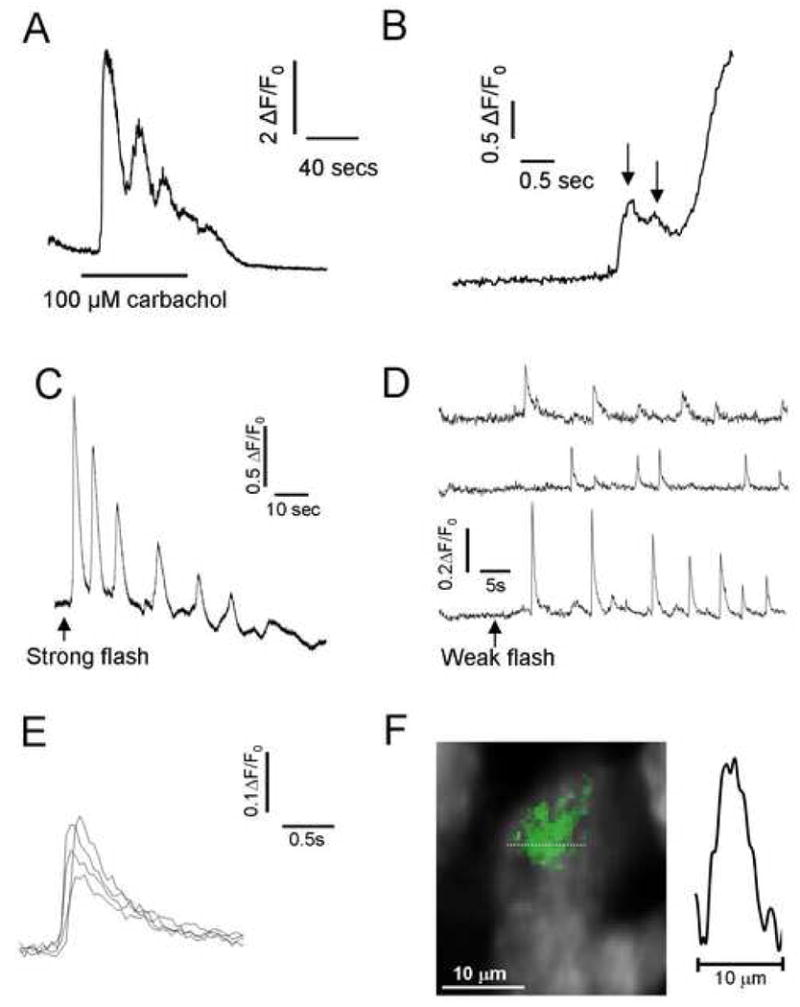
A, Fluorescence trace illustrating global [Ca2+]i oscillations in an SH-SY5Y cell evoked by extracellular application of 100 μM carbachol when indicated by the bar. B, Example of local Ca2+ puffs on the rising phase of a global Ca2+ response evoked by carbachol application (100 μM). C, Global Ca2+ oscillations evoked by a strong (800 ms) UV photolysis flash in a cell loaded with membrane fluo-4AM and ciIP3/PM. D, Local Ca2+ puffs evoked by weaker (100 ms flash) photorelease of i-IP3 in another cell. Traces show fluorescence signals monitored simultaneously from 3 small (1.65 × 1.65 μm) regions of interest. E, Superimposed traces of representative Ca2+ puffs like those in (D), aligned and shown on an expanded time scale. F, Image shows a Ca2+ puff (pseudocolored in green) captured at the time of peak amplitude from a single video frame and superimposed on a monochrome image of resting fluo-4 fluorescence in an SH-SY5Y cell. The trace shows measurement of Ca2+-dependent fluorescence along the dotted line in the image passing through the center of the puff.
To better study the properties of Ca2+ puffs in SH-SY5Y cells we then took advantage of the recent availability of a membrane-permeant ester of caged IP3 so as to achieve a more precise control of [IP3]i via flash photorelease. Exposure of ci-IP3-loaded cells to a relatively long UV flash (800ms) evoked global Ca2+ oscillations in approximately 50% of cells (Fig. 1C). The remaining non-oscillatory cells displayed a single Ca2+ transient that decayed to baseline with a half time of 47 ± 4s. Shorter photolysis flash durations (∼100 ms) failed to evoke global Ca2+ waves, but instead elicited localized, transient Ca2+ puffs at discrete sites (Fig. 1 D). Puffs showed a rapid rise (time to peak = 98 ± 8.34 ms, n=12), followed by a roughly exponential return to baseline with a half-decay time of 310 ± 10 ms (Fig. 1E). Their spatial spread (full-width at half-maximal amplitude: FWHM) at time of peak amplitude was 3.5 ± 0.25 μm (Fig. 1F).
Balkanization of Ca2+ signals using membrane permeant EGTA-AM
Although photorelease of i-IP3 provided a means to evoke discrete puffs, detailed studies were still hampered because this was possible only within a narrow ‘window’ of i-IP3 concentrations (flashes > 500 ms evoked waves), and because the wide spatial extent of the Ca2+ signal precluded precise localization of the Ca2+ source. We had previously overcome these problems in Xenopus oocytes by injecting them with the slow Ca2+ buffer EGTA to inhibit Ca2+ diffusion between puff sites, so as to balkanize Ca2+ liberation such that individual release sites act autonomously to generate discrete puffs rather than functioning in concert to generate a Ca2+ wave. [10, 20]. We thus incubated SH-SY5Y cells with a membrane permeant ester of EGTA (1 μM for 45 min) following loading with ci-IP3 and Fluo-4. This treatment devolved Ca2+ signals into discrete transients at several autonomous puff sites within each cell, even following long photolysis flashes that would otherwise have evoked global Ca2+ oscillations (compare Figs. 1C and 2A). In the presence of EGTA strong photorelease of i-IP3 evoked a high frequency of puffs, whereas weaker stimuli gave puffs of similar mean amplitude but much lower frequency (Figs. 2A,B). EGTA greatly accelerated the time course of Ca2+ puffs (Fig. 2C), and narrowed their spatial spread (FWHM 1.05 ± 0.8 μm). Fig. 2E further presents quantitative comparisons of puff properties with and without EGTA loading. The mean amplitude and frequency of puffs evoked by 200 ms photolysis flashes were not significantly changed, whereas their decay time constant shortened about 5-fold. EGTA loading thus greatly facilitated analysis of puff properties over a wide range of photoreleased [i-IP3], and all results in the following sections were obtained using this procedure.
Figure 2. Cytosolic loading of EGTA uncouples global Ca2+ waves and sharpens local Ca2+ events.
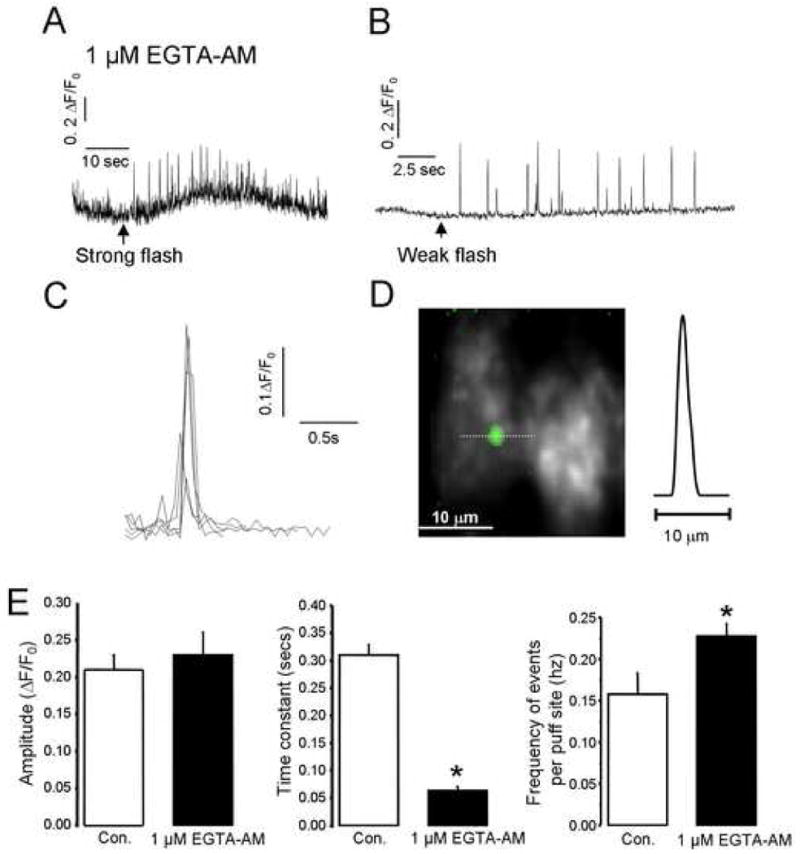
A, B, Ca2+ puffs evoked, respectively, by strong and weak photolysis flashes equivalent to those in Figs. 1C, D in SH-SY5Y cells loaded with EGTA. Global responses were abolished, and the traces show local signals measured from small regions of interest centered over puff sites. C, Superimposed traces of representative Ca2+ puffs like those in (B), aligned and shown on an expanded time scale. D, Image shows a Ca2+ puff (pseudocolored in green) captured at the time of peak amplitude from a single video frame and superimposed on a monochrome image of resting fluo-4 fluorescence in an SH-SY5Y cell. The trace shows measurement of Ca2+-dependent fluorescence along the dotted line in the image passing through the center of the puff. E, Histograms showing (left to right) mean values of puff amplitudes, decay time constants and puff frequency evoked by weak photorelease of i-IP3 without (open bars, n = 15 cells) and with (closed bars, n = 23) loading by 1 μM EGTA-AM.
Dependence of puff properties on [IP3]i
Fig. 3A illustrates representative patterns of puff activity at individual puff sites following photolysis flashes of varying durations. Puff activity persisted for several minutes, enabling many measurements to be obtained from a single trial, and we generally exposed any given cell to only a single stimulus. Increasing flash durations evoked progressively greater frequencies of puffs at individual sites (Fig. 3B), and the mean frequency of puffs per cell increased supralinearly with increasing flash durations (Fig. 4A). Following flashes of all durations there was a slow decrease in puff frequency throughout the course of the imaging record, with the mean frequency declining to about one-half after 1-2 min (Fig. 3B). Much of this decline is likely attributable to degradation of the photoreleased i-IP3, and from the observed dependence of puff frequency on flash duration (cf. Fig. 4B), this suggests that the half-life of i-IP3 in SH-SY5Y cells is of the order of 1-2 min.
Figure 3. Ca2+ puffs evoked by varying amounts of photoreleased i-IP3.
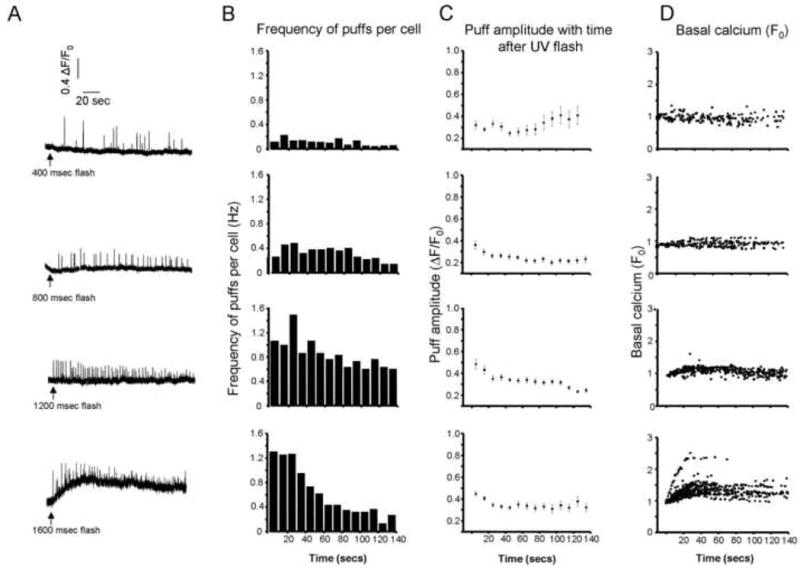
A, Representative fluorescence traces illustrate Ca2+ puffs evoked by photolysis flashes of increasing duration in cells loaded with EGTA. B, Histograms show mean frequencies of Ca2+ puffs per cell at different times following photolysis flashes with durations of (from top to bottom); 400 ms (n = 203 puffs), 800 ms (n = 239), 1200 ms (n = 350) and 1600 ms (n = 550) UV-flashes. C, Corresponding plot of mean puff amplitudes at different times following photolysis flashes. D, Scatter plots of mean basal Ca2+ fluorescence as functions of time following each UV-flash.
Figure 4. Dependence of puff parameters on concentration of photoreleased i-IP3.
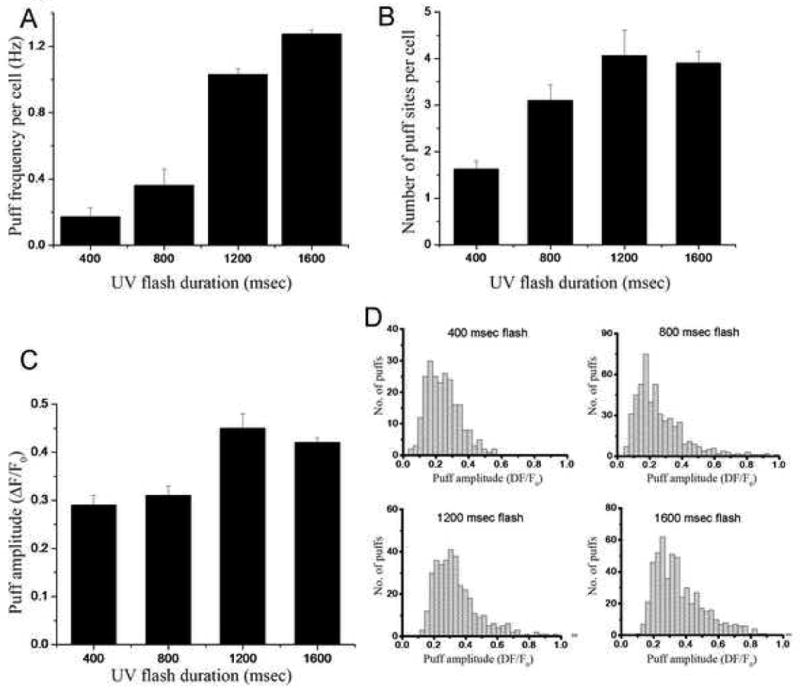
A, Mean puff frequency per cell recorded during the first 20 seconds following photolysis flashes with durations of 400 msec (n = 100 puffs), 800 msec (n = 36), 1200 msec (n= 62) and 1600 msec (n = 153). (B) Mean numbers of puff sites recruited per cell by UV-flashes with durations of 400ms (n = 43 cells), 800ms (n = 20), 1200ms (n = 16) and 1600 ms (n = 21 cells). C, Mean amplitudes of puffs occurring within 20 seconds following UV-flashes with durations as indicated. D, Distributions of puff amplitudes evoked by UV-flashes with durations as indicated. All data were derived from experiments like that in Fig. 3A.
The effect of increasing photorelease of i-IP3 was to increase both the frequency of puffs at a given site, and to increase the number of sites that responded in a cell. Whereas strong (>1000 ms flashes) usually evoked activity at four or more discrete sites, weak flashes (400 ms duration) typically evoked puffs at only one or two sites (Fig. 4B). In the latter case, the failure to observe puffs at ‘silent’ sites was not simply due to statistical variation, because the mean frequency at responding sites was sufficiently high (0.2 ± 0.03 Hz) that the likelihood of observing no puffs during a 2 min recording would have been insignificant if all sites had uniform properties. No further increase in number of responding sites was observed when the flash duration was lengthened from 1200 to 1600 ms, suggesting that all functional puff sites were activated, and that SH-SY5Y cells possess a mean of only four puff sites per cell.
It thus appears that the neuroblastoma cells express a heterogeneous population of puff sites, with differing threshold concentrations of i-IP3 required to evoke puff activity. This variation in sensitivities was further reflected in differences among sites in maximal frequencies of puffs evoked by saturating [i-IP3]. Fig. 5 shows records from cells challenged by successive 400 msec UV flashes at 20 second intervals so as to evoke step-wise increments in cytosolic [i-IP3]. We grouped puff sites into those that did (n = 11) or did not (n = 15) show at least one puff in response to the first 400 msec UV flash. Those sites that responded (high sensitivity sites) consistently showed a higher maximal puff frequency (0.43 ± 0.06 Hz following five 400 msec UV flashes) than the low sensitivity sites (0.24 ± 0.02 Hz).
Figure 5. Heterogeneity among Ca2+ puff sites in threshold IP3 concentrations and maximal frequency.
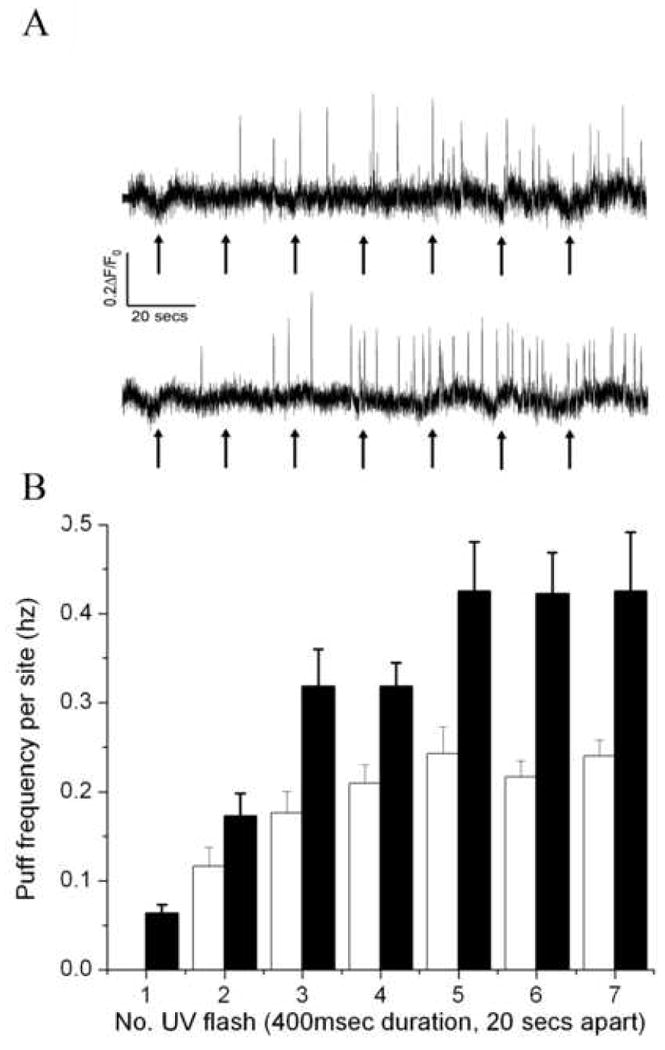
A, The traces show representative records from low- (top) and high-sensitivity (bottom) puff sites challenged with ‘step-wise’ increments in i-IP3 evoked by successive 400ms duration flashes when marked by the arrows. Only those sites that showed a puff during the 20s interval prior to the second flash were categorized as high-sensitivity sites. B, Observed mean puff frequencies per site following successive photolysis flashes. Data were obtained from experiments like those shown in (A), and are plotted after grouping into low- (open bars) and high-sensitivity sites based on whether they showed at least one puff following the initial flash.
In contrast to the marked changes in puff frequency, puff amplitudes were relatively insensitive to increasing photorelease of i-IP3 (Figs. 3A, 4C) and showed only small diminution with time after photorelease (Fig. 3C). The mean puff amplitude increased by only about one-third with increasing durations of photolysis flashes from 400 to 1600 ms (Fig. 4C), and puffs evoked by all flash durations showed similar skewed amplitude distributions with many small events and progressively fewer larger events (Fig. 4D).
Resting cytosolic [Ca2+] levels (as monitored by basal Fluo-4 fluorescence) showed little or no increase following photolysis flashes with durations up to 1200 ms and, with the exception of one cell, only a small rise following 1600 ms flashes (Fig. 3D). Thus, the buffering power of the EGTA loaded into the cytosol, together with native cellular sequestration mechanisms was largely sufficient to ‘clamp’ basal free [Ca2+]cyt close to its normal resting level even in the face of frequent puff activity. Modulation of IP3R function by basal [Ca2+]cyt is, therefore, unlikely to be responsible for the small time-dependent changes in puff frequency and amplitude seen following flashes of 1200 ms and shorter duration; but may contribute to the more marked decline in puff frequency following the 1600 ms flash.
Spatial localization of Ca2+ puff sites with respect to the nucleus
An earlier report indicated that perinuclear puff sites in HeLa cells were more sensitive to IP3 than those at more remote cytosolic sites [23]. To examine if this is also the case in SH-SY5Y cells, we first mapped the lateral (x-y) distribution of 78 puff sites by identifying all sites that responded to a strong (1600 ms) photolysis flash throughout a 30s recordings. Taking care not to move the cells, we then bath-applied a solution containing the DNA marker thiazole orange (10 μM for 5 mins, followed by washout), and on the computer screen overlaid puff site locations onto a monochrome image of resting fluo-4 fluorescence (to visualize the cell outline) together with thiazole orange fluorescence (outlining the nucleus) (Fig. 6A). Puff site locations were then quantified by expressing them as a relative distance between adjacent points on the plasma membrane and the nuclear envelope: For example, a distance of 0 indicates a site immediately adjacent to the nucleus, and a distance of 1 a site adjacent to the cell membrane. The resulting histogram of puff site locations (Fig. 6B) revealed a relatively uniform distribution of sites, yet with a subset (26%) close to the nucleus. For purposes of analysis we defined ‘perinuclear’ puff sites as those within 1 μm of the nucleus and compared them to ‘cytosolic sites’ that lay >3.5 μm away from the nucleus. In contrast to the marked differences between perincuclear and cytosolic puff sites reported in HELA cells, we found no significant differences in mean amplitude or frequency of puffs at cytosolic and perinuclear sites in SH-SY5Y cells (Figs. 6C,D)
Figure 6. Cellular distribution of puff sites in SH-SY5Y cells in relation to the nucleus.
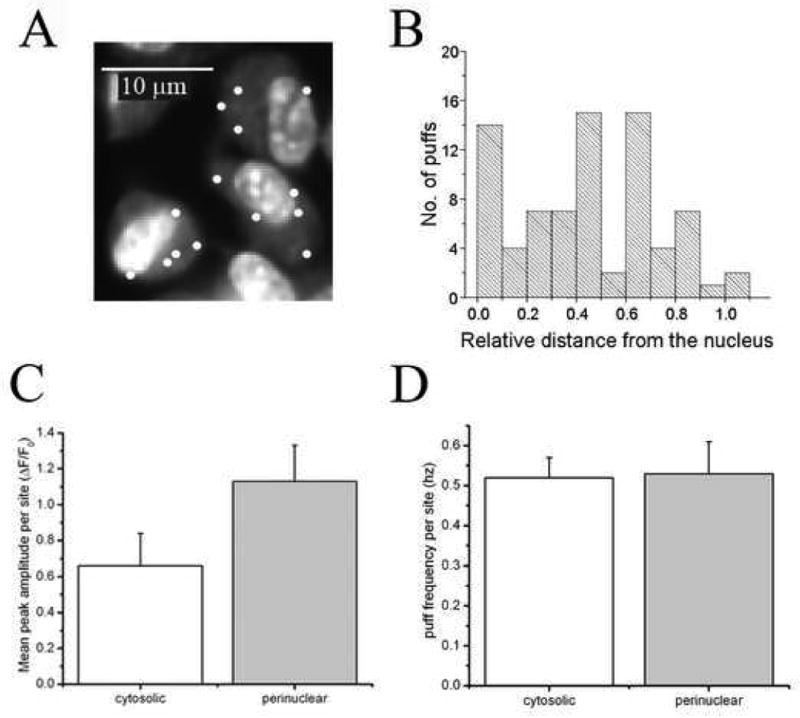
A, Representative image field showing locations of puff sites (white dots) overlaid on an image showing resting fluo-4 fluorescence to outline the boundaries of SHSY-5Y cells together with nuclear staining by thiazole orange. B, Distribution of puff sites in terms of their relative lateral position between the nucleus and cell membrane (n = 78 puff sites). C, D Comparisons of, respectively, mean puff amplitudes and frequencies of perinuclear sites (grey bars; sites lying within 1 μm of the nucleus; n = 11) and cytosolic sites (open bars; sites >3.5 μ m from the nucleus: n = 20).
Proximity of puff sites to the plasma membrane
The proximity of ER Ca2+ release sites to the plasma membrane is of crucial importance for local control of Ca2+-activated membrane ion channels [36, 37]. However, whereas the analysis in Fig. 6 provided information of puff site locations in relation to the nucleus, widefield fluorescence imaging at a fixed focal plane near the center of the cell fails to provide axial (z) information regarding proximity to the cell membrane. For example, a puff apparently located in the cytosol between the nucleus and edge of the cell might actually have originated close to the membrane at the bottom or top of the cell. To determine the axial localization of Ca2+ puffs we thus imaged puffs evoked by photoreleased i-IP3 while sequentially stepping the focus of the microscope in 1 μm increments upward from the coverglass to the top of a cell; typically ∼ 8 μm for SH-SY5Y cells. A puff site was deemed to lie in the focal plane where fluorescence changes were of maximal amplitude [38]. Figs. 7A,B illustrate, respectively, examples of puff sites that were located close to the cover glass (0 μm focus displacement) and 1-2 μm into the cell. Analysis of 19 puff sites revealed that a majority (11) were located within ∼ 1 μm of the cover glass, and hence in close proximity to the plasma membrane.
Figure 7. A majority of Ca2+ puff sites are closely apposed to the cell membrane in SH-SY5Y cells.
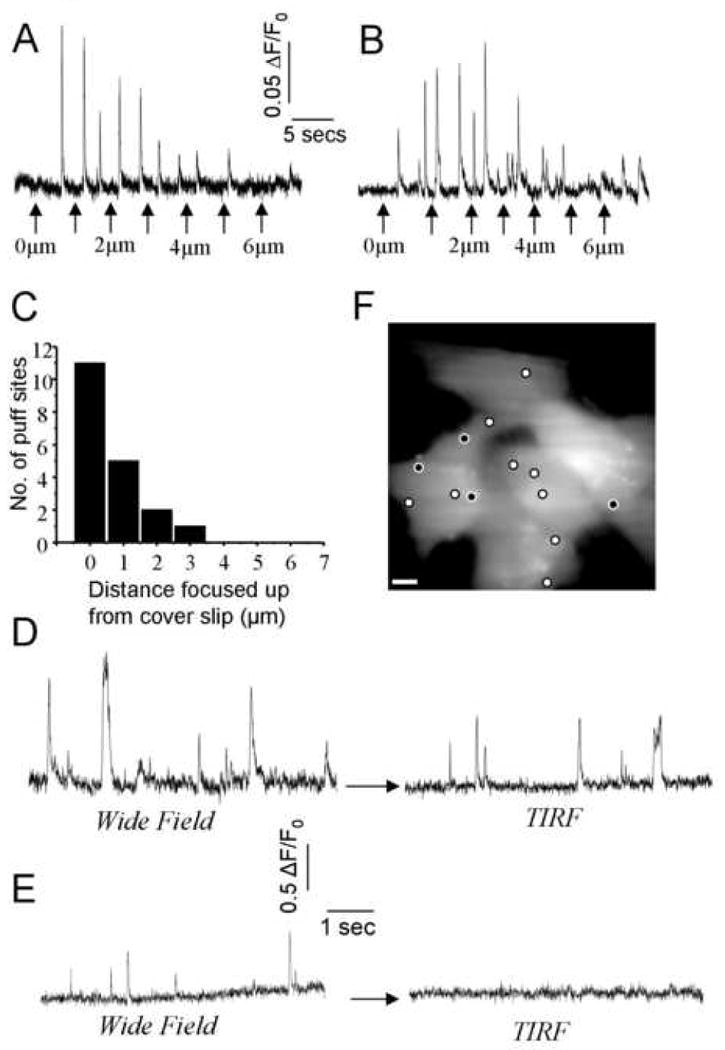
A, Fluorescence signals recorded from a fixed (in x-y) region of interest centered on a puff site as the microscope was focused in 1 um stepwise increments upward beginning from the cover glass and through the cell. A photolysis flash was delivered before the beginning of the record to evoke puffs. Arrows indicate focus changes. Fluorescence ratio changes were calculated by dividing by an averaged resting fluorescence image (Fo) captured while focused at the coverglass. In this example, the puff amplitude was maximal when focused near the cover glass, indicating that the puff site lay close to the plasma membrane. B, Fluorescence signals as in (A), but representative of a puff site that lay ∼3 μm from the membrane. C, Axial distribution of puff sites (n = 19 sites), as determined from experiments like those in A, B, by determining the focal plane where puffs were of maximal amplitude. D, TIRF imaging of puffs from a near-membrane site. The fluorescence traces were obtained from a fixed region of interest centered on a puff site, and show sustained activity evoked by a photolysis flash delivered before the beginning of the record. Traces were obtained with the microscope first in wide-field epifluorescence mode, and then after switching to TIRF excitation. Fluorescence ratio changes (ΔF/Fo) were calculated based on the differing Fo for each imaging modality. E, Fluorescence traces in wide-field and TIRF mode as in (D), but illustrating a ‘deep’ puff site where no Ca2+ signals were evident by TIRF imaging. F Locations of puff sites overlaid on an image of resting fluo-4 fluorescence of SH-SY5Y cells. White circles mark sites where puffs were observed using both wide-field and TIRFM as in (D), and black insets denote sites like that in (E) that did not give a signal when viewed by TIRFM.
Given the predominance of puff sites close to the plasma membrane, we then sought to more precisely determine the [Ca2+] changes experienced in the immediate vicinity of the membrane. For this purpose we employed total internal reflection (TIRF) microscopy, wherein fluorescence excitation is restricted within an exquisitely narrow evanescent field decaying with a distance constant of ∼100nm away from the coverglass [35, 39]. By changing the position of the laser beam entering the back aperture of the microscope TIRF objective lens we were able to first image puffs by widefield epi-fluorescence, and then rapidly switch to TIRF imaging to determine which of these puff sites gave near-membrane Ca2+ signals (Fig. 6D,E). Approximately 75% of sites evident by widefield imaging (n = 61) also gave a Ca2+ signals when viewed by TIRFM (e.g. Fig. 7E), whereas little or no TIRF signal was evident with the remaining sites (Fig. 7F).
Discussion
Tools for imaging local Ca2+ signaling in mammalian cells
Several reports describe local IP3/Ca2+ signaling in mammalian cells [2, 15, 19, 23, 24, 27, 34, 40], but quantitative studies have been hindered technical problems in controlling [IP3]i within the narrow range that evokes local puffs without triggering global Ca2+ waves and neither approaches using low concentrations of Ca2+-mobilizing agonists [27, 40] nor membrane-permeant IP3 [23] have proved entirely satisfactory. We had previously circumvented this problem by utilizing Xenopus oocytes, whose large size facilitates microinjection of caged IP3, thereby permitting precise control of [IP3]i by varying the intensity and duration of photolysis flashes [41]. Moreover, intracellular injection of the slow Ca2+ buffer EGTA served to balkanize Ca2+ signals into discrete puffs while inhibiting wave propagation, and to sharpen the spatio-temporal profile of puffs [10, 20]. Nevertheless, the oocyte suffers disadvantages, including its highly atypical size and geometry, and the location of puff sites a few μm below the membrane [42]. The latter factor has contributed to the general use of linescan confocal imaging so as to achieve good resolution of puffs, but with attendant disadvantages of uncertainty as to whether events are in-focus on the scan line [43], sparse sampling of puff sites, and restriction of spatial information to only a single dimension. We describe here advances that permit high-resolution Ca2+ imaging and precise control of [IP3]i in cultured mammalian cell lines, which may now usurp the oocyte as the favored system in which to study local IP3-mediated Ca2+ signaling. Results in this paper were obtained using SH-SY5Y human neuroblastoma cells, and we have also obtained similar findings in HeLa cells (unpublished data).
We employed 2 methodological approaches. The first was contingent on the commercial availability of membrane-permeant ester forms of caged IP3 and EGTA. This allowed us to non-invasively load numerous small mammalian cells for simultaneous imaging; a major advantage over patch pipette delivery of these compounds where only one cell at a time can be loaded and subsequently imaged. Although ester-loading precludes accurate determination of absolute intracellular concentrations of ci-IP3 and EGTA (as opposed to the patch pipette method where precise concentrations can be delivered) it is nevertheless possible to control relative IP3i concentrations with high precision. Secondly, use of a fast (500 fps), highly sensitive camera enabled good temporal resolution in two (x-y) dimensions, thereby sampling from many more puff sites and minimizing uncertainties arising from events distant from a confocal scan line. Owing to the thin (ca. 6 μm) and transparent nature of the SH-SY5Y cells we were able to obtain good results even with widefield fluorescence imaging. Moreover, because the kinetic resolution of local Ca2+ events improves markedly as the volume from which fluorescence signals are monitored diminishes [44], the finding that many puff sites are located sufficiently close to the plasma membrane as to be within range of the exceedingly thin optical section provided by TIRF microscopy offers potential for unprecedented spatio-temporal resolution.
Comparison of Ca2+ signals in SH-SY-5Y cells and Xenopus oocytes
In light of the substantial body of published work employing Xenopus oocytes to study Ca2+ puffs, it is instructive to compare their properties in these two very different cell types. Our overall conclusion is that local Ca2+ signaling mechanisms appear remarkably conserved. The time course of Ca2+ puffs in oocytes and SH-SY5Y cells under physiological conditions (i.e. no added EGTA) is similar (300 ms in SH-SY5Y vs. 260 ms in Xenopus oocyte ) as is their spatial spread (FWHM in SH-SY5Y of 3.5 μm v 3.4 μm in the oocyte); and the lower fluorescence amplitude in SH-SY5Y cells (0.4 ΔF/F0 in SH-SY5Y vs. 2.5 ΔF/F0 in Xenopus oocyte) may largely be attributable to use of wide-field rather than confocal imaging [10]. Moreover, despite the enormous difference in total numbers of puff sites between the cells (thousands in the oocyte; about 4 in SH-SY5Y cells) the spacing between sites is comparable (3.5 μm in SH-SY5Y vs. 2.25 μm in the oocyte), and in terms of Ca2+ signaling architecture the oocyte may be thought of as a mammalian cell writ large. Following our original identification of Ca2+ puffs in Xenopus oocytes [21] we had suggested that “there may be room for no more than one release unit in a cell of ‘normal’ size”. Although recent findings [34] that neutrophils may express only a single puff site bear this out, the SH-SY5Y cells exemplify the more usual situation seen across many mammalian cell types [15, 27] that typically contain a few or several puff sites. This architecture probably reflects a requirement to space Ca2+ release sites at distances comparable to the diffusional range of action of Ca2+ ions in the cytosol [45] so that cells can retain control of the explosively regenerative CICR mechanism to appropriately generate local or global signals.
The similarity between puff characteristics in the oocyte and SH-SY5Y cells is concordant with the expression patterns of intracellular ER Ca2+ release channels in these cells. Both the oocyte and SH-SY5Y cells predominantly express the type 1 IP3R [17, 46], and SH-SY5Y cells may also express low levels of the type 3 IP3R [27, 46]. Xenopus oocytes do not express RyR [17], and RyR also appear to be generally absent in undifferentiated SH-SY5Y cells, although one report describes a small (<6%) subset of SH-SY5Y cells expressing RyR's [47]. However, these RyR were functionally evident only after loading the E.R. by K+ depolarization and, together with our failure to observe any Ca2+ signals in response to bath application of caffeine (5-25 mM: data not shown), we conclude that IP3-evoked Ca2+ signals are in SH-SY5Y cells are largely uncontaminated by CICR through RyR [30].
A marked difference between oocytes and SH-SY5Y cells, however, is that whereas flash photorelease of IP3 in Xenopus oocytes usually evokes only one or two puffs at any given site [25], puffs in SH-SY5Y cells continued to occur with only slightly diminishing frequency for at least a few minutes following a flash. The difference likely lies both in the contrasting size and geometry of the two cell types, and in differences between the caged compounds used. Firstly, penetration of UV light into the oocyte is severely restricted by pigment and yolk granules [48]. IP3 is thus photoreleased only in a thin, superficial shell close to the cell membrane, and its concentration at the superficial Ca2+ release sites where puffs are observed [42]will fall rapidly as IP3 diffuses into the enormous interior volume of the oocyte. In contrast, i-IP3 is photoreleased almost uniformly throughout the entire volume of the much smaller SH-SY5Y cells, so that metabolic degradation would be the only mechanism causing a fall in [IP3]. Secondly, our oocyte experiments employed NPE-caged IP3 where photolysis results in the formation of the naturally-occurring form of IP3, whereas the ci-IP3 used here has the photolabile group on the 6-hydroxy position with the remaining 2- and 3-hydroxies protected by isopropylidine groups. The i-IP3 that results from photolysis has been reported to be metabolized in SH-SY5Y cells more slowly than IP3 itself [49], so that our observation of sustained puff activity may not truly reflect the normal turnover rate of IP3 in these cells. Nevertheless, given that the period of whole-cell Ca2+ oscillations can be as short as 10-20 s, and that they are readily evoked by photoreleased IP3 as well as by Ca2+-mobilizing agonists (Fig. 1A,C), this suggests that Ca2+ oscillations in SH-SY5Y cells are not driven by oscillating levels of IP3 as proposed in other cells [50], but rather involve feedback mechanisms acting directly on the IP3R with [IP3] remaining constant [51]. Irrespective of mechanism, the ability to record numerous puffs in a short time and at relatively constant [IP3] in SH-SY5Y cells offers a major advantage over oocytes in greatly enhancing experimental throughput, and facilitating statistical comparisons between puffs arising at the same and at different sites.
Properties of Ca2+ puffs in SH-SY5Y cells
Our results present the first quantitative study of Ca2+ puffs in mammalian cells as a function of [IP3]. The main findings, which mirror those in Xenopus oocytes [52], are that puff frequency varies steeply with [IP3], whereas the mean puff amplitude is substantially independent. The increasing frequency may be explained if greater numbers of IP3R-channels in a cluster bind IP3, thereby increasing the probability that one of them will open following stochastic binding of Ca2+ at basal resting [Ca2+]i to generate a trigger Ca2+ signal and evoke a puff at that site [53]. On the other hand, the mechanisms that determine puff amplitude remain unclear. At any given [IP3] puff amplitudes at any given site show a wide variability, presumably reflecting recruitment of varying numbers of IP3R [25, 40]. However, neither the distributions of amplitudes (Fig. 4D) nor their mean values change appreciably with [IP3], indicating that the puff amplitude is not a simple function of the number of IP3Rs at a cluster that are binding IP3 and hence are in a state where they can be activated by a local increase in [Ca2+].
We further show that there are at least two different types of puff sites in SH-SY5Y cells; highly sensitive sites that respond at low [IP3] and have a high maximal puff frequency at high [IP3], and low sensitivity sites that respond only at greater threshold concentrations of IP3 and show a lower maximal puff frequency. Significant differences in IP3 sensitivity among puff sites have previously been described in both HELA cells and Xenopus oocytes [15, 16], with low-threshold sites proposed to act as pacemakers to initiate global Ca2+ waves. In HeLa cells pacemaker puff sites were reported to be concentrated around the nucleus [23, 54], possibly subserving a specific role in nuclear Ca2+ signaling. However, different to those results in HeLa cells and a report of similar findings in SH-SY5Y cells [27] our functional puff mapping data reveal a broad distribution of puff sites throughout the cell, with little apparent concentration near the nucleus; and we further failed to observe any obvious difference in properties of pericunclear puffs.
The positioning Ca2+ puffs sites is a major factor in determining which signaling elements are exposed to localized Ca2+ elevations during elementary events. We show that a majority (76%) of Ca2+ release sites in SH-SY5Y cells are located sufficiently close to the plasma membrane to evoke large Ca2+ signals when observed using TIRF microscopy, which reports exclusively near-membrane (∼100 nm) fluorescence signals. The immediate proximity of IP3Rs to the plasma membrane likely allows puffs to play a significant role in local modulation of plasmalemmal processes such as neurotransmitter release and activation of Ca2+-dependent K+ channels [36]. Moreover, the finding that puffs sites are within range of the evanescent field of TIRF microscopy holds great promise for extending our ‘optical patch-clamp’ approach of single-channel Ca2+ imaging [35] to resolve intracellular Ca2+ liberation at the single-molecule level of individual IP3R.
Acknowledgments
This work was supported by grant GM 48071 from the National Institutes of Health, and by an NIH training fellowship (T32 NS07444) to S.M.W.
Footnotes
Publisher's Disclaimer: This is a PDF file of an unedited manuscript that has been accepted for publication. As a service to our customers we are providing this early version of the manuscript. The manuscript will undergo copyediting, typesetting, and review of the resulting proof before it is published in its final citable form. Please note that during the production process errors may be discovered which could affect the content, and all legal disclaimers that apply to the journal pertain.
References
- 1.Berridge MJ. Elementary and global aspects of Ca2+ signalling. J Physiol. 1997;499(Pt 2):291–306. doi: 10.1113/jphysiol.1997.sp021927. [DOI] [PMC free article] [PubMed] [Google Scholar]
- 2.Bootman M, Niggli E, Berridge M, Lipp P. Imaging the hierarchical Ca2+ signalling system in HeLa cells. J Physiol. 1997;499(Pt 2):307–14. doi: 10.1113/jphysiol.1997.sp021928. [DOI] [PMC free article] [PubMed] [Google Scholar]
- 3.Parker I, Yao Y. Ca2+ transients associated with openings of inositol trisphosphate-gated channels in Xenopus oocytes. J Physiol. 1996;491(Pt 3):663–8. doi: 10.1113/jphysiol.1996.sp021247. [DOI] [PMC free article] [PubMed] [Google Scholar]
- 4.Bezprozvanny I, Watras J, Ehrlich BE. Bell-shaped calcium-response curves of IP3- and Ca2+-gated channels from endoplasmic reticulum of cerebellum. Nature. 1991;351:751–4. doi: 10.1038/351751a0. [DOI] [PubMed] [Google Scholar]
- 5.Foskett JK, White C, Cheung KH, Mak DO. Inositol trisphosphate receptor Ca2+ release channels. Physiol Rev. 2007;87:593–658. doi: 10.1152/physrev.00035.2006. [DOI] [PMC free article] [PubMed] [Google Scholar]
- 6.Yao Y, Choi J, Parker I. Quantal puffs of intracellular Ca2+ evoked by inositol trisphosphate in Xenopus oocytes. J Physiol. 1995;482(Pt 3):533–53. doi: 10.1113/jphysiol.1995.sp020538. [DOI] [PMC free article] [PubMed] [Google Scholar]
- 7.Lipp P, Niggli E. A hierarchical concept of cellular and subcellular Ca2+-signalling. Prog Biophys Mol Biol. 1996;65:265–96. doi: 10.1016/s0079-6107(96)00014-4. [DOI] [PubMed] [Google Scholar]
- 8.Parker I, Choi J, Yao Y. Elementary events of IP3-induced Ca2+ liberation in Xenopus oocytes: hot spots, puffs and blips. Cell Calcium. 1996;20:105–21. doi: 10.1016/s0143-4160(96)90100-1. [DOI] [PubMed] [Google Scholar]
- 9.Busa WB, Ferguson JE, Joseph SK, Williamson JR, Nuccitelli R. Activation of frog (Xenopus laevis) eggs by inositol trisphosphate. I. Characterization of Ca2+ release from intracellular stores. J Cell Biol. 1985;101:677–82. doi: 10.1083/jcb.101.2.677. [DOI] [PMC free article] [PubMed] [Google Scholar]
- 10.Dargan SL, Parker I. Buffer kinetics shape the spatiotemporal patterns of IP3-evoked Ca2+ signals. J Physiol. 2003;553:775–88. doi: 10.1113/jphysiol.2003.054247. [DOI] [PMC free article] [PubMed] [Google Scholar]
- 11.Dargan SL, Schwaller B, Parker I. Spatiotemporal patterning of IP3-mediated Ca2+ signals in Xenopus oocytes by Ca2+-binding proteins. J Physiol. 2004;556:447–61. doi: 10.1113/jphysiol.2003.059204. [DOI] [PMC free article] [PubMed] [Google Scholar]
- 12.DeLisle S, Welsh MJ. Inositol trisphosphate is required for the propagation of Ca2+ waves in Xenopus oocytes. J Biol Chem. 1992;267:7963–6. [PubMed] [Google Scholar]
- 13.Lechleiter JD, Clapham DE. Molecular mechanisms of intracellular Ca2+ excitability in X. laevis oocytes. Cell. 1992;69:283–94. doi: 10.1016/0092-8674(92)90409-6. [DOI] [PubMed] [Google Scholar]
- 14.Parker I, Miledi R. Changes in intracellular Ca2+ and in membrane currents evoked by injection of inositol trisphosphate into Xenopus oocytes. Proc R Soc Lond B Biol Sci. 1986;228:307–15. doi: 10.1098/rspb.1986.0057. [DOI] [PubMed] [Google Scholar]
- 15.Bootman MD, Berridge MJ, Lipp P. Cooking with Ca2+: the recipes for composing global signals from elementary events. Cell. 1997;91:367–73. doi: 10.1016/s0092-8674(00)80420-1. [DOI] [PubMed] [Google Scholar]
- 16.Marchant JS, Parker I. Role of elementary Ca2+ puffs in generating repetitive Ca2+ oscillations. Embo J. 2001;20:65–76. doi: 10.1093/emboj/20.1.65. [DOI] [PMC free article] [PubMed] [Google Scholar]
- 17.Parys JB, Sernett SW, DeLisle S, Snyder PM, Welsh MJ, Campbell KP. Isolation, characterization, and localization of the inositol 1,4,5-trisphosphate receptor protein in Xenopus laevis oocytes. J Biol Chem. 1992;267:18776–82. [PubMed] [Google Scholar]
- 18.Callamaras N, Parker I. Caged inositol 1,4,5-trisphosphate for studying release of Ca2+ from intracellular stores. Methods Enzymol. 1998;291:380–403. doi: 10.1016/s0076-6879(98)91024-2. [DOI] [PubMed] [Google Scholar]
- 19.Fogarty KE, Kidd JF, Tuft DA, Thorn P. Mechanisms underlying IP3-evoked global Ca2+ signals in mouse pancreatic acinar cells. J Physiol. 2000;526(Pt 3):515–26. doi: 10.1111/j.1469-7793.2000.t01-1-00515.x. [DOI] [PMC free article] [PubMed] [Google Scholar]
- 20.Callamaras N, Parker I. Phasic characteristic of elementary Ca2+ release sites underlies quantal responses to IP3. Embo J. 2000;19:3608–17. doi: 10.1093/emboj/19.14.3608. [DOI] [PMC free article] [PubMed] [Google Scholar]
- 21.Parker I, Yao Y. Regenerative release of Ca2+ from functionally discrete subcellular stores by inositol trisphosphate. Proc Biol Sci. 1991;246:269–74. doi: 10.1098/rspb.1991.0154. [DOI] [PubMed] [Google Scholar]
- 22.Yao Y, Parker I. Ca2+ influx modulation of temporal and spatial patterns of inositol trisphosphate-mediated Ca2+ liberation in Xenopus oocytes. J Physiol. 1994;476:17–28. [PMC free article] [PubMed] [Google Scholar]
- 23.Thomas D, Lipp P, Tovey SC, Berridge MJ, Li W, Tsien RY, Bootman MD. Microscopic properties of elementary Ca2+ release sites in non-excitable cells. Curr Biol. 2000;10:8–15. doi: 10.1016/s0960-9822(99)00258-4. [DOI] [PubMed] [Google Scholar]
- 24.Thorn P, Lawrie AM, Smith PM, Gallacher DV, Petersen OH. Local and global cytosolic Ca2+ oscillations in exocrine cells evoked by agonists and inositol trisphosphate. Cell. 1993;74:661–8. doi: 10.1016/0092-8674(93)90513-p. [DOI] [PubMed] [Google Scholar]
- 25.Callamaras N, Marchant JS, Sun XP, Parker I. Activation and coordination of IP3-mediated elementary Ca2+ events during global Ca2+ signals in Xenopus oocytes. J Physiol. 1998;509(Pt 1):81–91. doi: 10.1111/j.1469-7793.1998.081bo.x. [DOI] [PMC free article] [PubMed] [Google Scholar]
- 26.Koizumi S, Bootman MD, Bobanovic LK, Schell MJ, Berridge MJ, Lipp P. Characterization of elementary Ca2+ release signals in NGF-differentiated PC12 cells and hippocampal neurons. Neuron. 1999;22:125–37. doi: 10.1016/s0896-6273(00)80684-4. [DOI] [PubMed] [Google Scholar]
- 27.Tovey SC, de Smet P, Lipp P, Thomas D, Young KW, Missiaen L, De Smedt H, Parys JB, Berridge MJ, Thuring J, Holmes A, Bootman MD. Ca2+ puffs are generic IP3-activated elementary Ca2+ signals and are downregulated by prolonged hormonal stimulation to inhibit cellular Ca2+ responses. J Cell Sci. 2001;114:3979–89. doi: 10.1242/jcs.114.22.3979. [DOI] [PubMed] [Google Scholar]
- 28.Stutzmann GE, Caccamo A, LaFerla FM, Parker I. Dysregulated IP3 signaling in cortical neurons of knock-in mice expressing an Alzheimer's-linked mutation in presenilin1 results in exaggerated Ca2+ signals and altered membrane excitability. J Neurosci. 2004;24:508–13. doi: 10.1523/JNEUROSCI.4386-03.2004. [DOI] [PMC free article] [PubMed] [Google Scholar]
- 29.Stutzmann GE, LaFerla FM, Parker I. Ca2+ signaling in mouse cortical neurons studied by two-photon imaging and photoreleased inositol triphosphate. J Neurosci. 2003;23:758–65. doi: 10.1523/JNEUROSCI.23-03-00758.2003. [DOI] [PMC free article] [PubMed] [Google Scholar]
- 30.Stutzmann GE, Smith I, Caccamo A, Oddo S, Laferla FM, Parker I. Enhanced ryanodine receptor recruitment contributes to Ca2+ disruptions in young, adult, and aged Alzheimer's disease mice. J Neurosci. 2006;26:5180–9. doi: 10.1523/JNEUROSCI.0739-06.2006. [DOI] [PMC free article] [PubMed] [Google Scholar]
- 31.Li W, Llopis J, Whitney M, Zlokarnik G, Tsien RY. Cell-permeant caged InsP3 ester shows that Ca2+ spike frequency can optimize gene expression. Nature. 1998;392:936–41. doi: 10.1038/31965. [DOI] [PubMed] [Google Scholar]
- 32.Samways DS, Li WH, Conway SJ, Holmes AB, Bootman MD, Henderson G. Co-incident signalling between mu-opioid and M3 muscarinic receptors at the level of Ca2+ release from intracellular stores: lack of evidence for IP3 receptor sensitization. Biochem J. 2003;375:713–20. doi: 10.1042/BJ20030508. [DOI] [PMC free article] [PubMed] [Google Scholar]
- 33.Wagner LE, 2nd, Li WH, Yule DI. Phosphorylation of type-1 inositol 1,4,5-trisphosphate receptors by cyclic nucleotide-dependent protein kinases: a mutational analysis of the functionally important sites in the S2+ and S2- splice variants. J Biol Chem. 2003;278:45811–7. doi: 10.1074/jbc.M306270200. [DOI] [PubMed] [Google Scholar]
- 34.Hillson EJ, Hallett MB. Localised and rapid Ca2+ micro-events in human neutrophils: conventional Ca2+ puffs and global waves without peripheral-restriction or wave cycling. Cell Calcium. 2007;41:525–36. doi: 10.1016/j.ceca.2006.10.010. [DOI] [PubMed] [Google Scholar]
- 35.Demuro A, Parker I. “Optical patch-clamping”: single-channel recording by imaging Ca2+ flux through individual muscle acetylcholine receptor channels. J Gen Physiol. 2005;126:179–92. doi: 10.1085/jgp.200509331. [DOI] [PMC free article] [PubMed] [Google Scholar]
- 36.Hoesch RE, Weinreich D, Kao JP. Localized IP3-evoked Ca2+ release activates a K+ current in primary vagal sensory neurons. J Neurophysiol. 2004;91:2344–52. doi: 10.1152/jn.01008.2003. [DOI] [PubMed] [Google Scholar]
- 37.Marchant JS, Parker I. Functional interactions in Ca2+ signaling over different time and distance scales. J Gen Physiol. 2000;116:691–6. doi: 10.1085/jgp.116.5.691. [DOI] [PMC free article] [PubMed] [Google Scholar]
- 38.Demuro A, Parker I. Multi-dimensional resolution of elementary Ca2+ signals by simultaneous multi-focal imaging. Cell Calcium. 2007 doi: 10.1016/j.ceca.2007.07.002. [DOI] [PMC free article] [PubMed] [Google Scholar]
- 39.Parker I. Photonics for biologists. Methods Enzymol. 2003;360:345–82. doi: 10.1016/s0076-6879(03)60119-9. [DOI] [PubMed] [Google Scholar]
- 40.Thomas D, Lipp P, Berridge MJ, Bootman MD. Hormone-evoked elementary Ca2+ signals are not stereotypic, but reflect activation of different size channel clusters and variable recruitment of channels within a cluster. J Biol Chem. 1998;273:27130–6. doi: 10.1074/jbc.273.42.27130. [DOI] [PubMed] [Google Scholar]
- 41.Dargan SL, Demuro A, Parker I. Imaging Ca2+ signals in Xenopus oocytes. Methods Mol Biol. 2006;322:103–19. doi: 10.1007/978-1-59745-000-3_8. [DOI] [PubMed] [Google Scholar]
- 42.Callamaras N, Parker I. Radial localization of inositol 1,4,5-trisphosphate-sensitive Ca2+ release sites in Xenopus oocytes resolved by axial confocal linescan imaging. J Gen Physiol. 1999;113:199–213. doi: 10.1085/jgp.113.2.199. [DOI] [PMC free article] [PubMed] [Google Scholar]
- 43.Izu LT, Wier WG, Balke CW. Theoretical analysis of the Ca2+ spark amplitude distribution. Biophys J. 1998;75:1144–62. doi: 10.1016/s0006-3495(98)74034-2. [DOI] [PMC free article] [PubMed] [Google Scholar]
- 44.Shuai J, Parker I. Optical single-channel recording by imaging Ca2+ flux through individual ion channels: theoretical considerations and limits to resolution. Cell Calcium. 2005;37:283–99. doi: 10.1016/j.ceca.2004.10.008. [DOI] [PubMed] [Google Scholar]
- 45.Allbritton NL, Meyer T, Stryer L. Range of messenger action of Ca2+ and inositol 1,4,5-trisphosphate. Science. 1992;258:1812–5. doi: 10.1126/science.1465619. [DOI] [PubMed] [Google Scholar]
- 46.Van Acker K, Nadif Kasri N, De Smet P, Parys JB, De Smedt H, Missiaen L, Callewaert G. IP3-mediated Ca2+ signals in human neuroblastoma SH-SY5Y cells with exogenous overexpression of type 3 IP(3) receptor. Cell Calcium. 2002;32:71–81. doi: 10.1016/s0143-4160(02)00092-1. [DOI] [PubMed] [Google Scholar]
- 47.Riddoch FC, Rowbotham SE, Brown AM, Redfern CP, Cheek TR. Release and sequestration of Ca2+ by a caffeine- and ryanodine-sensitive store in a sub-population of human SH-SY5Y neuroblastoma cells. Cell Calcium. 2005;38:111–20. doi: 10.1016/j.ceca.2005.06.001. [DOI] [PubMed] [Google Scholar]
- 48.Parker I, Ivorra I. Confocal microfluorimetry of Ca2+ signals evoked in Xenopus oocytes by photoreleased inositol trisphosphate. J Physiol. 1993;461:133–65. doi: 10.1113/jphysiol.1993.sp019506. [DOI] [PMC free article] [PubMed] [Google Scholar]
- 49.Dakin K, Li WH. Cell membrane permeable esters of D-myo-inositol 1,4,5-trisphosphate. Cell Calcium. 2007;42:291–301. doi: 10.1016/j.ceca.2006.12.003. [DOI] [PubMed] [Google Scholar]
- 50.Hirose K, Kadowaki S, Tanabe M, Takeshima H, Iino M. Spatiotemporal dynamics of IP3 that underlies complex Ca2+ mobilization patterns. Science. 1999;284:1527–30. doi: 10.1126/science.284.5419.1527. [DOI] [PubMed] [Google Scholar]
- 51.Matsu-ura T, Michikawa T, Inoue T, Miyawaki A, Yoshida M, Mikoshiba K. Cytosolic inositol 1,4,5-trisphosphate dynamics during intracellular calcium oscillations in living cells. J Cell Biol. 2006;173:755–65. doi: 10.1083/jcb.200512141. [DOI] [PMC free article] [PubMed] [Google Scholar]
- 52.Rose HJ, Dargan S, Shuai J, Parker I. ‘Trigger’ events precede calcium puffs in Xenopus oocytes. Biophys J. 2006;91:4024–32. doi: 10.1529/biophysj.106.088872. [DOI] [PMC free article] [PubMed] [Google Scholar]
- 53.Shuai J, Pearson JE, Foskett JK, Mak DO, Parker I. A kinetic model of single and clustered IP3 receptors in the absence of Ca2+ feedback. Biophys J. 2007;93:1151–62. doi: 10.1529/biophysj.107.108795. [DOI] [PMC free article] [PubMed] [Google Scholar]
- 54.Lipp P, Thomas D, Berridge MJ, Bootman MD. Nuclear calcium signalling by individual cytoplasmic calcium puffs. Embo J. 1997;16:7166–73. doi: 10.1093/emboj/16.23.7166. [DOI] [PMC free article] [PubMed] [Google Scholar]