

Abstract
Altered expression and mutations in α-synuclein (α-syn) have been linked to Parkinson's disease (PD) and related disorders. The neurological alterations in PD patients have been associated with degeneration of dopaminergic cells and other neuronal populations. Moreover, recent studies in murine models have shown that alterations in neurogenesis might also contribute to the neurodegenerative phenotype. However, the mechanisms involved and the effects of α-syn expression on neurogenesis are not yet clear. To this end, murine embryonic stem (mES) cells were infected with lentiviral (LV) vectors expressing wild-type (WT) and mutant α-syn. Compared with mES cells infected with LV–green fluorescent protein (GFP), cells expressing WT and mutant α-syn showed reduced proliferation as indicated by lower 5-bromo-2′-deoxyuridine uptake, increased apoptosis, and reduced expression of neuronal markers such as neuron specific enolase and β-III tubulin. The alterations in neurogenesis in α-syn-expressing mES cells were accompanied by a reduction in Notch-1 and Hairy and enhancer of split-5 (Hes-5) mRNA and protein levels. Moreover, levels of total Notch-1 and Notch intracellular domain (NICD) were lower in mES cells expressing WT and mutant α-syn compared with GFP controls. The reduced survival of α-syn-expressing mES cells was reverted by overexpressing constitutively active NICD. Similarly, in α-syn transgenic mice, the alterations in neurogenesis in the hippocampal subgranular zone were accompanied by decreased Notch-1, NICD, and Hes-5 expression. Together, these results suggest that accumulation of α-syn might impair survival of NPCs by interfering with the Notch signaling pathway. Similar mechanisms could be at play in PD and Lewy body disease.
Keywords: α-synuclein, Parkinson's disease, neurogenesis, differentiation, stem cells, dentate gyrus
Introduction
Progressive accumulation of misfolded α-synuclein (α-syn) in cortical and subcortical brain regions has been proposed to play a central role in the pathogenesis of Parkinson's disease (PD) and Lewy body disease (LBD) (Trojanowski and Lee, 1998). Supporting a role for the presynaptic protein α-syn in the pathogenesis of this heterogeneous group of movement disorders with dementia (Iwai et al., 1994), previous studies have shown that (1) this molecule accumulates in Lewy bodies (Spillantini et al., 1997; Wakabayashi et al., 1997; Takeda et al., 1998), (2) mutations and multiplication in the α-syn gene are associated with rare familial forms of parkinsonism (Polymeropoulos et al., 1997; Kruger et al., 1998; Singleton et al., 2003), and (3) its expression in transgenic (tg) mice (Masliah et al., 2000; Lee et al., 2002, 2004) and Drosophila (Feany and Bender, 2000) mimics several aspects of PD.
The mechanisms through which α-syn aggregates might lead to neurodegeneration are not entirely clear. Recent evidence indicates that abnormal accumulation of misfolded α-syn in the synaptic terminals and axons plays an important role (Iwatsubo et al., 1996; Trojanowski et al., 1998; Hashimoto and Masliah, 1999; Lansbury, 1999; Hashimoto et al., 2004; Kramer and Schulz-Schaeffer, 2007). Neurodegeneration in these disorders affects primarily the striatonigral system, but, in cases with cognitive impairment, there is more widespread degeneration including neuronal populations in the striatum, hippocampus, and neocortex (Harding et al., 2002; McKeith et al., 2004). Moreover, recent evidence suggests that accumulation of α-syn in the limbic system might contribute to the neurodegenerative phenotype by interfering with adult neurogenesis (Winner et al., 2004, 2007).
Neurogenesis in the mature CNS occurs in the olfactory bulb, the hippocampus, and the subventricular zone (Gage et al., 1998). In the hippocampus, neural precursor cells (NPCs) in the subgranular zone (SGZ) contribute to the maturation of neuronal populations in the dentate gyrus (DG) in which they might play a role in learning and memory (Gage et al., 1998; van Praag et al., 1999, 2002; Brown et al., 2003).
We have shown previously that accumulation of wild-type (WT) and mutant (mut) α-syn in the CNS of tg mice results in reduced neurogenesis in the olfactory bulb and hippocampus (Winner et al., 2004, 2007). Moreover, recent studies have shown that overexpression of α-syn in human and mouse embryonic stem (mES) cells results in defective neurogenesis and cell death and might recapitulate some aspects of the neurodegenerative process in PD (Yamashita et al., 2006; Schneider et al., 2007). However, the mechanisms through which accumulation of α-syn might lead to reduced neurogenesis are not completely clear. For this purpose, we investigated the effects of abnormal α-syn accumulation in pathways involved in neurogenesis in mES cells that were infected with lentivirus (LV) expressing α-syn and in the DG of α-syn tg mice. Our studies suggest that α-syn accumulation contributes to alterations in neurogenesis by reducing the survival of NPCs via downregulation of Notch-1 expression.
Materials and Methods
ES cell culture.
The D3 mES cell line (purchased from American Type Culture Collection, Manassas, VA) was cultured on tissue culture plates coated with 0.1% (v/v) porcine gelatin (Sigma, St. Louis, MO). Cells were cultured in ES medium, consisting of knock-out DMEM (Invitrogen, Carlsbad, CA), 15% knock-out serum replacement (Invitrogen), 55 μm mercaptoethanol, 1 mm sodium pyruvate, 2 mm glutamine, 0.1 mm nonessential amino acids, and 1000 U/ml murine leukemic inhibitory factor (LIF) (Millipore Bioscience Research Reagents, Temecula, CA), in 5% CO2, 95% air at 37°C. Cells were trypsinized and replated or replaced with fresh ES medium every other day.
Neuronal differentiation of mES cells.
Neuronal differentiation of ES cells was based on a modification of previous published methods (Bibel et al., 2004). Briefly, for embryoid body formation, 3 × 10⁶ mES cells were plated onto nonadherent Petri dishes in EB medium (ES medium without LIF and only 10% serum replacement) and incubated for 8 d. Medium was changed every 2 d, and 5 μm retinoic acid (Sigma) was added after 4 d. Embryoid bodies were then dissociated with 0.05% trypsin in 0.04% EDTA/PBS (Invitrogen), and the cells were plated on l-ornithine and laminin-coated plates in Neurobasal medium (Invitrogen) in the presence of 1 mm l-glutamine and N2 supplement (Invitrogen) (N2 medium). The following day, the N2 medium was changed, and after 2 d, the medium was replaced by Neurobasal medium in the presence of 1 mm l-glutamine and B27 supplement (Invitrogen) (B27 medium).
Immunoblotting of differentiating mES cells.
After washing with PBS, mES cells were harvested and disrupted in cell lysis buffer (20 mm Tris, pH 7.5, 150 mm NaCl, 1% Nonidet P-40, 1 mm EDTA, 50 mm NaF, 1 mm Na3VO4, and 1% Triton X-100) supplemented with protease inhibitor cocktail (Calbiochem, San Diego, CA). The lysed samples were transferred to microcentrifuge tubes, incubated on ice for 20 min, and then cleared by centrifugation (13,000 × g, 15 min) at 4°C. Lysate protein concentration was measured by the DC protein assay kit (Bio-Rad, Hercules, CA). For electrophoretic analysis, 3× SDS sample buffer was added to cell lysates. The samples were loaded on SDS-PAGE subsequently transferred onto polyvinylidene fluoride membranes (Millipore, Bedford, MA). After blocking, the membranes were incubated with gentle agitation overnight at 4°C with the specific primary antibodies against β-III tubulin (β-tubulin, Tuj1-like TU-20 clone, 1:1000; Millipore Bioscience Research Reagents), neuron specific enolase (NSE) (1:1000; Abcam, Cambridge, MA), α-syn (1:1000; BD Biosciences Transduction Laboratories, San Jose, CA), full-length (FL) or cleaved Notch-1 (1:1000; Cell Signaling Technology, Danvers, MA), Notch intracellular domain (NICD) (1:1000, Cell Signaling Technology), hemagglutinin (HA) (1:1000; Roche Diagnostics, Indianapolis, IN), Notch-4 (1:500; Santa Cruz Biotechnology, Santa Cruz, CA), Hairy and enhancer of split 1 (Hes-1; 1:1000; Millipore Bioscience Research Reagents), Hes-5 (1:1000; Millipore Bioscience Research Reagents), or β-actin (1:1000; Millipore Bioscience Research Reagents). The cleaved Notch-1 antibody (rabbit polyclonal antibody 2421 from Cell Signaling Technology) has been characterized previously and recognizes the cleavage site of Notch-1, between Gly 1743 and Val 1744, that is generated by presenilin/γ-secretase. To confirm the specificity of this antibody, previous studies have performed immunoblotting analysis using NIH3T3 cells that were transfected with Notch-1 expression vectors (Tokunaga et al., 2004). We performed similar experiments infecting mES cells with an adenoviral vector expressing NICD. By immunoblot, this antibody recognizes the cleaved form of Notch-1 as a band at ∼110 kDa, and this antibody does not recognize full-length Notch-1. When treated with the γ-secretase inhibitor L-685458, expression of this band is reduced in a dose-dependent manner (Tokunaga et al., 2004).
After washing, the membranes were incubated with horseradish peroxidase-conjugated secondary antibody for 1 h at room temperature. Detection was performed using the VersaDoc Imaging System (Bio-Rad).
Quantitative real-time PCR.
RNA was purified from cultured cells or the hippocampus from control and tg mice using the RNeasy mini kit (Qiagen, Valencia, CA). Total RNA was reverse transcribed using iScript cDNA Synthesis kit (Bio-Rad) with 1 μg of total RNA in accordance with the instructions of the manufacturer. Quantitative PCR (qPCR) was performed with primers specific for Notch-1, Jagged, Delta, Notch-4, Hes-1, Hes-5, and β-actin (Table 1) using the iCycler iQ Real-Time PCR Detection System (Bio-Rad). Reactions were performed in a volume of 25 μl using the iQ SYBR Green Supermix (Bio-Rad) according to the instructions of the manufacturer.
Table 1.
Oligonucleotide sequences used as primers for qRT-PCR in mES cells and mouse brain
| Gene ID | Accession number | Primer F (5′ → 3′) | Primer R (5′ → 3′) |
|---|---|---|---|
| Notch-1 | NM_008714 | TCAATGCCGTGGATGACCTA | CCTTGTTGGCTCCGTTCTTC |
| Notch-4 | NM_010929 | TTCCCAAAAGGAGCCTCTGC | TCTACACAACACCCGGCACA |
| Jagged | NM_013822 | CGGGATGGAAACAGCTCAC | CACCAAGCAACAGACCCAAG |
| Delta | NM_019454 | CCGGGAACCTTCTCACTCAA | GCCAAATCTTACCCACAGCAA |
| Hes-1 | NM_008235 | GAGGCTGCCAAGGTTTTTGG | GCTGGTGTAGACCGGGATGA |
| Hes-5 | NM_010419 | ACATGGCCTTGGCTGTCTGA | TGCACCCACCCATACAAAGG |
| β-Actin | NM_007393 | CCGTGAAAAGATGACCCAGA | AGGCATACAGGGACAGCACA |
Accession numbers are from GenBank. F, Forward; R, reverse.
Production of lentivirus vector.
Vector plasmids were constructed essentially as described previously (Marr et al., 2003; Singer et al., 2005) for the production of third-generation LV vectors that expressed WT α-syn, A53T mut α-syn, or green fluorescent protein (GFP). The human cytomegalovirus promoter was used to drive expression of the transgenes. Lentiviral vectors were generated using a four-plasmid transfection with Lipofectamine transfection reagent (Invitrogen). Briefly, as described previously (Naldini et al., 1996a,b), 293T cells were transfected with vector and packaging plasmids (pMDL g/p.RRE, pMD.G, and pRSV–Rev) and incubated for 3 d. The supernatants including vectors were collected, and cell debris was eliminated by centrifugation.
Lentivirus and adenovirus-mediated infection of mES cells.
For delivery of α-syn, the LV system was used. The day before transduction, 3 × 10⁶ mES cells were plated on 0.1% gelatin-coated 10 cm dishes in mES medium. After 1d, the mES culture medium was changed, and LV–GFP, LV–WT α-syn, or LV–mut α-syn was added to the dishes. The mES cells were incubated for 24–72 h in a 5% CO2, 95% air at 37°C. All LV experiments were performed in cells infected with both vector and GFP controls, but most of the data included in the results used vector-infected cells to allow for double-labeling immunocytochemical analysis. An adenoviral vector system was used for intracellular delivery of NICD or LacZ control. For transduction, the cells were incubated with adenovirus for 24 h in 5% CO2, 95% air at 37°C.
In vitro cell proliferation and viability assays.
Cell proliferation rates were determined by the amount of 5-bromo-2′-deoxyuridine (BrdU) incorporation using a labeling and detection kit (Roche Diagnostics) in accordance with the instructions of the manufacturer. Briefly, dissociated embryoid bodies were cultured in 24-well plates (2 × 10⁵ cells) and differentiated into neurons according to the protocol described above. After 9 d, BrdU (10 μm final concentration) was added, and the cells were incubated for 24 h. The cells were fixed and incubated with anti-BrdU-peroxidase (20 U/ml) for 30 min at 37°C. The color was developed by the addition of peroxidase substrate, 2,2′-azino-bis(3-ethylbenzothiazoline-6-sulfonic acid), and measured at 405 nm (reference at 490 nm).
Cell death by apoptosis was evaluated in in vitro cultures by modified terminal deoxynucleotidyl transferase dUTP nick end labeling (TUNEL) assay (ApopTag In Situ Apoptosis Detection kit; Millipore Bioscience Research Reagents) (Biebl et al., 2005) using fixed cells prepared on glass coverslips.
γ-Secretase activity assay.
γ-Secretase activity was measured using the γ-secretase activity kit (R & D Systems, Minneapolis, MN) according to the instructions of the manufacturer.
Transgenic mice.
Transgenic mice expressing human WT or A53T mut α-syn under the control of the platelet-derived growth factor-β promoter were used. Mice were generated and bred as described previously (Masliah et al., 2000; Hashimoto et al., 2003). For these experiments, a total of 15 mice (n = 5 per group; 5 months old; C57BL6/DBA) were used.
All mice were killed following National Institutes of Health guidelines for the humane treatment of animals. The hippocampus from the right hemibrain was dissected and used for RNA analysis. The left hemibrain was fixed in 4% paraformaldehyde/PBS for 24 h and placed in 30% sucrose/PBS solution. The brains were cut sagittally into 25 μm sections using a sliding microtome on dry ice. The sections were stored in cryoprotectant (ethylene glycol, glycerol, 0.1 m phosphate buffer pH 7.4, 1:1:2 by volume) at −20°C until processed further for immunocytochemical analysis of neurogenesis and Notch expression.
Immunohistochemical analysis of markers of neurogenesis.
Briefly, as described previously (Winner et al., 2004, 2007), mES cells grown on coverslips or free-floating sections from mouse brains were treated with 0.6% H2O2 in Tris-buffered saline (TBS) (0.15 m NaCl and 0.1 m Tris-HCl, pH 7.5) for 30 min and incubated with antibodies against BrdU (1:500, rat monoclonal; Serotec, Raleigh, NC), proliferating cell nuclear antigen (PCNA) (mouse monoclonal, 1:250; Santa Cruz Biotechnology), doublecortin (DCX) (goat polyclonal, 1:100; Santa Cruz Biotechnology), β-tubulin (Tuj1-like TU-20 clone, mouse monoclonal, 1:500; Millipore Bioscience Research Reagents), nestin (rabbit polyclonal, 1:250; Millipore Bioscience Research Reagents), neuronal-specific nuclear protein (NeuN) (mouse monoclonal, 1:1000; Millipore Bioscience Research Reagents), or α-syn (rabbit polyclonal, 1:500; Millipore Bioscience Research Reagents) overnight at 4°C. Sections were incubated for 1 h with biotinylated secondary antibodies directed against mouse, goat, or rabbit. After rinses in TBS, avidin–biotin–peroxidase complex was applied for 1 h, and then peroxidase detection was performed for 10 min (25 mg/ml diaminobenzidine, 0.01% H2O2, and 0.04% NiCl in TBS). For detection of BrdU-labeled nuclei, the following DNA denaturation steps preceded the incubation with anti-BrdU antibody: 2 h incubation in 50% formamide/2× SSC (2× SSC: 0.3 m NaCl and 0.03 m sodium citrate) at 65°C, 5 min rinse in 2× SSC, 30 min incubation in 2 m HCl at 37°C, and 10 min rinse in 0.1 m boric acid, pH 8.5.
Double immunocytochemical analysis and confocal microscopy.
Differentiating mES cells grown on coverslips and free-floating sections from mouse brains were double labeled with polyclonal antibodies against α-syn (1:1000; Millipore Bioscience Research Reagents), DCX (1:500; Santa Cruz Biotechnology), Notch-1 (1:350; Santa Cruz Biotechnology), or GFAP (1:250; Millipore Bioscience Research Reagents) detected with the Tyramide Signal Amplification-Direct (Red) system (1:100; NEN Life Sciences, Boston, MA), and the mouse monoclonal antibodies against β-tubulin (Tuj1-like TU-20 clone, 1:100), α-syn (1:500; Millipore Bioscience Research Reagents), NeuN (1:250; Millipore Bioscience Research Reagents), nestin (1:250; Millipore Bioscience Research Reagents), NSE (1:250; Abcam), microtubule-associate protein-2 (MAP2) (1:50; Millipore Bioscience Research Reagents), or BrdU (1:500, with pretreatment as described above for BrdU detection) were detected with FITC-conjugated secondary antibodies (1:75; Vector Laboratories, Burlingame, CA) (Masliah et al., 2000). All sections were processed simultaneously under the same conditions, and experiments were performed twice to assess reproducibility. Sections were imaged with a Zeiss (Jena, Germany) 63× (numerical aperture 1.4) objective on an Axiovert 35 microscope (Zeiss) with an attached MRC1024 LSCM system (Bio-Rad) (Masliah et al., 2000). To confirm the specificity of primary antibodies, control experiments were performed in which sections were incubated overnight in the absence of primary antibody (deleted) or preimmune serum and primary antibody alone.
Analysis of apoptosis.
Histological detection of cell death in vibratome sections was performed using the TUNEL assay (ApopTag In Situ Apoptosis Detection kit; Millipore Bioscience Research Reagents) in a modified procedure for free-floating sections as described previously (Biebl et al., 2005).
Image analysis and stereology.
For quantification of neurogenic cells, a systematic random counting procedure, similar to the optical disector (Gundersen et al., 1988a,b), was used as described by Williams and Rakic (1988). To determine the number of DCX-, PCNA- or TUNEL-positive (TUNEL+) cells, every sixth section (160 μm interval) of the left hemisphere was selected from each animal and processed for immunohistochemistry. Sections were analyzed for DCX-, PCNA-, nestin-, NeuN-, GFAP, or TUNEL-positive cells in the SGZ of the DG. As described previously (Winner et al., 2004, 2007), BrdU-positive (newborn cells) cells were distinguished from BrdU/NeuN double-positive cells (newborn neurons) and BrdU/GFAP double-positive cells (newborn astrocytes), and ratios of these cell types were determined to assess the number of newborn cells that ultimately achieve neuronal or astrocytic fates. The reference volume was determined by tracing the areas using a semiautomatic stereology system (Stereoinvestigator; MicroBrightField, Colchester, VT). Positive cells were counted within a 30 × 30 μm counting frame, which was spaced in a 300 × 300 μm counting grid. Positive profiles that intersected the uppermost focal plane (exclusion plane) or the lateral exclusion boundaries of the counting frame were not counted. The total counts of positive profiles were multiplied by the ratio of reference volume to sampling volume to obtain the estimated number of positive cells for each structure.
Statistical analysis.
The data are expressed as mean values ± SEM. Statistical analysis was performed using one-way ANOVA followed by the Bonferroni's multiple comparison test (Prism Graph Pad Software; GraphPad Software, San Diego, CA). The significance level was set at p < 0.05.
Results
α-syn accumulation interferes with survival of mES cell-derived neural progeny
To investigate the mechanisms through which α-syn might impair the development and maturation of NPCs, the mES cell system was used as a model to recapitulate the effects of α-syn on neurogenesis. The neuronal differentiation protocol used in this study has been described previously (Bibel et al., 2004) and includes five stages (A through E) (Fig. 1A). After withdrawal of LIF and treatment with retinoic acid, the mES cells (Fig. 1B) (stage A) formed embryoid bodies (Fig. 1C) (stages B and C). After 4 d, embryoid bodies were dissociated into the putative NPCs (Fig. 1D) (stage D). The EB media was then replaced with B27 media, and cells began to differentiate into a neuronal phenotype (Fig. 1E,F) (stage E). At early stages of the differentiation protocol (stages A and B), the precursor cells expressed nestin (supplemental Fig. 1A–C, available at www.jneurosci.org as supplemental material) and later DCX (stage C-D) (supplemental Fig. 1D–F, available at www.jneurosci.org as supplemental material). Over the course of neuronal differentiation (8 d) (Fig. 1E,F,J,K), low levels of β-tubulin and NSE expression were first noted at stage D, with a progressive increase during stage E, reaching their peak at day 8 (E8) (Fig. 1G–K) (supplemental Fig. 1G–I, available at www.jneurosci.org as supplemental material). This was confirmed by Western blot analysis (supplemental Fig. 1J, available at www.jneurosci.org as supplemental material). By the end of stage E, ∼85% of the cells expressed neuronal markers, including β-tubulin, MAP2 (data not shown), and NSE and displayed polarization with formation of elongated neuritic processes (supplemental Fig. 1I, available at www.jneurosci.org as supplemental material). Approximately 5% of the cells expressed GFAP, whereas the remaining cells did not express neuronal or astroglial markers (data not shown). These heterogeneous cultures were composed primarily of cells expressing immature and mature neuronal markers, with a minority of cells expressing astroglial markers or markers of proliferating NPCs; therefore, we defined these cultures as “mES cell-derived neural progeny.”
Figure 1.

Neuronal differentiation of mES cells. A, Schematic representation of neuronal differentiation procedure. mES cells were cultured on 0.1% gelatin-coated plate and grown as a monolayer (stage A). mES cells on nonadherent dishes form embryoid bodies (stage B). After 4 d of embryoid body formation, retinoic acid was added (stage C). Embryoid bodies were dissociated and plated on poly-ornithine/laminin-coated plates in N2 medium (stage D). After 2 d, medium was replaced with B27 medium and cultured for 8 d (stage E). B–F, Phase-contrast images of the mES cells during the differentiation process. G–K, Expression of the neuronal marker β-tubulin in the mES cells during differentiation. L–P, Lentivirus-mediated transduction of GFP into mES cells. Scale bar: (in F) B, E–P, 30 μm; C, D, 60 μm.
To address the effects of α-syn on neuronal differentiation, at stage A, mES cells were infected with LV vectors encoding GFP (Fig. 1L), WT α-syn, or mut α-syn. Approximately 48 h after infection, >95% of the mES cells expressed GFP (Fig. 1M). Expression of this protein was observed at the various stages of the differentiation process and was abundantly produced by cells displaying neuronal morphology at the end of the procedure (Fig. 1L–P). This indicates that the LV strategy used was effective at driving the transgene expression in mES cells, viability was not compromised, and levels of transgene expression were maintained throughout the differentiation process.
Similarly, mES cells infected with control LV vector demonstrated formation of embryoid bodies and neuronal differentiation (supplemental Fig. 2A–L, available at www.jneurosci.org as supplemental material). mES cells infected with LV–α-syn displayed sustained levels of the transgene product through the various time points of the protocol (supplemental Fig. 2M–X, available at www.jneurosci.org as supplemental material) and was observed to accumulate in differentiated neurons 4 d into the final phase (supplemental Fig. 2V–X, available at www.jneurosci.org as supplemental material). Although high levels of α-syn were observed at all stages, there was no apparent disruption of the differentiation process from embryoid bodies to progenitor cells to neurons (supplemental Fig. 2M–X, available at www.jneurosci.org as supplemental material). However, compared with cells infected with an LV control (Fig. 2A–C) or GFP (data not shown), mES cells expressing WT and mut α-syn displayed alterations in their neuritic processes (Fig. 2D–I) with decreased branching, length (Fig. 2J), and expression of β-tubulin (Fig. 2K). Similar to the alterations in β-tubulin expression, the mature neuronal markers NSE and MAP2 were also reduced at stage E8 (data not shown). In these cells, α-syn accumulated in the cytoplasm, forming irregular aggregates (Fig. 2D–I). Immunoblot analysis showed that both WT and mut α-syn were expressed at high and comparable levels at the various stages of differentiation (Fig. 2L). Immunoblot analysis also confirmed that, compared with vector control, mES cells infected with WT α-syn or mut α-syn displayed a significant decrease in levels of β-tubulin expression (Fig. 2L,M).
Figure 2.
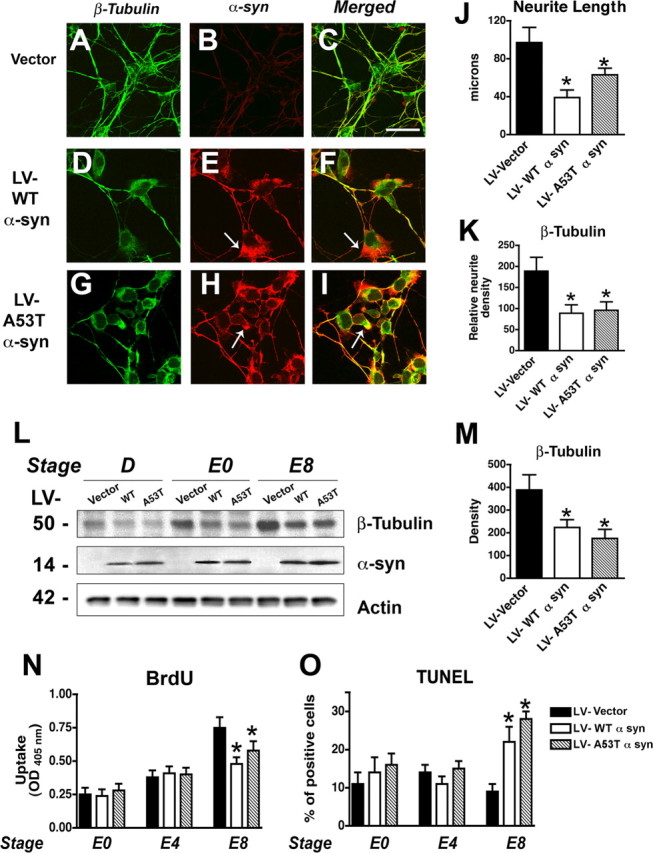
Effects of α-syn on neurogenesis in mES cells. A–I, Lentivirus-mediated α-syn expression in mES cells. Vector-, WT α-syn-, or A53T mut α-syn (A53T)-transduced mES cells were harvested at stage E8. α-Synuclein accumulated in cell bodies (arrows) and was accompanied by decreased levels of the neuronal differentiation marker β-tubulin. Scale bar, 20 μm. J, Quantification of neurite lengths in vector-, WT α-syn-, and A53T mut α-syn-infected differentiated (stage E8) mES cells. K, Semiquantitative analysis of levels of β-tubulin expression in stage E8 mES cells. L, Vector-, WT α-syn-, or A53T mut α-syn-transduced cells were harvested at the indicated stages. Proteins in total cell lysates were separated by SDS-PAGE and immunoblotted with anti-β-tubulin, anti-α-syn, or anti-β-actin, as indicated. M, Quantitative analysis of immunoblot levels of β-tubulin. N, α-Synuclein overexpression decreased proliferation of differentiating neuronal cells. Dissociated embryoid bodies were cultured using the neuronal differentiation protocol. After 9 d (day E7), BrdU (10 μm final concentration) was added, and the cells were incubated for 24 h. The cells were fixed and incubated with anti-BrdU-peroxidase. Peroxidase substrate was added and measured at 405 nm. O, Increased TUNEL-positive cells in α-syn-infected differentiated mES cells at stage E8. *p < 0.01 compared with vector-infected control cells (one-way ANOVA with post hoc Dunnett's test). OD, Optical density.
The reduced expression of neuronal markers in the differentiating mES cells suggests that α-syn interferes with neuronal differentiation and the maturation of newly developing neurons or increases cell death of newborn neurons. To further characterize the effects of α-syn in this process, BrdU and TUNEL assays were performed. These analyses showed that, compared with LV control, in WT and mut α-syn-expressing cells, BrdU uptake was reduced by ∼30% (Fig. 2N), whereas the number of TUNEL-positive cells was increased approximately twofold to threefold (Fig. 2O) by the end of the neuronal differentiation protocol. Together, these results suggest that the reduction in neuronal markers in differentiating mES cells may primarily be an effect of reduced cell survival mediated by the accumulation of α-syn in NPCs.
Overexpression of α-syn in mES cells results in reduced Notch-1 expression in neural progeny
Because previous reports indicate that Notch signaling is required for the survival of NPCs (Mason et al., 2006) and neuronal differentiation (Lutolf et al., 2002; Mason et al., 2005), we investigated the possibility that α-syn might disturb the process of neurogenesis by interfering with the expression of Notch-1 and related genes. Immunoblot analysis showed that levels of full-length (FL) and cleaved (NCID) Notch-1 were dramatically reduced (Fig. 3A,B). Immunocytochemical studies confirmed that levels of FL-Notch-1 protein and active Notch-1 that translocated into the nucleus were reduced in α-syn-expressing neural progeny derived from mES cells (Fig. 3C–F). Consistent with the results obtained by immunoblot, by qPCR, only levels of Notch-1 mRNA (Fig. 3G), but not the Notch ligands Jagged or Delta (Fig. 3H), were significantly decreased in mES cells infected with LV–WT α-syn and mut α-syn at E8 of the neuronal differentiation protocol. To further investigate the effects of α-syn expression on Notch-1 signaling, levels of downstream targets of the Notch signaling pathway were analyzed by qPCR. These studies demonstrated a reduction in the levels of Hes-5, but levels of Hes-1 appeared unchanged (Fig. 3I). Moreover, analysis of an additional member of the Notch receptor family, Notch-4, also showed no significant changes in expression levels (Fig. 3G), suggesting that the effects of α-syn are specific to the Notch-1 signaling cascade and downregulate signaling through this pathway primarily via Hes-5. Notch-1 activation is known to be regulated by γ-secretase, so γ-secretase activity was then examined in differentiated cells at the E8 time point. Although cleavage of Notch-1 was decreased in LV–α-syn-infected cells, there were no significant differences in γ-secretase activity (Fig. 3J), suggesting that Notch-1 inactivation in α-syn-overexpressing cells is likely a result of decreased Notch-1 expression.
Figure 3.

Effects of α-syn on Notch-1 expression in mES cells. A, Immunoblot analysis of neuronal differentiated cells harvested at stage E8. Proteins in total cell lysates were separated by SDS-PAGE and immunoblotted with anti-β-tubulin, anti-Notch-1 (full-length), anti-NICD, or anti-β-actin. B, Quantification of Notch-1 expression (normalized to β-actin levels). C–E, Double-immunolabeling analysis of differentiated neuronal cells at stage E8 with antibodies against Notch-1 and β-tubulin. Scale bar, 30 μm. F, Levels of Notch-1 immunoreactivity in stage E8 differentiated neuronal cells infected with LV–vector, WT α-syn, or A53T mut α-syn. G, mRNA expression of Notch-1 and Notch-4 as measured by qPCR in stage E8 neuronal differentiated mES cells infected with LV–vector, WT α-syn, or A53T mut α-syn. H, mRNA expression of Jagged and Delta as measured by qPCR in stage E8 neuronal differentiated mES cells infected with LV–vector, WT α-syn, or A53T mut α-syn. I, mRNA expression of Hes-1 and Hes-5 as measured by qPCR in stage E8 neuronal differentiated mES cells infected with LV–vector, WT α-syn, or A53T mut α-syn. J, γ-Secretase activity in stage E8 differentiated mES cells infected with LV–vector, WT α-syn, or A53T mut α-syn. *p < 0.05 compared with vector-infected control cells (one-way ANOVA with post hoc Dunnett's test).
Adenovirus-driven NICD expression reverses the defects in neurogenesis by increasing survival of α-syn-expressing mES-cell derived neural progeny
To further investigate the possibility that Notch-1 might be involved in the alterations in NPC survival observed in differentiated LV–α-syn-expressing mES cell cultures, we transduced NICD into mES cell-derived neural progeny using an adenoviral vector. The efficiency of infection by adenovirus encoding lacZ was determined by β-galactosidase staining of cells infected at different multiplicities of infection (MOI): 3, 10, or 30. Even the lowest MOI showed high transduction efficiency. NICD expression was also confirmed by immunoblotting with adenoviral-infected cell lysates (Fig. 4A). To analyze the effect of NICD transduction on cell proliferation, we performed immunoblotting and cell proliferation (BrdU uptake) assays with the mES cell-derived neural progeny infected with adenoviral vectors encoding lacZ or NICD. Notch pathway activation by NICD-transduction reversed the observed decrease of β-tubulin expression in α-syn-infected cells (Fig. 4A,B), increased cell proliferation to levels comparable with the control samples (Fig. 4C), and reduced the amount of cells undergoing apoptosis in both WT α-syn and mut α-syn-infected cells (Fig. 4D).
Figure 4.

NICD reversed the decrease in neuronal differentiation and proliferation in α-syn-transduced cells. A, Adenovirus-mediated (MOI of 3) NICD–HA expression in stage E8 neuronal differentiated cells infected with LV–vector, WT α-syn, or A53T mut α-syn. Proteins in total cell lysates were separated by SDS-PAGE and immunoblotted with antibodies against β-tubulin, α-syn, HA, or β-actin. B, NICD expression reversed the decrease in β-tubulin expression in α-syn-transduced cells. C, NICD expression reversed the decrease of cell proliferation in α-syn-transduced cells. Cells were incubated with BrdU (10 μm final concentration) on day E7. After 24 h (E8), the cells were fixed and incubated with anti-BrdU-peroxidase. Peroxidase substrate was added and measured at 405 nm. D, NICD reduced the numbers of TUNEL-positive cells in α-syn-expressing cells. *p < 0.05 compared with vector-infected control cells (one-way ANOVA with post hoc Dunnett's test). OD, Optical density.
Alterations in neurogenesis in α-syn tg mice are accompanied by reduced Notch-1 expression
Previous studies have shown that neurogenesis is disturbed in Parkinson's disease (Hoglinger et al., 2004) as well as in animal models (Winner et al., 2004, 2007). Therefore, to further investigate in vivo the involvement of Notch-1 in the α-syn-dependent alterations, neurogenesis was analyzed in the hippocampus of young α-syn tg mice. Compared with non-tg controls, in the SGZ of the DG of the α-syn tg mice, there was a significant (40–50%) decrease in the number of surviving BrdU-positive NPCs (Fig. 5A–C). This was accompanied by a reduction in the numbers of DCX+ neuroblasts (Fig. 5D–F) that was more severe in the mut α-syn tg mice. To better understand whether the alterations in neurogenesis were related to disturbances in differentiation or increased cell death, PCNA, TUNEL, and double-labeling studies were performed. This analysis showed comparable numbers of proliferating PCNA+ (Fig. 5G) NPCs in the non-tg and WT α-syn tg mice but a significant decrease in the mut α-syn tg mice. Moreover, there was an increase in the numbers of TUNEL+ NPCs (Fig. 5H), consistent with previous studies in aged α-syn tg mice (Winner et al., 2004, 2007). This decreased survival of NPCs in the DG was more severe in the mut α-syn tg mice than in the WT α-syn tg animals (Fig. 5H). In contrast, numbers of nestin-positive progenitor cells (Fig. 5I) were unchanged. In addition, the proportion of BrdU-positive NPCs converting into NeuN-positive mature neurons or GFAP-positive mature astrocytes were unchanged (Fig. 5J). Together, these results suggest that the reduced neurogenesis in the α-syn tg mice might be related to decreased survival of NPCs.
Figure 5.

Alterations in neurogenesis in α-syn tg mice. Images are from the SGZ of the DG of 5-month-old mice (n = 5). A, BrdU-positive cells (arrows) in a non-tg mouse 30 d after BrdU treatment. B, Reduced numbers of surviving BrdU-positive cells (arrow) in A53T mut α-syn tg mouse 30 d after BrdU treatment. C, Analysis of total numbers of BrdU-positive cells in the SGZ. D, DCX-positive newly formed neuroblasts (arrows) in a non-tg mouse. E, Reduced numbers of DCX-positive newly formed neuroblasts (arrow) in A53T mut α-syn tg mouse. Scale bar, 50 μm. F, Analysis of total numbers of DCX-positive cells in the SGZ. G, Comparison of numbers of PCNA-positive cells in the DG. H, Comparison of total numbers of TUNEL-positive cells in the DG. I, Comparison of numbers of nestin-positive cells in the DG. J, Comparison of numbers of BrdU-positive cells colabeled with NeuN or GFAP in the DG. *p < 0.05 compared with non-tg control (one-way ANOVA with post hoc Dunnett's test).
Because Notch-1 signaling has been shown to play an important role in neurogenesis and neuronal survival (Lutolf et al., 2002; Mason et al., 2006), double-immunolabeling studies were performed to confirm that Notch-1-expressing neuroblasts also express α-syn and markers of neurogenesis. This analysis showed that neuroblasts in the hippocampus of α-syn tg mice coexpressed Notch-1 and α-syn (Fig. 6A–C), Notch-1 and DCX (Fig. 6D–F), and α-syn and DCX (Fig. 6G–I). To further investigate the role of Notch-1 in neurogenesis, levels of components of this pathway were analyzed by immunocytochemistry, immunoblot, and qPCR. Consistent with previous in situ hybridization studies (Stump et al., 2002), with the antibody against Notch-1, granular cells in the DG of the non-tg mice showed punctate cytoplasmic immunostaining, and NPCs in the SGZ displayed primarily a diffuse cytoplasmic pattern of immunoreactivity (Fig. 7A). The neuropil in the molecular layer also showed punctate immunolabeling. Compared with control mice, and consistent with the results in mES cells, the levels of Notch-1 immunoreactivity were significantly reduced in the DG of α-syn tg mice (Fig. 7A–C). Consistent with the immunocytochemical studies, Western blot (Fig. 7D–F) and qPCR (Fig. 7G–I) analyses confirmed that the expression of Notch-1 (Fig. 7D,E,G) and Hes-5 (Fig. 7D,F,I) were reduced in the α-syn tg mice compared with non-tg controls, whereas expression of Notch-4 (Fig. 7D,E,G), Hes-1 (Fig. 7D,F,I), and Jagged and Delta (Fig. 7H) were not affected. Together, these in vivo data support the notion that α-syn might interfere with neurogenesis by reducing NPC survival via downregulation of Notch-1 expression and signaling.
Figure 6.
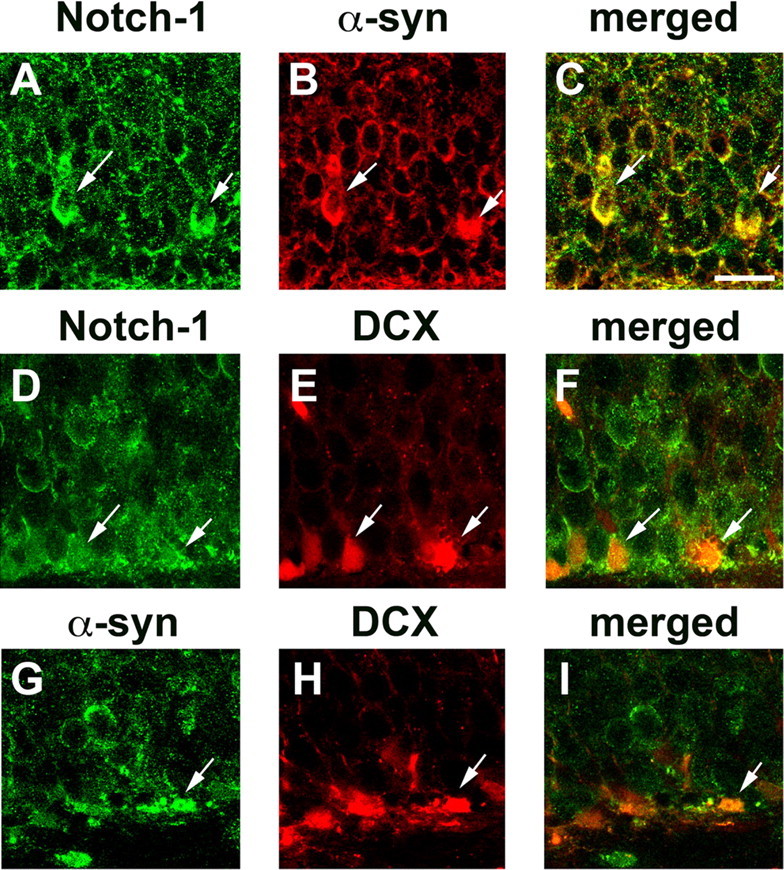
Coexpression of α-syn with markers of neurogenesis and Notch signaling in the brains of α-syn tg mice. Images are from the SGZ of the DG of 5-month-old A53T mut α-syn tg mice. A–C, Colocalization in neuroblasts (arrows) of Notch-1 and α-syn. D–F, Colocalization (arrows) of Notch-1 and DCX. G–I, Colocalization (arrows) of α-syn and DC. Scale bar, 20 μm.
Figure 7.

Immunocytochemical, immunoblot, and qPCR analyses of the effects of α-syn on Notch expression in the hippocampus of tg mice. Images are from the DG, including the molecular layer (ML), DG, and SGZ of 5-month-old mice (n = 5). A, Patterns of Notch-1 expression in the SGZ of a non-tg mouse. B, Reduced Notch-1 expression in an A53T mut α-syn tg mice. Scale bar, 50 μm. C, Analysis of levels of Notch-1 expression (immunoreactivity) in the DG. D, Proteins in brain homogenates from non-tg, WT α-syn tg, and A53T mut α-syn tg mice were separated by SDS-PAGE and immunoblotted with antibodies against Notch-1, Notch-4, Hes-1, Hes-5, or β-actin, as indicated. E, Quantitative analysis of immunoblot levels of Notch-1 and Notch-4. F, Quantitative analysis of immunoblot levels of Hes-1 and Hes-5. G, Comparison of levels of Notch-1 and Notch-4 mRNA in the hippocampus by qPCR. H, Comparison of levels of Jagged and Delta mRNA in the hippocampus by qPCR. I, Comparison of levels of Hes-1 and Hes-5 mRNA in the hippocampus by qPCR. *p < 0.05 compared with non-tg control (one-way ANOVA with post hoc Dunnett's test).
Discussion
The present study showed that overexpression of α-syn in mES cells reduced NPC survival, leading to a disruption of neurogenesis. These results are consistent with recent studies in mouse (Yamashita et al., 2006) and human (Schneider et al., 2007) ES cells, showing that α-syn compromises the viability of NPCs. In the present study, we report that LV-driven expression of WT and mut α-syn in mES cells resulted in reduced BrdU uptake and β-tubulin expression, accompanied by an increase in the numbers of mES cell-derived neural progeny undergoing apoptosis. The reduced viability observed in the α-syn-expressing neural progeny is in agreement with a recent report by Yamashita et al. (2006). In their model, mES cells transfected to express full-length human WT α-syn or the A30P and A53T mutated forms were differentiated into dopaminergic neurons. The resulting neurons showed increased susceptibility to cellular stress triggered by oxidative agents and proteasome and mitochondrial inhibition, factors likely to be involved in PD pathogenesis (Hattori and Mizuno, 2004). Notably, when the same ES cell lines were differentiated into oligodendrocytes, no differences in cell viability were noted, suggesting that α-syn-induced cell death might be neuron specific (Yamashita et al., 2006). In another study, it has been reported that, in human NPCs derived from ES cells, overexpression of mut α-syn (A53T) also compromised the viability and maturation of neurons (Schneider et al., 2007). Moreover, WT and A53T mut α-syn progressively impaired the innate ability of progenitors to switch toward gliogenesis at later passages (Schneider et al., 2007).
ES cell models have been incorporated recently into PD research as an alternative tool for modeling the human disease. Although most studies focus on dopaminergic neurons, a growing number of reports have shown that other subcortical neuronal populations are affected in PD as well, such as pyramidal neurons in the hippocampus and neocortex of the brains of patients with LBD (Harding et al., 2002; McKeith et al., 2004). In addition, α-syn accumulation in the limbic system has been shown to interfere with neurogenesis in the hippocampus and olfactory bulb in aged adult α-syn tg mice (Winner et al., 2004, 2007). Consistent with these latter observations, in young-adult α-syn tg mice, we observed decreased neurogenesis in the SGZ of the DG. The alterations in neurogenesis in the WT and mut α-syn tg mice were primarily related to decreased survival of NPCs (as reflected by increased TUNEL staining and decreased BrdU uptake after 30 d) rather than to reduced neuronal differentiation. In addition, in the mut α-syn tg mice, there was reduced proliferation of NPCs. Together, the studies in the mES cells as well as in tg mice suggest that the alterations in neurogenesis are related to reduced survival of NPCs.
The mechanisms through which accumulation of α-syn in precursor cells might impair neurogenesis are not completely clear. Our studies in α-syn-overexpressing mES cells and in young-adult α-syn tg mice offer a clue suggesting that accumulation of α-syn might impair neurogenesis by reducing NPC survival via downregulation of Notch-1 expression. Notch-1 is traditionally understood to be required for neuronal and glial differentiation (Louvi and Artavanis-Tsakonas, 2006), but previous studies also implicate Notch-1 in the survival of NPCs (Oishi et al., 2004; Mason et al., 2006). Moreover, an elegant recent report showed that Notch-1 regulates the fate and dendritic morphology of newborn neurons in the postnatal DG (Breunig et al., 2007). In support of these dual roles for Notch-1, studies using conditional gene ablation have shown that loss of Notch-1 results in incomplete differentiation and elimination by apoptosis (Lutolf et al., 2002), suggesting that Notch activity supports the survival of both progenitors and newly differentiating cells in the developing nervous system (Mason et al., 2006). Therefore, restoration of Notch signaling might allow the completion of neuronal differentiation by promoting the survival of NPCs. In support of this possibility, we showed that gene transfer of NICD recovers the expression of neuronal markers in α-syn-overexpressing mES cell-derived neural progeny, and this is accompanied by increased BrdU uptake and decreased numbers of cells displaying staining by TUNEL assay. This might suggest that the downregulation of Notch-1 by α-syn interferes with neurogenesis by triggering elimination of these neuronal precursors via apoptosis. The mechanisms through which Notch-1 might regulate survival of NPCs may involve pathways distinct from those targeted in differentiation (Oishi et al., 2004). Future studies will be necessary to better understand the precise connection between Notch, α-syn, neurogenesis, and programmed cell death.
Although multiple pathways may be involved in Notch-1-mediated regulation of NPC survival, the canonical Notch-1 signaling cascade targets the transcriptional regulators Hes-1 and Hes-5. Because in NPCs accumulation of α-syn interferes with neurogenesis by downregulating Notch-1, it was predicted that downstream signaling molecules in this pathway might be similarly affected. In agreement with this possibility, we found that levels of Hes-5 were significantly reduced in mES cells and tg mice overexpressing α-syn.
Accumulation of α-syn in NPCs might lead to reduced Notch-1 via transcriptional or posttranscriptional effects. Because in our in vitro model we did not detect a decrease in γ-secretase activity, and Jagged and Delta ligands were not affected in neurons derived from LV–α-syn-infected mES cells, the observed effects on Notch-1 expression are most likely the result of alterations in transcription. The mechanisms through which accumulation of α-syn might disrupt Notch-1 gene expression are unclear. One possibility might be interference with transcriptional machinery. In support of this, α-syn has been found to be associated with histone proteins (Goers et al., 2003) and affects both their acetylation and expression levels (Goers et al., 2003; Duce et al., 2006; Kontopoulos et al., 2006; Vartiainen et al., 2006). Although α-syn is almost exclusively present in nerve terminals during adulthood (Iwai et al., 1994), it has been found in the perikarya during development (Hsu et al., 1998; Galvin et al., 2001; Raghavan et al., 2004). This change in subcellular localization indicates that α-syn function may evolve as neural differentiation and maturation progresses (Winner et al., 2004). NPCs express endogenous α-syn, although at a low level. When this protein is overexpressed, it accumulates in both cytoplasmic microvesicles and the cell nucleus (Schneider et al., 2007). In this context, it is possible that increased accumulation of α-syn in NPCs might result in nuclear translocation and interactions with the DNA matrix, as suggested by its association with histone proteins (Goers et al., 2003). This in turn might influence the transcription patterns of genes involved in neurogenesis such as Notch-1. Verification of this hypothesis and additional studies on other genes affected by α-syn awaits further investigation.
Accumulation of α-syn is central to the pathogenesis of disorders with parkinsonism (Trojanowski and Lee, 1998). Abnormal accumulation is considered to be the result of alterations in the balance between α-syn production, aggregation, and clearance (Hashimoto et al., 2004). Although accumulation of α-syn in mature neurons might result in synaptic dysfunction and eventually in cell death, in NPCs α-syn interferes with neurogenesis, more specifically with the survival of neural progeny in the terminal phase of neuronal differentiation. This is supported by our studies in mES cells demonstrating that the alterations in the expression of neuronal markers occurred in the latest stages of neuronal differentiation (E8). Moreover, in the tg mice, abnormal accumulation of α-syn in NPCs reduced the number of DCX-positive neuroblasts but did not alter the number of progenitor cells in the hippocampal DG. Neurogenesis is a multistep process that includes proliferation of precursor cells, migration of the newborn cells, differentiation, integration into neuronal circuits, and survival (Scholzke and Schwaninger, 2007). Alterations in neurogenesis are important not only for familial but also for sporadic forms of LBD, because recent studies have shown that, in the adult CNS, this process plays an important role in learning and memory (van Praag et al., 1999, 2002; Brown et al., 2003). Our results reveal that the alterations in Notch-1 expression associated with α-syn accumulation plays a detrimental role in the later stages of neurogenesis by interfering with the survival of neural progeny, resulting in the elimination of these cells via apoptosis.
In summary, these results suggest that accumulation of α-syn might contribute to the neurodegenerative process by impairing neurogenesis and survival of differentiating neural progeny through alterations in Notch-1 expression. The subsequent disruption of the Notch signaling pathway might result in a decrease in NPC proliferation and survival. Together, these results suggest that accumulation of α-syn plays a predominantly detrimental role in the survival of NPCs, triggering their elimination by apoptosis. Similar mechanisms could be at play in PD and LBD and might contribute to the neurodegenerative phenotype in the limbic system.
Footnotes
This work was supported by National Institutes of Health Grants AG10435, AG022074, AG18440, and AG5131.
References
- Bibel M, Richter J, Schrenk K, Tucker KL, Staiger V, Korte M, Goetz M, Barde YA. Differentiation of mouse embryonic stem cells into a defined neuronal lineage. Nat Neurosci. 2004;7:1003–1009. doi: 10.1038/nn1301. [DOI] [PubMed] [Google Scholar]
- Biebl M, Winner B, Winkler J. Caspase inhibition decreases cell death in regions of adult neurogenesis. NeuroReport. 2005;16:1147–1150. doi: 10.1097/00001756-200508010-00003. [DOI] [PubMed] [Google Scholar]
- Breunig JJ, Silbereis J, Vaccarino FM, Sestan N, Rakic P. Notch regulates cell fate and dendrite morphology of newborn neurons in the postnatal dentate gyrus. Proc Natl Acad Sci USA. 2007;104:20558–20563. doi: 10.1073/pnas.0710156104. [DOI] [PMC free article] [PubMed] [Google Scholar]
- Brown J, Cooper-Kuhn CM, Kempermann G, Van Praag H, Winkler J, Gage FH, Kuhn HG. Enriched environment and physical activity stimulate hippocampal but not olfactory bulb neurogenesis. Eur J Neurosci. 2003;17:2042–2046. doi: 10.1046/j.1460-9568.2003.02647.x. [DOI] [PubMed] [Google Scholar]
- Duce JA, Smith DP, Blake RE, Crouch PJ, Li QX, Masters CL, Trounce IA. Linker histone H1 binds to disease associated amyloid-like fibrils. J Mol Biol. 2006;361:493–505. doi: 10.1016/j.jmb.2006.06.038. [DOI] [PubMed] [Google Scholar]
- Feany M, Bender W. A Drosophila model of Parkinson's disease. Nature. 2000;404:394–398. doi: 10.1038/35006074. [DOI] [PubMed] [Google Scholar]
- Gage FH, Kempermann G, Palmer TD, Peterson DA, Ray J. Multipotent progenitor cells in the adult dentate gyrus. J Neurobiol. 1998;36:249–266. doi: 10.1002/(sici)1097-4695(199808)36:2<249::aid-neu11>3.0.co;2-9. [DOI] [PubMed] [Google Scholar]
- Galvin JE, Schuck TM, Lee VM, Trojanowski JQ. Differential expression and distribution of alpha-, beta-, and gamma-synuclein in the developing human substantia nigra. Exp Neurol. 2001;168:347–355. doi: 10.1006/exnr.2000.7615. [DOI] [PubMed] [Google Scholar]
- Goers J, Manning-Bog AB, McCormack AL, Millett IS, Doniach S, Di Monte DA, Uversky VN, Fink AL. Nuclear localization of alpha-synuclein and its interaction with histones. Biochemistry. 2003;42:8465–8471. doi: 10.1021/bi0341152. [DOI] [PubMed] [Google Scholar]
- Gundersen H, Bendtsen T, Korbo L, Marcussen N, Moller A, Nielsen K, Nyengaard J, Pakkenberg B, Sorensen F, Vesterby A. Some new, simple and efficient stereological methods and their use in pathological research and diagnosis. APMIS. 1988a;96:379–394. doi: 10.1111/j.1699-0463.1988.tb05320.x. [DOI] [PubMed] [Google Scholar]
- Gundersen HJ, Bagger P, Bendtsen TF, Evans SM, Korbo L, Marcussen N, Moller A, Nielsen K, Nyengaard JR, Pakkenberg B, Sørensen FB, Vesterby A, West MJ. The new stereological tools: disector, fractionator, nucleator and point sampled intercepts and their use in pathological research and diagnosis. APMIS. 1988b;96:857–881. doi: 10.1111/j.1699-0463.1988.tb00954.x. [DOI] [PubMed] [Google Scholar]
- Harding AJ, Lakay B, Halliday GM. Selective hippocampal neuron loss in dementia with Lewy bodies. Ann Neurol. 2002;51:125–128. doi: 10.1002/ana.10071. [DOI] [PubMed] [Google Scholar]
- Hashimoto M, Masliah E. Alpha-synuclein in Lewy body disease and Alzheimer's disease. Brain Pathol. 1999;9:707–720. doi: 10.1111/j.1750-3639.1999.tb00552.x. [DOI] [PMC free article] [PubMed] [Google Scholar]
- Hashimoto M, Rockenstein E, Masliah E. Transgenic models of alpha-synuclein pathology: past, present, and future. Ann NY Acad Sci. 2003;991:171–188. [PubMed] [Google Scholar]
- Hashimoto M, Kawahara K, Bar-On P, Rockenstein E, Crews L, Masliah E. The role of alpha-synuclein assembly and metabolism in the pathogenesis of Lewy body disease. J Mol Neurosci. 2004;24:343–352. doi: 10.1385/JMN:24:3:343. [DOI] [PubMed] [Google Scholar]
- Hattori N, Mizuno Y. Pathogenetic mechanisms of parkin in Parkinson's disease. Lancet. 2004;364:722–724. doi: 10.1016/S0140-6736(04)16901-8. [DOI] [PubMed] [Google Scholar]
- Hoglinger GU, Rizk P, Muriel MP, Duyckaerts C, Oertel WH, Caille I, Hirsch EC. Dopamine depletion impairs precursor cell proliferation in Parkinson disease. Nat Neurosci. 2004;7:726–735. doi: 10.1038/nn1265. [DOI] [PubMed] [Google Scholar]
- Hsu L, Mallory M, Xia Y, Veinbergs I, Hashimoto M, Yoshimoto M, Thal L, Saitoh T, Masliah E. Expression pattern of the non-Ab component of Alzheimer's disease amyloid precursor protein (NACP/a-synuclein) during brain development. J Neurochem. 1998;71:338–344. doi: 10.1046/j.1471-4159.1998.71010338.x. [DOI] [PubMed] [Google Scholar]
- Iwai A, Masliah E, Yoshimoto M, De Silva R, Ge N, Kittel A, Saitoh T. The precursor protein of non-Ab component of Alzheimer's disease amyloid (NACP) is a presynaptic protein of the central nervous system. Neuron. 1994;14:467–475. doi: 10.1016/0896-6273(95)90302-x. [DOI] [PubMed] [Google Scholar]
- Iwatsubo T, Yamaguchi H, Fujimuro M, Yokosawa H, Ihara Y, Trojanowski JQ, Lee V-M. Purification and characterization of Lewy bodies from brains of patients with diffuse Lewy body disease. Am J Pathol. 1996;148:1517–1529. [PMC free article] [PubMed] [Google Scholar]
- Kontopoulos E, Parvin JD, Feany MB. Alpha-synuclein acts in the nucleus to inhibit histone acetylation and promote neurotoxicity. Hum Mol Genet. 2006;15:3012–3023. doi: 10.1093/hmg/ddl243. [DOI] [PubMed] [Google Scholar]
- Kramer ML, Schulz-Schaeffer WJ. Presynaptic α-synuclein aggregates, not Lewy bodies, cause neurodegeneration in dementia with Lewy bodies. J Neurosci. 2007;27:1405–1410. doi: 10.1523/JNEUROSCI.4564-06.2007. [DOI] [PMC free article] [PubMed] [Google Scholar]
- Kruger R, Kuhn W, Muller T, Woitalla D, Graeber M, Kosel S, Przuntek H, Epplen J, Schols L, Reiss O. Ala30Pro mutation in the gene encoding α-synuclein in Parkinsons's disease. Nat Genet. 1998;18:106–108. doi: 10.1038/ng0298-106. [DOI] [PubMed] [Google Scholar]
- Lansbury PTJ. Evolution of amyloid: What normal protein folding may tell us about fibrillogenesis and disease. Proc Natl Acad Sci USA. 1999;96:3342–3344. doi: 10.1073/pnas.96.7.3342. [DOI] [PMC free article] [PubMed] [Google Scholar]
- Lee MK, Stirling W, Xu Y, Xu X, Qui D, Mandir AS, Dawson TM, Copeland NG, Jenkins NA, Price DL. Human alpha-synuclein-harboring familial Parkinson's disease-linked Ala-53 → Thr mutation causes neurodegenerative disease with alpha-synuclein aggregation in transgenic mice. Proc Natl Acad Sci USA. 2002;99:8968–8973. doi: 10.1073/pnas.132197599. [DOI] [PMC free article] [PubMed] [Google Scholar]
- Lee VM, Giasson BI, Trojanowski JQ. More than just two peas in a pod: common amyloidogenic properties of tau and alpha-synuclein in neurodegenerative diseases. Trends Neurosci. 2004;27:129–134. doi: 10.1016/j.tins.2004.01.007. [DOI] [PubMed] [Google Scholar]
- Louvi A, Artavanis-Tsakonas S. Notch signalling in vertebrate neural development. Nat Rev Neurosci. 2006;7:93–102. doi: 10.1038/nrn1847. [DOI] [PubMed] [Google Scholar]
- Lutolf S, Radtke F, Aguet M, Suter U, Taylor V. Notch1 is required for neuronal and glial differentiation in the cerebellum. Development. 2002;129:373–385. doi: 10.1242/dev.129.2.373. [DOI] [PubMed] [Google Scholar]
- Marr RA, Rockenstein E, Mukherjee A, Kindy MS, Hersh LB, Gage FH, Verma IM, Masliah E. Neprilysin gene transfer reduces human amyloid pathology in transgenic mice. J Neurosci. 2003;23:1992–1996. doi: 10.1523/JNEUROSCI.23-06-01992.2003. [DOI] [PMC free article] [PubMed] [Google Scholar]
- Masliah E, Rockenstein E, Veinbergs I, Mallory M, Hashimoto M, Takeda A, Sagara, Sisk A, Mucke L. Dopaminergic loss and inclusion body formation in alpha-synuclein mice: implications for neurodegenerative disorders. Science. 2000;287:1265–1269. doi: 10.1126/science.287.5456.1265. [DOI] [PubMed] [Google Scholar]
- Mason HA, Rakowiecki SM, Raftopoulou M, Nery S, Huang Y, Gridley T, Fishell G. Notch signaling coordinates the patterning of striatal compartments. Development. 2005;132:4247–4258. doi: 10.1242/dev.02008. [DOI] [PubMed] [Google Scholar]
- Mason HA, Rakowiecki SM, Gridley T, Fishell G. Loss of notch activity in the developing central nervous system leads to increased cell death. Dev Neurosci. 2006;28:49–57. doi: 10.1159/000090752. [DOI] [PubMed] [Google Scholar]
- McKeith I, Mintzer J, Aarsland D, Burn D, Chiu H, Cohen-Mansfield J, Dickson D, Dubois B, Duda JE, Feldman H, Gauthier S, Halliday G, Lawlor B, Lippa C, Lopez OL, Carlos Machado J, O'Brien J, Playfer J, Reid W. Dementia with Lewy bodies. Lancet Neurol. 2004;3:19–28. doi: 10.1016/s1474-4422(03)00619-7. [DOI] [PubMed] [Google Scholar]
- Naldini L, Blomer U, Gage FH, Trono D, Verma IM. Efficient transfer, integration, and sustained long-term expression of the transgene in adult rat brains injected with a lentiviral vector. Proc Natl Acad Sci USA. 1996a;93:11382–11388. doi: 10.1073/pnas.93.21.11382. [DOI] [PMC free article] [PubMed] [Google Scholar]
- Naldini L, Blomer U, Gallay P, Ory D, Mulligan R, Gage FH, Verma IM, Trono D. In vivo gene delivery and stable transduction of nondividing cells by a lentiviral vector. Science. 1996b;272:263–267. doi: 10.1126/science.272.5259.263. [DOI] [PubMed] [Google Scholar]
- Oishi K, Kamakura S, Isazawa Y, Yoshimatsu T, Kuida K, Nakafuku M, Masuyama N, Gotoh Y. Notch promotes survival of neural precursor cells via mechanisms distinct from those regulating neurogenesis. Dev Biol. 2004;276:172–184. doi: 10.1016/j.ydbio.2004.08.039. [DOI] [PubMed] [Google Scholar]
- Polymeropoulos M, Lavedan C, Leroy E, Ide S, Dehejia A, Dutra A, Pike B, Root H, Rubenstein J, Boyer R, Stenroos E, Chandrasekharappa S, Athanassiadou A, Papapetropulos T, Johnson W, Lazzarini A, Duvoisin R, Di Iorio G, Golbe L, Nussbaum R. Mutation in the a-synuclein gene identified in families with Parkinson's disease. Science. 1997;276:2045–2047. doi: 10.1126/science.276.5321.2045. [DOI] [PubMed] [Google Scholar]
- Raghavan R, Kruijff L, Sterrenburg MD, Rogers BB, Hladik CL, White CL., 3rd Alpha-synuclein expression in the developing human brain. Pediatr Dev Pathol. 2004;7:506–516. doi: 10.1007/s10024-003-7080-9. [DOI] [PubMed] [Google Scholar]
- Schneider BL, Seehus CR, Capowski EE, Aebischer P, Zhang SC, Svendsen CN. Over-expression of alpha-synuclein in human neural progenitors leads to specific changes in fate and differentiation. Hum Mol Genet. 2007;16:651–666. doi: 10.1093/hmg/ddm008. [DOI] [PubMed] [Google Scholar]
- Scholzke MN, Schwaninger M. Transcriptional regulation of neurogenesis: potential mechanisms in cerebral ischemia. J Mol Med. 2007;85:577–588. doi: 10.1007/s00109-007-0196-z. [DOI] [PubMed] [Google Scholar]
- Singer O, Marr RA, Rockenstein E, Crews L, Coufal NG, Gage FH, Verma IM, Masliah E. Targeting BACE1 with siRNAs ameliorates Alzheimer disease neuropathology in a transgenic model. Nat Neurosci. 2005;8:1343–1349. doi: 10.1038/nn1531. [DOI] [PubMed] [Google Scholar]
- Singleton AB, Farrer M, Johnson J, Singleton A, Hague S, Kachergus J, Hulihan M, Peuralinna T, Dutra A, Nussbaum R, Lincoln S, Crawley A, Hanson M, Maraganore D, Adler C, Cookson MR, Muenter M, Baptista M, Miller D, Blancato J, Hardy J, Gwinn-Hardy K. alpha-Synuclein locus triplication causes Parkinson's disease. Science. 2003;302:841. doi: 10.1126/science.1090278. [DOI] [PubMed] [Google Scholar]
- Spillantini M, Schmidt M, Lee V-Y, Trojanowski J, Jakes R, Goedert M. a-Synuclein in Lewy bodies. Nature. 1997;388:839–840. doi: 10.1038/42166. [DOI] [PubMed] [Google Scholar]
- Stump G, Durrer A, Klein AL, Lutolf S, Suter U, Taylor V. Notch1 and its ligands Delta-like and Jagged are expressed and active in distinct cell populations in the postnatal mouse brain. Mech Dev. 2002;114:153–159. doi: 10.1016/s0925-4773(02)00043-6. [DOI] [PubMed] [Google Scholar]
- Takeda A, Mallory M, Sundsmo M, Honer W, Hansen L, Masliah E. Abnormal accumulation of NACP/a-synuclein in neurodegenerative disorders. Am J Pathol. 1998;152:367–372. [PMC free article] [PubMed] [Google Scholar]
- Tokunaga A, Kohyama J, Yoshida T, Nakao K, Sawamoto K, Okano H. Mapping spatio-temporal activation of Notch signaling during neurogenesis and gliogenesis in the developing mouse brain. J Neurochem. 2004;90:142–154. doi: 10.1111/j.1471-4159.2004.02470.x. [DOI] [PubMed] [Google Scholar]
- Trojanowski J, Lee V. Aggregation of neurofilament and alpha-synuclein proteins in Lewy bodies: implications for pathogenesis of Parkinson disease and Lewy body dementia. Arch Neurol. 1998;55:151–152. doi: 10.1001/archneur.55.2.151. [DOI] [PubMed] [Google Scholar]
- Trojanowski J, Goedert M, Iwatsubo T, Lee V. Fatal attractions: abnormal protein aggregation and neuron death in Parkinson's disease and lewy body dementia. Cell Death Differ. 1998;5:832–837. doi: 10.1038/sj.cdd.4400432. [DOI] [PubMed] [Google Scholar]
- van Praag H, Christie BR, Sejnowski TJ, Gage FH. Running enhances neurogenesis, learning, and long-term potentiation in mice. Proc Natl Acad Sci USA. 1999;96:13427–13431. doi: 10.1073/pnas.96.23.13427. [DOI] [PMC free article] [PubMed] [Google Scholar]
- van Praag H, Schinder AF, Christie BR, Toni N, Palmer TD, Gage FH. Functional neurogenesis in the adult hippocampus. Nature. 2002;415:1030–1034. doi: 10.1038/4151030a. [DOI] [PMC free article] [PubMed] [Google Scholar]
- Vartiainen S, Pehkonen P, Lakso M, Nass R, Wong G. Identification of gene expression changes in transgenic C. elegans overexpressing human alpha-synuclein. Neurobiol Dis. 2006;22:477–486. doi: 10.1016/j.nbd.2005.12.021. [DOI] [PubMed] [Google Scholar]
- Wakabayashi K, Matsumoto K, Takayama K, Yoshimoto M, Takahashi H. NACP, a presynaptic protein, immunoreactivity in Lewy bodies in Parkinson's disease. Neurosci Lett. 1997;239:45–48. doi: 10.1016/s0304-3940(97)00891-4. [DOI] [PubMed] [Google Scholar]
- Williams RW, Rakic P. Three-dimensional counting: an accurate and direct method to estimate numbers of cells in sectioned material. J Comp Neurol. 1988;278:344–352. doi: 10.1002/cne.902780305. [DOI] [PubMed] [Google Scholar]
- Winner B, Lie DC, Rockenstein E, Aigner R, Aigner L, Masliah E, Kuhn HG, Winkler J. Human wild-type alpha-synuclein impairs neurogenesis. J Neuropathol Exp Neurol. 2004;63:1155–1166. doi: 10.1093/jnen/63.11.1155. [DOI] [PubMed] [Google Scholar]
- Winner B, Rockenstein E, Lie DC, Aigner R, Mante M, Bogdahn U, Couillard-Depres S, Masliah E, Winkler J. Mutant alpha-synuclein exacerbates age-related decrease of neurogenesis. Neurobiol Aging. 2007 doi: 10.1016/j.neurobiolaging.2006.12.016. in press. [DOI] [PMC free article] [PubMed] [Google Scholar]
- Yamashita H, Nakamura T, Takahashi T, Nagano Y, Hiji M, Hirabayashi T, Amano T, Yagi T, Sakai N, Kohriyama T, Matsumoto M. Embryonic stem cell-derived neuron models of Parkinson's disease exhibit delayed neuronal death. J Neurochem. 2006;98:45–56. doi: 10.1111/j.1471-4159.2006.03815.x. [DOI] [PubMed] [Google Scholar]