

Abstract
Porphyromonas gingivalis is a Gram-negative anaerobe that populates the subgingival crevice of the mouth. It is known to undergo a transition from its commensal status in healthy individuals to a highly invasive intracellular pathogen in human patients suffering from periodontal disease, where it is often the dominant species of pathogenic bacteria. The application of mass spectrometry-based proteomics to the study of P. gingivalis interactions with model host cell systems, invasion and pathogenicity is reviewed. These studies have evolved from qualitative identifications of small numbers of secreted proteins, using traditional gel-based methods, to quantitative whole cell proteomic studies using multiple dimension capillary HPLC coupled with linear ion trap mass spectrometry. It has become possible to generate a differential readout of protein expression change over the entire P. gingivalis proteome, in a manner analogous to whole genome mRNA arrays. Different strategies have been employed for generating protein level expression ratios from mass spectrometry data, including stable isotope metabolic labeling and most recently, spectral counting methods. A global view of changes in protein modification status remains elusive due to the limitations of existing computational tools for database searching and data mining. Such a view would be desirable for purposes of making global assessments of changes in gene regulation in response to host interactions during the course of adhesion, invasion and internalization. With a complete data matrix consisting of changes in transcription, protein abundance and protein modification during the course of invasion, the search for new protein drug targets would benefit from a more comprehensive understanding of these processes than what could be achieved prior to the advent of systems biology.
Keywords: Porphyromonas gingivalis, gingival epithelial cells, proteomics, posttranslational modification, protein expression, invasion, database search algorithm, review, MudPIT
Diseases that originate at mucous membranes and involve constituents of the normal microbiota are often multifactorial in origin. Nowhere is this more apparent than in the human oral sub-gingival crevice. In this environment, hundreds of bacterial species interact with the multicompartmental periodontal tissues that provide supporting structures for the teeth. Under normal conditions, the host tolerates this microbial burden and the periodontal tissues remain healthy. However ecological shifts can occur that cause the microbiota to acquire a pathogenic potential, which in a susceptible host, will result in tissue destruction with ultimate exfoliation of the teeth. Adaptation of host and microbial cells to the changing ecological parameters involve a coordinated series of regulatory networks that control and fine tune the phenotypic status of the cells. This degree of microbial and host complexity renders investigation of individual virulence factors or host effector molecules insufficient to fully comprehend the molecular basis of health and disease. Rather, emerging technologies for global analysis of transcriptional and protein expression levels are now providing insights into the profiles of mRNA and proteins that characterize states of health or disease. As steps toward applying a systems biology approach to interactions of host and bacteria in the subgingival crevice, transcription microarrays and mass spectrometry-based proteomics have been applied to genome wide studies of P. gingivalis protein expression and host interactions. Here we review developments in proteomics as it has been applied to studies of P. gingivalis in human periodontal disease. A number of reviews have been published in recent years dealing with mass spectrometry-based proteomics and microbiological applications [1–3] and the related topic of posttranslational modifications (PTMs) in lower organisms [4]. A short primer on mass spectrometry-based peptide sequence analysis, the basic technology behind most proteomics studies, has recently been published by Coon and coworkers [5]. The efficient global assessment of PTMs has been restricted by the absence of computational tools for mining large-scale proteomic data sets. Recent developments through 2005 in this area are also described. The ability to determine PTMs is one of the key differences in terms of biological information that separates proteomics data from gene expression studies based on mRNA detection [6]. Within the field of oral biology, the use of proteomic methods has thus far largely been confined to the use of 2D polyacrylamide gel electrophoresis (PAGE) [7, 8]. Okano and coworkers recently applied 2D PAGE and peptide mass mapping [9] to studies of oxidative stress defense mechanisms in P. gingivalis.
Model System for P. gingivalis-host interactions
A bacteria-host cell model has been developed that involves one of the predominant periodontal pathogens, P. gingivalis, and primary cultures of epithelial cells from the gingiva. P. gingivalis rapidly and efficiently invades these gingival epithelial cells (GEC). The internalization process is complete within 15 min and large numbers of bacteria congregate in the perinuclear area. Both the bacteria and the host cells remain viable for extended periods indicating mutual adaptation to their co-habitation [10]. This model has been exploited to determine the proteins of P. gingivalis that are differentially regulated as the organisms make contact with, invade and adapt to the intracellular environment. Proteins that are differentially regulated are important components of the in vivo survival strategy of the organism. Much of the analytical and bioinformatics methodology reviewed here has been implemented in the context of this model [11–13], also using information derived from study of P. aeruginosa secreted virulence factors [14] and protein expression in the methanogen Methanococcus maripaludis [15, 16].
Proteome of P. gingivalis during early stages of host cell interaction
In order to begin studies of P. gingivalis proteins differentially regulated in the context of an epithelial cell environment, the response to soluble factors produced by the GEC [11, 17] was examined. P. gingivalis cells were exposed to conditioned GEC media (media removed from GEC after culture for 48 h: designated conditioned KGM (cKGM) or to fresh KGM media, for 18 h. Technologically, these early studies were within the reach of 2D gel analysis and tandem mass spectrometry (MS/MS, MS2) incorporating data-dependent scanning techniques employed with a single dimension of capillary HPLC [18–21]. An early concern during this period was the ability to apply protein identification techniques based on tandem mass spectrometry to hydrophobic portions of the expressed proteome of P. gingivalis. This problem yielded to rather modest changes in extraction and isolation procedures, coupled with the fortuitous observation that the vast majority of P. gingivalis hydrophobic and membrane bound proteins had sufficient hydrophilic domains to allow digestion with trypsin or a combination of trypsin and Lys-C, without having to take more extreme measures to insure adequate recoveries of proteolytic fragments for each expressed ORF [12]. This has also proven to be the case with proteomic studies of other microbial systems, e.g. M. maripaludis [15, 16] and Agrobacterium tumefaciens (unpublished data). The experimental design involved tandem mass spectrometry coupled to three dimensions of HPLC [12, 13], see Figs. (1–4) and (6). The separation scheme consisted of a single dimension of reversed phase HPLC using conventional columns (2.1 mm i.d.) and a two stage capillary column inlet to the mass spectrometer, based on the MudPIT method described by Yates and coworkers [22, 23], see Fig. (3). 1014 proteins (46% of the total theoretical proteome) were identified in four independent analyses; 479 of these proteins showed evidence of differential expression after exposure of P. gingivalis to either conditioned epithelial cell growth medium or control conditions: i.e., they were only detected under one set of conditions. Moreover, 276 genes annotated as hypothetical were found to encode expressed proteins. These results suggest that adaptation to an epithelial cell environment induces a major shift in the expressed proteome of the organism.
Figure 1.

The different approaches to differentially labeling proteins with stable isotopes are reviewed in [25], and shown here. The preferred approach used for studies of P. gingivalis invasion is metabolic labeling. Copyright American Chemical Society, Anal Chem. 2002, 74, 1650–1657.
Figure 4.

Flow chart describing the order of events when SEQUEST [38, 39] was used in our laboratory to search the P. gingivalis ORF database directly, through 2003. Prior to the ORF search the CID data were normally searched against a large protein database (e.g. Swiss-Prot or nrdb) to identify any non-P. gingivalis proteins that were present. More recently, d2g and add_intensity have been replaced by scripts written in Filemaker Pro.
Figure 6.

Reconstructed semi-quantitation map of the P. gingivalis proteome. Each spot represents an ORF in the Pg database. ORFs are ordered according to their TIGR numbers. KEY: ORFs that were uniquely identified in cKGM (red spots), ORFs that were uniquely identified in KGM (green spots). The red and green spots with thick black circles represent the ORFs that were semi-quantitatively identified; ORFs that were identified in both cKGM and KGM (yellow spots). The yellow spots with thick black circle represent the ORFs that were semi-quantitatively identified in both samples and show no significant difference. The yellow spots with thick red or green circles represent the ORFs that have been semi-quantitatively identified in both samples and are up-regulated in cKGM or KGM respectively. The yellow spots with a thick red or green circle and thin black circle represent the ORFs that were semi-quantitatively identified only in cKGM or KGM respectively. This representation of the proteome, while rich in information, was subsequently abandoned due to its excessive visual complexity.
Figure 3.

Diagram showing the original MudPIT method [23], consisting of a single capillary packed with a strong cation exchange resin (SCX) and and a reversed phase packing (RP). We have adapted this technology to our studies of P. gingivalis and other prokaryotes. Reprinted by permission from Macmillan Publishers Ltd., Nat. Biotechnol. 2001, 19, 242–247.
Proteome of Internalized P. gingivalis
Bacteria (15N labeled, or unlabeled using spectral counting methods described below) were allowed to invade GECs, the GECs with internalized P. gingivalis were collected at different times, lysed, the bacterial cells were collected and their proteins assayed by a direct approach using 2D microcapillary chromatography with tandem mass spectrometry [13, 14 ] for purposes of recovering the widest range of proteolytic fragments, see Fig. (3).
STRATEGIES FOR QUANTITATION, 15N LABELING OF P. GINGIVALIS PROTEINS
One strategy for tracing the fate of P. gingivalis proteins in the GEC environment and acquiring more quantitative data regarding protein expression consists of using stable isotope dilution mass spectrometry, see [24] for a review. See Figs. (1), (5), (7) and the references from which the figures were taken [16, 25]. Uniformly labeled 15N ammonium sulfate and uniformly 15N-labeled peptone nitrogen sources in minimal media have been used to grow P. gingivalis prior to exposure to GEC, but so far without a great deal of success due to poor growth on in-house developed 15N yeast extract. This approach is a common method for producing proteins labeled with heavy isotopes in the structural biological and NMR communities as well. 15N has major advantages over deuterium in that: i, the difference in mass between 14N and 15N is sufficiently slight that changes in metabolism due to kinetic isotope effects should be minimal, ii, the cost of the labeled ammonium sulfate and peptone is modest and iii, deuterium can potentially “scramble” in tandem mass spectrometry experiments in ways that can sometimes complicate interpretation of the data. 15N, incorporated into the polypeptide backbone, is easier to trace in this regard. Breakdown products from P. gingivalis that are incorporated into the metabolism of the GECs can potentially be identified using this approach, if the level of isotopic incorporation is high enough. The incorporation of the 15N label also can allow convenient quantitative comparisons of P. gingivalis proteins that differ in their expression levels. For example, proteins of interest that are upregulated in the GEC environment can be labeled and mixed with a preparation from a control population of P. gingivalis grown under standard conditions. Taking into account the number of cells sampled in each case and the per cent incorporation of the label, one can then calculate the relative expression levels using the methods of quantitative mass spectrometry [24, 25]. This can be accomplished by comparing the peak areas of representative ions from the “heavy” labeled peptide and the “light” unlabeled peptide [18, 26] in a single LC/MS analysis, in a manner conceptually similar to classic small molecule isotope dilution mass spectrometry [24]. See Fig. (5) for an example of such data. It is also possible to generate expression ratios from peak area measurements without the use of stable isotopes, although this type of approach is usually viewed as being less desirable. Non-label peak intensity methods for relative quantitation in proteomics have recently been evaluated by Old and coworkers, in comparison with spectral counting approaches [27].
Figure 5.
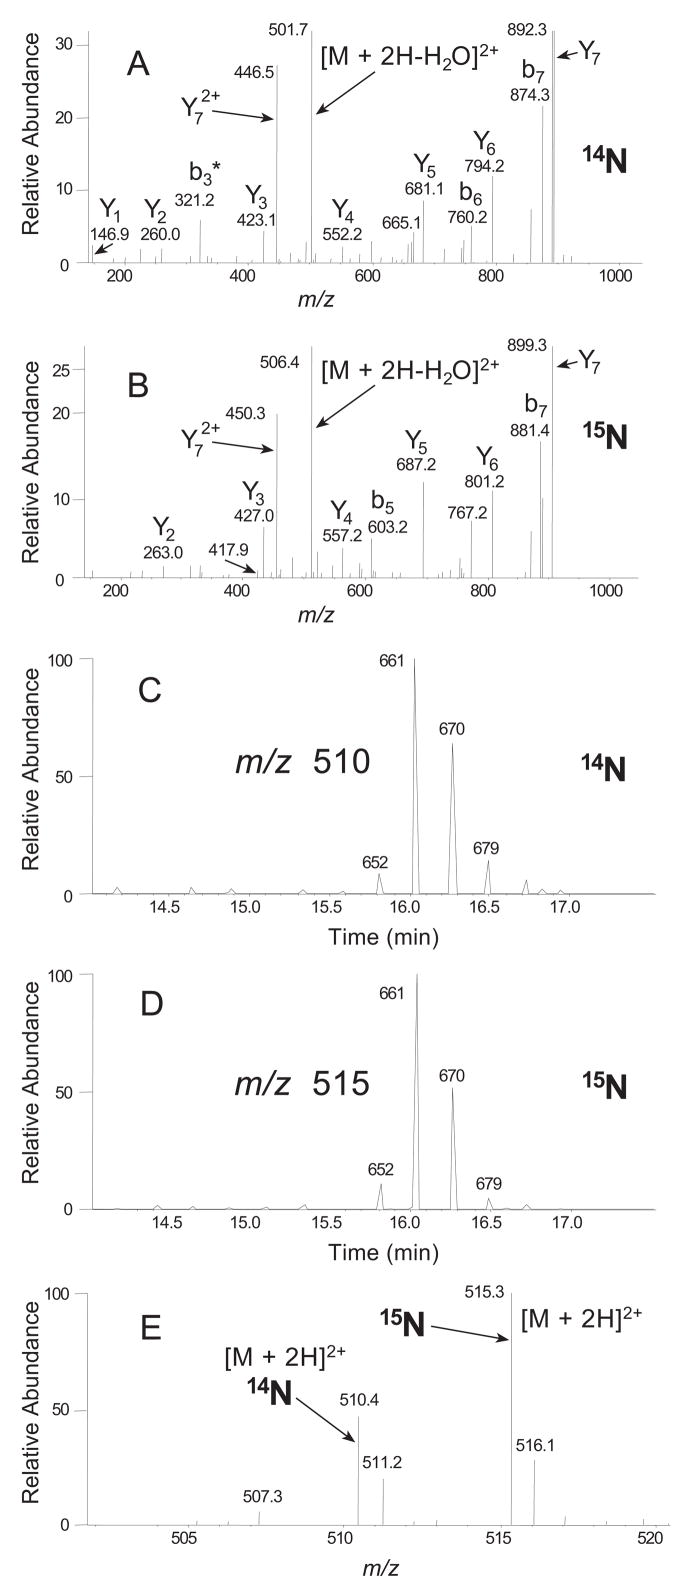
Representative mass spectral data used to identify proteins and calculate expression ratios. Here we illustrate the logic flow used by our quantitation software with a single ratio calculation. Details for the chromatographic, data-dependent mass spectral data acquisition and database searching parameters are given in the original paper cited below. Briefly, after separation of peptides by liquid chromatography, two kinds of mass spectral scans were obtained. The primary (MS1) scans contained intact parent ions from peptide mixtures. The collision-induced dissociation (CID, MS2) scans contained fragmentation ions derived from individual parent ions of the MS1 scans. In addition, single ion chromatograms were generated which plot the intensity of a single MS1 ion vs. time. In the data analysis, peptide sequences belonging to predicted ORFs were identified in both “heavy” 15N and “light” 14N forms. In this example, the identified peptide was KPIEEYLK, a peptide derived from the methanogen M. maripaludis. A, CID spectrum (MS2 scan # 664) from the doubly charged parent ion 510.4 identifying it as 14N KPIEEYLK. B, CID spectrum (MS2 scan #660) from the doubly charged parent ion 515.3 identifying it as 15N KPIEEYLK. The nomenclature used to designate key peptide sequence ions is that of Biemann [85]. Ions labeled y and b indicate sequence-specific ions containing carboxy and amino termini, respectively, and * indicates a loss of water or ammonia. The CID spectra (MS2) were used to generate a table of identified peptides. Each MS2 spectrum was linked by the data system with a specific MS1 ion, i.e. parent ion. Next, single ion chromatograms were checked for each parent ion to determine which MS1 scan contained the maximum signal intensity. C and D, single ion chromatograms of MS1 m/z 510.4+/−0.5 and MS1 m/z 515.3+/−0.5 respectively, showing that both intensities were maximum at scan # 661 (numbers by peaks indicate scan number). Having identified the MS1 scan with the maximum observed intensities of the parent ions, this scan was measured for the intensities of the signals at m/z 510.4 and 515.3. E, MS1 scan # 661 in bar graph format, showing the two signals used in the ratio calculation. The intensities were 5.14 × 10⁷ counts and 2.40 × 10⁷ counts respectively, yielding a “heavy”: “light” ratio of 2.14. In total there were 76 ratios calculated (n1) from heavy-light signal pairs that were acquired from eight unique peptide sequences for this ORF, yielding an average ratio of 2.68. If the average ratio from all measurements +/− the standard deviation did not overlap with a ratio of 1.0, the ratio was judged to indicate a significant difference in expression at the protein level. Reprinted from [16], Molecular and Cellular Proteomics, 2006, 5, 868–881, with permission of the ASBMB.
Figure 7.
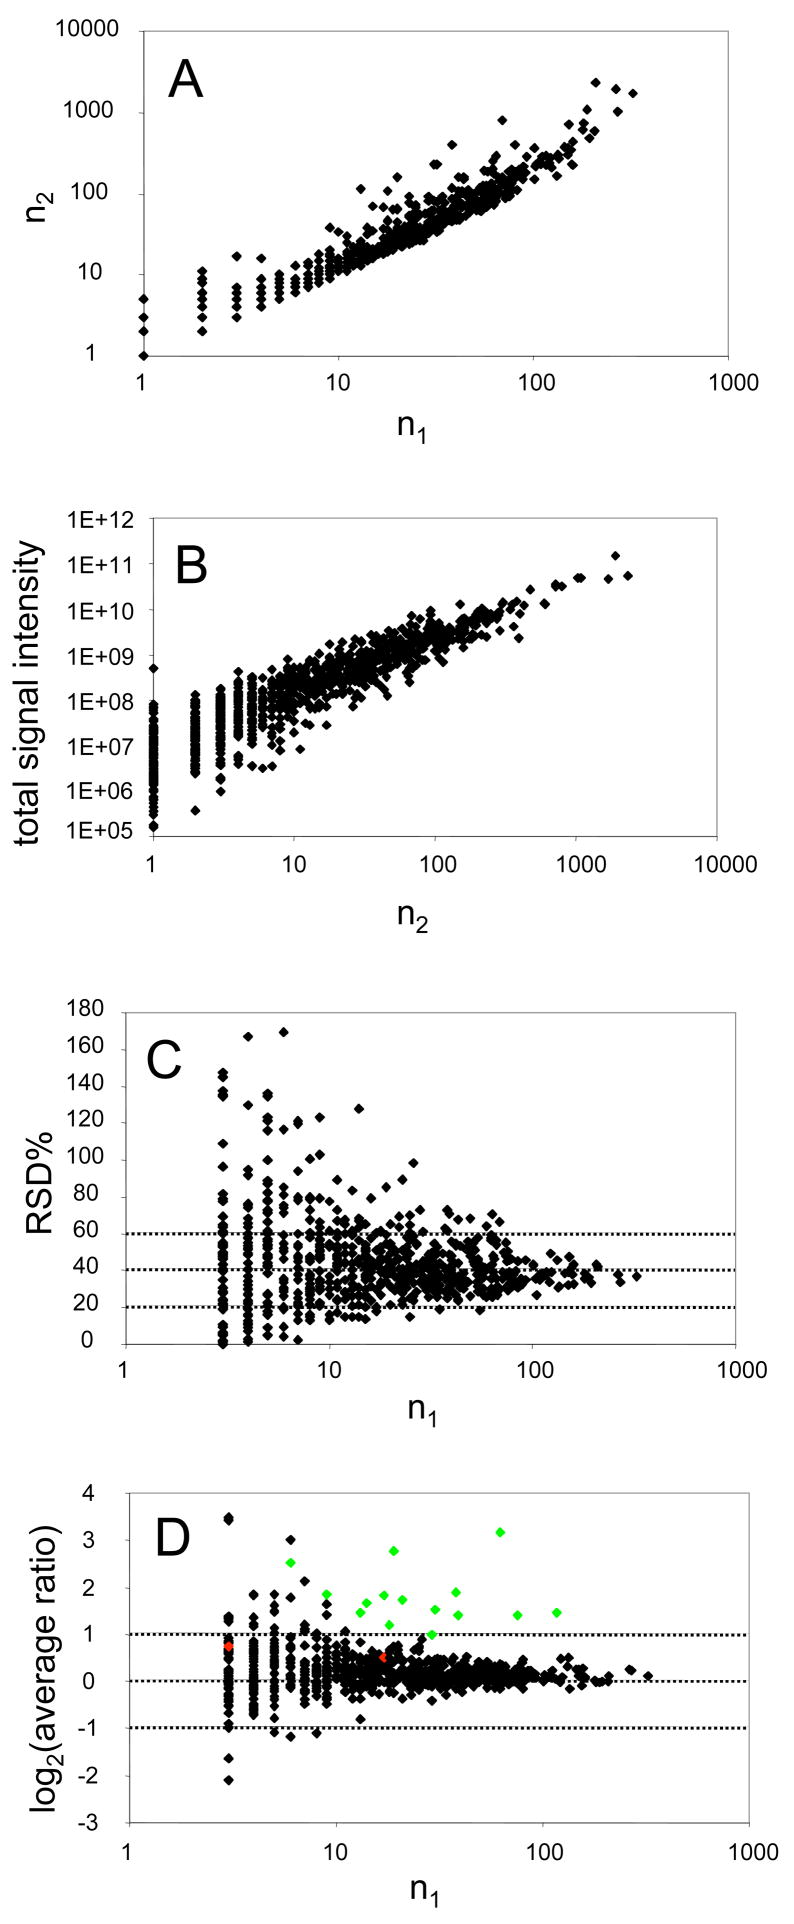
Scatter plots illustrating relationships among total signal intensity, the number of heavy/light isotopic peptide pairs recovered per ORF (n1), the number of redundant peptides recovered per ORF (n2), and the relative standard deviations for the protein level expression ratios calculated for each ORF in a typical whole proteome analysis for a prokaryote. A, correlation of the number of redundant peptides (n2) observed for each protein with the number of peptide pairs (n1) for the same protein. Observations from 939 proteins were used to generate the plot. B, correlation of total signal intensity observed for all peptide “hits” associated with a given ORF and the number of observed redundant peptides (n2). C, relative standard deviation (RSD) of the mean expression ratio for 688 proteins (n1≥3). The average RSD was 44%, which is driven largely by the data points in the upper left. Many of the data points with larger RSD values share a common characteristic, a non-detect in either the numerator or the denominator, e.g. instances in which a strong signal was observed for one condition but only baseline noise or a weak signal was observed for the corresponding peptide in the other condition. At high values of n1 the RSD converges to about 35% in this dataset. D, distribution of the 688 average protein expression ratios (n1≥3) as a function of n1. The 15 data points marked in grey are the genes that are considered as up-regulated in a mutant with respect to the wild-type organism, as determined by both cDNA microarrays and proteomics., The 15 genes for which there was a consensus for up-regulation yielded mean protein expression ratios ≥2. Statistically and biologically significant expression changes stand out more clearly as n1 and n2 go to higher values, see text discussion. Taken from [16], Molecular and Cellular Proteomics, 2006, 5, 868–881, with permission of the ASBMB.
SPECTRAL COUNTING
As an alternative to calculating relative protein expression ratios based on metabolic stable isotope labeling procedures, there are spectral counting methods of the type proposed by Gao, Hefta and coworkers [28]. Spectral counting refers to a process in which the discrete number of peptides observed for a given protein is used to estimate the relative abundance of that protein, as opposed to the strength of the observed signals associated with the protein. There are several variants of this approach in the literature, and the nomenclature is not consistent. Among the other terms used have been “peptide hits” [28], “peptide hits technology” [29], and “spectral sampling” [30]. As suggested by the plots in Fig. (7) and (8), spectral counting has proven to correlate well with other measures of protein abundance [31, 32], and in the case of P. gingivalis, to be highly reproducible in the context of the invasion studies reviewed here, see Fig. (8). The disadvantages of the approach include the lack of a mass label to easily distinguish proteins derived from one set of conditions from the other in a “two state,” array like experiment, and the small number of quantized expression ratios that are calculated for low abundance proteins. The quantized nature of expression ratios based on low abundance peptide counts inevitably take on a limited range of discrete values that are less informative than ratios calculated using isotopic labels, e.g. 15N, introduced metabolically, see Fig. (9). The spectral counting technique bases quantitation on the number of peptides recovered, and generates very similar expression ratios compared to more traditional metabolic labeling stable isotope experiments, provided the proteins are at high enough abundance to avoid the quantized expression ratios mentioned above. Even so, some kind of correction is required for protein molecular weight, because the number of peptides detected from a given protein scales with the size of the protein as well as abundance. Spectral counting approaches have been described as having a wider dynamic range relative to those based on ion chromatographic peak detection, and this suggestion is plausible and worthy of further investigation. Initial impressions of the spectral counting approach, based on data from the methanogen M. maripaludis [16] and the data shown in Figs. (8) and (9) for P. gingivalis, are that it does extends the high end of the dynamic range of quantitative measurements for many proteins. However, at the lower end of the scale, i.e. proteins that produce small numbers of proteolytic fragments or are present at low abundance (see above), spectral count methods perform poorly, with limited quantitative reproducibility. Under these circumstances metabolic labeling procedures yield more reliable data. The number of peptides required from a given protein to achieve a level of reproducibility adequate to detect a two-fold change in expression levels is higher with spectral counting methods than it is with metabolic labeling. From the isotope labeling data shown in Fig. (7D), about 10 heavy-light pairs (n1) were required to reach this level of confidence. From the spectral counting data shown in Fig. (9), that number would appear to be larger, on the order of 50 total peptides. If the results shown in Fig. (9) were perfect, the result would be a flat horizontal line at zero on the y-axis, because the samples being compared are identical replicates. Thus, the data shown can be used as a general yardstick to gauge the level of quantitative reproducibility.
Figure 8.

Scatterplot matrix of the spectral counts of the common 751 proteins from three replicate MudPIT runs of P. gingivalis proteins internalized within GECs. This plot was generated in S-PLUS 6.0 (www.insightful.com). The x-axis, from left to right, shows the protein level spectral counts from run1, run2 and run3; the y-axis, from top to down, are the protein level spectral counts from run1, run2 and run3. Each panel thus contains the scatter plot of the corresponding x- and y-axes. 751 P. gingivalis proteins were always identified in all of the three runs, out of a total of ~900. Protein level spectral counts [28–32] were calculated for each protein in each run by summing the number of redundant CID spectra associated with that protein and that passed the DTASelect [43] filtering criteria. The DTASelect filter criteria we used were: 1.9 for XCorr for singly charged peptide ions; 2.0 for doubly charged; 3.3 for triply charged and fully tryptic peptides. Pearson correlation coefficients were calculated between every two sets of data and noted in each scatterplot panel. As shown in the scatterplots, all three runs showed a high Pearson correlation coefficient with each other. Both the protein identifications and the spectral counts for quantitation were highly reproducible in these datasets (Xia and coworkers, unpublished data). These data were acquired with an LTQ mass spectrometer.
Figure 9.

Scatterplot of log2 of the total spectral counts from replicate analyses (run1, run2) of PG_IHGK (P. gingivalis internalized within GECs) versus log2 of run1/run2 spectral count ratios. The plot shows 987 data points. The ratios are quantized when the spectral count value for both runs goes below a total of about ~3.4 on the log2 scale, which corresponds to a sum of spectral counts from run1 and run2 of approximately 10 peptides. These data were acquired using an LTQ mass spectrometer coupled with a 2D HPLC system as described [16].
SIZE OF CELL PREPARATIONS
In order to have abundant P. gingivalis protein in terms of the sensitivity of proteomic methods (high attomole to low femtomole), preparations were scaled such that in each case recovery was at least 109 P. gingivalis cells per prep. If one makes the simplifying assumptions that the average protein MW is ~40 kDa, with an average copy number of 1000/per cell, 40 tryptic fragments per whole protein, and a highly conservative detection limit of 400 fmol for the mass spectrometer (1.0 μl injection volume, out of 50 μl), then one is looking at approximately 20 ng per each polypeptide in a proteolytic digest. It is common to successfully match peptides with a database using the Thermo-Finnigan LTQ mass spectrometer and other recent vintage instruments with just a few hundred attomoles of peptide, suggesting that many low abundance proteins are being detected by the 3D HPLC direct analysis approach [33, 34].
PROTEINS FROM P. GINGIVALIS CELLS AND HUMAN PROTEINS, TELLING THEM APART
In general, it is possible pick out signals for P. gingivalis proteolytic fragments in a human background up to a limit of about 1 part in 10,000, in excess of what is required in most cases, based on the specificity of the peptide sequence derived from the MS2 mass spectrum. As a general strategy for sorting out laboratory contamination and mammalian proteins from any source, and differentiating those proteins from ORFs in the P. gingivalis genome, the use of larger general protein databases for searching the collision spectra are necessary, as described in greater detail below in the section on computational procedures.
2D OR NOT 2D: GEL ANALYSIS, HPLC AND MASS SPECTROMETRY
Much of the data collection for early proteomics work with P. gingivalis consisted of 2D gel maps coupled with tandem mass spectrometry [11, 12, 17]. The 2D gel electrophoresis protocol was originally described in Qi et al. [35], with minor changes introduced according to the protocols described by Sherman and Kinter [36] and modified as necessary to get the most reproducible results for P. gingivalis. The method of Qi was originally developed for analysis of S. typhimurium proteins, and has also been employed for analysis of proteins from P. aeruginosa and other bacteria. The variations contained in the protocol of Kinter and Sherman have been applied to a variety of cell types. A partially automated method for the mass spectrometric analysis and database searching of spots from 2D polyacrylamide gels was established, based on prior work in the laboratories of Yates [37, 38] and Aebersold [18] and in situ proteolytic digestion protocols developed by Kinter and Sherman [36] at the University of Virginia Medical School. The general topic of 2D gel protein mapping as applied to functional genomics (proteomics) has been reviewed by Wilkins and coauthors [39]. Protein gel spots were digested, typically with trypsin, the peptides were then extracted from the gel. The tryptic fragments were loaded into a reversed-phase microcapillary HPLC column that served as the inlet to an LCQ ion trap mass spectrometer (ThermoFinnigan) which was optimized for peptide sequencing. Product ion mass spectra (see the review [40]) generated by the ion trap were searched automatically against existing database archives using the SEQUEST computer program [37, 38], see Fig. (4), or interpreted manually using the de novo approach developed in Hunt’s laboratory for low energy CID data [41, 42]. The use of tandem mass spectrometry with peptides has as its great strength the fact that there are usually many redundant measurements for each protein to generate sufficient partial sequence information to match with a database, or alternatively, to develop the necessary primers to locate an unknown gene using the tools of molecular biology. When 2D gel maps for P. gingivalis were compared with a MudPIT type approach [12], see Fig. (3), the results were overwhelmingly superior using the multidimensional chromatography method. There exists a broad consensus within the proteomics community that 2D gels are biased towards proteins expressed at high abundance [18]. Also, 2D gels tend to have problems with proteins that are very large (>100 kDa), very acidic or very basic, or that possess extensive hydrophobic domains.
CONNECTING TANDEM MASS SPECTROMETRY WITH THE P. GINGIVALIS GENOME IN A SEMI-AUTOMATED FASHION
The approach diagrammed in Fig. (4) has been used to map uninterpreted peptide CID data back to specific locations in the P. gingivalis genome. In other words, we can take the mass spectral fragmentation pattern derived from a proteolytic fragment and map it back to a specific genome location, thereby establishing the protein’s identity if it is known or an experimentally observed ORF if it is unknown. This process has been described as “reverse genomics” in that it starts with experimentally observed protein and works back to the gene using computational methods, rather than the more familiar tools of molecular biology. Briefly, proteins from P. gingivalis were digested and the fragments analyzed by tandem mass spectrometry as described above. The fragmentation data implicitly contains, within certain limitations, the sequence of the peptide [41]. One limitation is the inability of low energy CID processes in the mass spectrometer to distinguish the amino acid residues Leu and Ile, that share a common residue m/z value of 113.16 (average mass). There are a number of other such redundancies as well [37], but Leu/Ile is perhaps the most significant. The SEQUEST computer program [38, 39] and others reviewed below can then match the fragments with theoretical mass spectra from the genome sequence (as inferred amino acids) that are calculated internally. The matches are then mapped back to the genome using our locally implemented suite of BLAST tools. This scheme has been used for studies with Pseudomonas aeruginosa [14], Mycobacterium tuberculosis, Mycobacterium avium, and others, in addition to studies of P. gingivalis response to the GEC environment. For most purposes, a match with an inferred protein expressing ORF database entry derived from the genome annotation is adequate, as the discovery of ORFs completely missed during the annotation process is a rare event.
COMPUTATIONAL HARDWARE, SOFTWARE AND PROCEDURES
One approach to the genome-as-mass spectral-database problem is to use ORF databases for P. gingivalis provided by TIGR and LANL, with a subset of the nrdb human proteins to enlarge the database for purposes of avoiding statistical problems that can arise from searching large datasets against very small databases, such as the ORF database for P. gingivalis. The putative ORF database is searched by SEQUEST directly, see Fig. (3) and (4). General protein database searches are conducted using Swiss-Prot or nrdb. The P. gingivalis ORF database is based on the latest release of the P. gingivalis genome (www.tigr.org). SEQUEST runs were controlled using the DQS or other queuing systems in early work (Florida State University, Tallahassee, FL, USA), but more recently using the tools provided with the commercial implementation of SEQUEST Cluster (ThermoFinnigan, San Jose, CA). The search results are fed into HTML-based data summary tools such as DTASelect (http://fields.scripps.edu/DTASelect/, [43]) and presented using standard HTML browsers. Searches of several hundred thousand CIDs, the number acquired in a complete MudPIT analysis of P. gingivalis, can take days to search against the entire nrdb database, even using a cluster computer. Although the searches of the P. gingivalis ORF database are relatively quick, the necessary searches to screen for background contamination, GEC host cell proteins, and P. gingivalis proteins not present in the genome of W83 require the use of much larger databases, and search time is proportional to database size. An 8 node, 16 CPU computer cluster [44–46] has drastically reduced the time for searches, thus allowing the facile use of larger databases that allow detection of both P. gingivalis and GEC proteins when the two are mixed, as in the invasion studies. A typical database search of one fraction from the SCX resin used in the 2D capillary HPLC separation, ~300 P. gingivalis derived proteins (as proteolytic digest fragments), against a database consisting of all known P. gingivalis ORFs, the human subset and the bovine subset of the nrdb, takes on the order of 40 minutes. The downloadable database files can be found at ftp://ftp.ncbi.nih.gov/blast/db/FASTA/ and at TIGR.
VISUALIZING TRENDS IN THE DATA
For the 2D gel maps of P. gingivalis proteins, the complexity of the gels are such that most patterns of interest can be addressed by simple inspection of the silver stained gels themselves, or the electronic archives we prepare using Adobe Photoshop and a scanner. Triplicate analyses of the gels were run to monitor their reproducibility. Because mass spectrometry was used as the end readout, and 2D gels are not reproducible with respect to subtle changes in migration, most attention was focused on the mass spectrometry readout. These can be tabulated electronically with hot links to the putative assignment in the P. gingivalis genome or other database on our local servers, homology search results, and any other annotation judged to be of interest. This task is now largely performed by two software programs written by David Tabb (now at Vanderbilt University) in the Yates laboratory, DTASelect and Contrast [43], and two programs written in-house, d2g and add-intensity, see Figs. (4) and (6). These programs allow the hot links and the tabulation of rank-ordered hits according to a common set of criteria over many data sets, limited only by memory size and CPU speed. What this does is create an HTML-based list of high scoring matches and (or) quantitation information for positive hits that in turn links back to the P. gingivalis genome or other source of electronic information about the gene. This is shown visually as a reconstructed protein array, see Fig. (6). Table 1 represents a summary by protein class from an experiment performed in the course of developing a 3D HPLC assay for the P. gingivalis proteome. Although it is not realistic to achieve the ideal of measuring every single protein expressed by the organism under a particular set of conditions, it should be possible to measure most of them. It is reasonable to suggest that the MudPIT assay measures a sufficient number of proteolytic fragments to identify on the order of 1,000 P. gingivalis proteins from a given preparation [12, 13], see Figs. (6) and (8) and Table 1 below. The most recent estimates from TIGR are that P. gingivalis W83 contains about 2,227 protein encoding ORFs. The number expressed under any given regulatory state is likely to be somewhat smaller.
Table 1.
PG ORFs identified were categorized to 20 functional classes according to TIGR class definitions.
| Functional Class | Databasea | cKGMb | KGMc | Commond |
|---|---|---|---|---|
| amino acid biosynthesis | 18 | 12 (66.7%) | 9 (50.0%) | 6 (33.3%) |
| biosynthesis of cofactors, prosthetic groups, and carriers | 74 | 41 (55.4%) | 39 (52.7%) | 29 (39.2%) |
| cell envelope | 119 | 68 (57.1%) | 70 (58.8%) | 48 (40.3%) |
| cellular processes | 50 | 33 (66.0%) | 36 (72.0%) | 28 (56.0%) |
| central intermediary metabolism | 24 | 13 (54.2%) | 15 (62.5%) | 10 (41.7%) |
| DNA metabolism | 75 | 50 (66.7%) | 57 (76.0%) | 48 (64.0%) |
| disrupted reading frame | 41 | 12 (29.3%) | 10 (24.4%) | 9 (22.0%) |
| energy metabolism | 126 | 102 (81.0%) | 97 (77.0%) | 91 (72.2%) |
| fatty acid and phospholipid metabolism | 16 | 12 (75.0%) | 12 (75.0%) | 11 (68.8%) |
| hypothetical proteins-conserved | 197 | 102 (51.8%) | 93 (47.2%) | 64 (32.5%) |
| hypothetical proteins | 808 | 187 (23.1%) | 181 (22.4%) | 122 (15.1%) |
| other categories | 133 | 65 (48.9%) | 77 (57.9%) | 57 (42.9%) |
| protein fate | 75 | 60 (80.0%) | 56 (74.7%) | 49 (65.3%) |
| protein synthesis | 114 | 89 (78.1%) | 84 (73.7%) | 77 (67.5%) |
| purines, pyrimidines, nucleosides and nucleotides | 44 | 27 (61.4%) | 31 (70.5%) | 25 (56.8%) |
| regulatory functions | 44 | 17 (38.6%) | 17 (38.6%) | 7 (15.9%) |
| signal transduction | 12 | 10 (83.3%) | 9 (75.0%) | 7 (58.3%) |
| transcription | 32 | 22 (68.8%) | 20 (62.5%) | 18 (56.3%) |
| transport and binding proteins | 110 | 70 (63.6%) | 53 (48.2%) | 76 (69.1%) |
| unknown function | 198 | 115 (58.1%) | 115 (58.1%) | 88 (44.4%) |
Number of ORFs that consist of a given functional class. (Some proteins may belong to more than one functional class)
Number of ORFs that were identified in cKGM sample for a given functional class.
Number of ORFs that were identified in KGM sample for a given functional class.
Number of ORFs that were identified in both cKGM and KGM samples for a given functional class.
Another issue critical for understanding the strengths and limits of the protein-centric approach is the difference in complexity between identifying a protein in a database (often straightforward, requires a small number of partial sequences) and the work required for further characterization of a given protein of interest. Detailed characterization of posttranslational modifications, multi-protein complexes, etc. is still painstakingly slow and labor intensive. For proteins associated with virulence or invasion that are not coded for in the W83 (database strain) P. gingivalis genome, one is left with the options of doing what are essentially homology searches or using de novo peptide sequencing to develop primers to search for the unknown genes using molecular biology. This is a limitation likely to arise in a number of studies as W83 is poorly invasive, and is deficient in expression of both the long and short fimbriae. Most investigations of P. gingivalis pathogenicity thus require the use of alternative strains. Although no plasmids have thus far been associated with P. gingivalis in its native state, our methods are sensitive enough to detect such extrachromosomal genes if they are expressed. Much work remains to automate many of the more tedious aspects of proteomics studies, most glaringly at the data reduction and mining stages. Advances in robotics and automated sample preparation are leading the way towards dealing with the “front end” sample handling and chemistry issues. The problems of data reduction and interpretation are more complex, and represent major areas of effort by a large number of research groups. Functional genomics with respect to data reduction strategies for protein structure and function has been reviewed by Gerstein and Jansen [47]. Although this review was written with a transcription focus, the ideas expressed are highly relevant to the proteomics world. Perhaps the most significant unmet need is the lack of database search software that can reliably detect posttranslational modifications (PTMs) on a global scale, a topic of great interest for those using proteomic methods in the context of host-pathogen interactions and studies of global gene regulation. Recent progress in this area is reviewed in the following section.
Mass Spectrometry-based proteomics and the challenge of search strategies for posttranslational modifications
Peptide sequencing and database search algorithms for proteomics that use tandem mass spectrometry for inputs fall into three categories, depending on what they assume about the unknown protein. Database search algorithms assume that the protein to be identified belongs to a given database [37], usually derived by transcribing DNA sequences into amino acid sequences. Under this paradigm, one generates a theoretical spectrum for each candidate peptide, which is compared with the observed spectrum of the unknown peptide. The closest matches are then reported, together with scores that indicate their quality. Matching partial sequences to a database [48, 49], when only a portion of a peptide collision spectrum can be matched to a database sequence, is a second type of approach. Sometimes the unknown peptide does not match any sequence in the database. This can happen because of small differences at the genome level (mutations, polymorphisms), or because of errors in genome sequencing and in annotating all protein coding genes (this is particularly difficult in the presence of alternative splice sites [50]). Another reason for mismatch is PTMs, as in phosphorylation, acylation, etc. They do not change the protein amino acid sequence, but change the apparent mass of specific amino acid residues, which, in turn, produces dramatic shifts in the observed spectrum. Hence the previous approach of matching a theoretical spectrum derived from a database of transcribed DNA with an observed spectrum will fail. One solution to this problem is to use programs like GutenTag [49] to extract possible partial sequences, or tags from the observed spectrum, then search the database for peptides that contain a sufficient number of tags made up of ordinary amino acids. Thirdly, de novo sequencing aims to reconstruct as much as possible of the sequence from the observed spectrum only, without referring to any database. Globally mining whole proteome datasets from P. gingivalis and other microbes for PTMs is not feasible at present, but remains an active area of research. Future work should focus on database matching of both complete and partial sequences, because this approach is more computationally tractable for the large-scale analysis of proteomes and microbial communities. De novo approaches do not appear to be practical on this scale at the present time.
The database search systems in widest use are SEQUEST [37, 38] and Mascot [51]. The matching score of a theoretical spectrum to the observed one is computed by a function derived heuristically and validated empirically. In addition to the matching score, both algorithms provide some protection against spurious matches and false positives. Such a measure is necessary in any peptide identification algorithm. It is a normalized cross-correlation difference for SEQUEST and a p-value derived from a simple probabilistic model for Mascot. Other algorithms that use simple, empirically derived probabilistic models are OMSSA [52], and the work of Havilio and coworkers [53]. ProbID [54] uses a simplified probabilistic scoring where every m/z peak is counted independently of other m/z peaks. Several authors have attempted to use Machine Learning methods like decision trees [55] and radial basis functions to leverage additional information provided by the peak intensities.
The programs SCOPE [56], OLAV [57] and MassLynx [58] use a probabilistic fragmentation model to produce the theoretical spectrum. The methods using partial sequence tags like PeptideSearch [48] and GutenTag [49] combine a phase of extracting small subsequences from the spectrum (the tags) with a data base retrieval and scoring phase. These methods can be made very efficient and can also tolerate small numbers (1 or 2) of PTMs or substitutions. Adaptations of the database search methods that handle small variations with respect to the database include SALSA [59, 60], which accepts partial sequences and other information supplied by the user, PEDANTA [61] which can accommodate up to two mass shifts. We also mention FindMod [62], which will identify a protein with up to 3 PTMs from its mass-fingerprint spectrum. A recent method that can in theory handle a significantly larger number of PTMs comes from Pevzner’s group [63]. The most notable de novo sequencing methods use the “sequence graph” of Bartels [64]. The best known are Lutefisk [65, 66] and Peaks [67]. They can handle only a small number, three or less, of PTMs or substitutions. Pepnovo [68] uses a probabilistic fragmentation model to obtain scores for the nodes in the spectrum graph. Fischer [69] recently proposed a Hidden Markov Model (HMM) approach. This method is limited by the number of possible states in the HMM and so it cannot both incorporate more precise fragmentation models and handle PTMs in its present stage of development. According to the recently published RESID [70] database of known PTMs, the average peptide can be modified in 10–100 different ways. It is not feasible to try them all explicitly. Any program aiming at detecting PTMs globally will need to overcome this inherent complexity.
THE CHALLENGE OF SINGLE SCAN SPECTRA
Proteomic studies using an LTQ linear ion trap mass spectrometer [71, 72] now often use single scan mass spectra for rapid throughput. In contrast to spectra that are obtained by averaging over a several scans of the m/z range selected, single scan spectra have more variability. Peak intensities in particular vary widely, and often peaks are missing [44]. A quantitative evaluation of the noise in the peak intensities for LTQ single-scan spectra [34] supports these observations. For increased accuracy of identification, the information in the peak intensities should not be ignored, nor should low intensity mass peaks. These sources of information being noisy, their contribution must be weighted with care, and fused with other weak sources. A study of the stochastic variation of the peak locations and intensities of LTQ single scan spectra [34] produced a probabilistic model that will be used in a future search algorithm optimized for the global identification of PTMs in P. gingivalis and other prokaryotes. Typical spectra from current instruments contain many more peaks than the theoretical spectra, due mainly to the incompleteness of existing fragmentation models. Thus, even in the case of a successful match, only a fraction of the peaks are identified and the more peaks, the slower the matching. Conversely, a “false match” can occur because of spurious matches with the theoretical spectrum. The probability of a random match was estimated to be as high as 23% in one study [73]. The effect is a systematic increase of all matching scores with the number of peaks. Peptides with more amino acids will have theoretical spectra with more peaks. Consequently, the matching scores will tend to favor longer peptides. The common remedy is to apply a correction that discounts random matches [37, 68].
INSPECT AND PTMs
InsPecT [63] is a program that considers PTMs and builds upon the innovations described in [56] and by others. The recent InsPecT algorithm performs database peptide identification in the presence of a small number of PTMs (up to 4 in the published paper) out of a given set (of up to 10 at the time of this writing). The steps of the algorithm can be summarized as: a probabilistic fragmentation model, tag generation by the de novo algorithm of [68], with an elegant adaptation for the presence of PTMs [74], selecting candidate data base sequences based on tags and a mass “spectrum graph” dynamic programming [75] matching algorithm that also locates the PTMs, scored using a probabilistic model and score adjustment (computing p-values). The InsPecT program is being evaluated for global PTM analysis of P. gingivalis under different regulatory states in the context of interactions with GECs.
The challenge of reproducibility
Proteomics in general has reproducibility problems, particularly with respect to more ambitious whole proteome or other large-scale analyses that have become more common in the world of systems biology. The type of “bottom up” proteomics. i.e. digesting the whole cell and reassembling the proteins computationally from peptide tandem MS data, applied to P. gingivalis and other prokaryotes lacks reproducibility when applied to cells from higher organisms, but often works well in the hands of specialists for organisms with small genomes and relatively uncomplicated gene regulation. These problems extend to both qualitative reproducibility in terms of correct protein identification and quantitative accuracy of expression measures, based primarily on signal intensities observed for proteolytic fragments, that are in turn used to infer relative abundance information regarding the protein from its constitutive fragments. A significant contributing factor to these problems is the relative ease with which such data can be generated relative to past years. This tends to promote a lack of understanding with respect to “what is underneath the hood” in such complex experiments and an uncritical approach to instrumental output. The fundamental data structure (a CID spectrum derived from a precursor ion isolated from thousands of other precursors), the way that the microbe was isolated and the proteins extracted, the HPLC technology used to separate a complex proteolysate into its individual peptides, the mass spectrometer and the database searching tools employed, all require a fairly sophisticated level of understanding in order to generate results that are biologically meaningful and reproducible. The tools are rapidly maturing in terms of ease of use, to the point that workers unable to interpret the mass spec readout in a critical manner can generate poor data that to the naive eye is indistinguishable from that generated by an expert. Validation, as well as better training, is a key to minimizing such problems. Global proteomics studies work best when conceived from the beginning in the broader context of systems biology and functional genomics, where all available tools are brought to focus on the problem at hand. It is necessary to make extensive use of transcription arrays, real-time quantitative PCR, functional assays, bioinformatics and other appropriate tools to verify biologically significant findings in whole microbial proteome assays. As suggested by the results shown in Panels C and D of Fig. (7), it is wise to be skeptical of protein level expression ratios based on a small number of peptides measured for a given ORF. Rather than focus on more sophisticated statistical approaches applied to data that is fundamentally weak and technically noisy, an alternative emphasis is to improve coverage of the proteome. The ultimate goal would be to recover all peptides from all proteins in the prokaryote under investigation, thereby giving a complete map of the proteome based on complete information. This is not achievable at present with any technology, but it nonetheless suggests the direction the field needs to take. Cataloging this volume of data is not as difficult as it might seem at first, and terabyte disk storage devices are now low cost commodity items. Attempts to substitute a smaller number of precursor ion measurements (MS1 only) made at very high resolution have yet to demonstrate practical utility for the type of large-scale experiments reviewed here. As discussed in [16], regardless of the particular strategy employed, attempts to infer protein expression levels based on one, two, or even four or five, peptide pairs comparing two conditions are not likely to be successful. The results shown in Fig. (7) are indicative of a general phenomenon, not limited to the particular study from which the data was taken. This is a conservative view based on data from biologically based studies of whole microbial proteomes, as opposed to less complex test samples that inevitably yield more impressive appearing figures of merit. Although expression ratios based on fewer than roughly seven or eight peptide pairs can yield good precision as defined by a standard deviation, experience has shown that such data tends not to be validated by further investigation. As coverage increases beyond seven or eight pairs, true expression changes tend to stand out from the many sources of noise as the number of pairs used in the calculation increases. This relationship is visualized by contrasting the grey data points (validated by more than one method) with the others (black) in Fig. (7). The LTQ mass spectrometer has dramatically increased the reproducibility of unit resolution proteomics data, as illustrated by the statistical analysis of three replicate MudPIT runs for internalized P. gingivalis proteins shown in Fig. (8). This is due primarily to higher throughput [33, 34] and better signal/noise relative to older instrumentation.
Biological relevance
Proteomic analyses have the potential to uncover a large number of differentially regulated proteins. The question then arises of how to interpret the data in a biologically meaningful way. For eukaryotic systems there are several ontology tools, whereby biological pathways are populated with differentially regulated gene or proteins and pathways that are significantly modulated can then be studied in more detail. This provides a convenient way to focus on a subset of the data that is consistent and likely to be biologically relevant. Computational tools that have a history with prokaryotic biology are those associated with the BioCyc database collection [76]. At the present time the level of curation required to use BioCyc for display of whole cell differential proteomics data has been achieved for only a few microorganisms, but this is changing rapidly as more scientists participate in the curation process. However, as a short term solution, given the relatively small size of prokaryotic genomes it is possible to take an empirical approach and assess the relevance of individual regulated proteins in the context of the overall expression pattern. For organisms such as P. gingivalis, that have limited genetic tools, the next step is essentially back to “hand to hand combat’ with individual genes through the use of gene mutations, quantitative RT-PCR and promoter-reporter systems. For example in the proteomic analysis of P. gingivalis invasion, manual inspection of the differentially regulated protein set revealed that a series of proteins of the Clp family, ClpC, ClpP and ClpX, were upregulated in cKGM. In Listeria, the ClpC ATPase is required for adhesion and invasion of host cells and the protein modulates the expression of other virulence factors including InlA and InlB [77]. ClpC also promotes the early escape of Listeria from the phagosomal compartment of macrophages [78]. The serine protease ClpP is involved in the rapid adaptive response of Listeria within macrophages [79]. This led to speculation that the Clp proteins may play an important role in P. gingivalis invasion and intracellular survival. As a representative of the Clp system, a ClpP deficient mutant was constructed in P. gingivalis and tested for association with gingival epithelial cells. In an antibiotic protection assay, invasion/intracellular survival of the clpP mutant was decreased by approximately 50% in comparison to the parent [13]. Immunofluorescence microscopy revealed that fewer mutant cells located intracellularly compared to the parent and that fewer epithelial cells contained mutant P. gingivalis above the threshold detection level [13]. This defect was not the result of reduced adhesion to the epithelial cells as mutant and parent showed similar adhesive capacities. Thus, the clpP mutant has a diminished invasive, but not adhesive, capacity for GEC. In this manner proteomic analysis has provide the basis for further insight into the biology of the organism. A logical next step would be the use of global proteomic approaches conceived specifically with the idea of identifying new drug targets for antimicrobial therapy. However, at least in terms of antimicrobial therapies, progress will be challenging. For example, Becker and coworkers [80] recently surveyed 700 Salmonella enterica metabolic enzymes as expressed in vivo within a model host system, and came to the conclusion that of the subset of genes that played a role in virulence, almost none were likely to yield new targets for antibiotics. This study emphasized a further subset of enzymes associated with virulence that were also conserved across other human pathogens. The obvious candidates were either already subject to inhibition by known antimicrobials or had been rejected for various reasons as candidates for further development. Despite the often noted lack of promising targets for antimicrobial therapy [81, 82], independent of the experimental means used to identify them, the authors note that a small number of enzymes, although previously known, have not been studied sufficiently to draw any firm conclusions regarding their suitability for further evaluation as drug targets. Most ominously, this last group had the highest level of sequence similarity with human metabolic enzymes, suggesting a high probability of undesirable side effects by any inhibitors that might be developed for therapeutic applications. Nonetheless, organisms that have been less well studied than Salmonella enterica in terms of their virulence properties may yield more promising leads.
Conclusions and future research directions
It is expected that the demand for high throughput protein expression applications at the level of measuring actual protein will only continue to rise. The long-term goal of globally describing the response of P. gingivalis to its human host during the various stages of invasion and internalization requires a complete dataset, including transcription measurements for each gene that is differentially expressed, quantitative protein measurements and differential measurement of the modification status of each protein. From this extensive data matrix one can in theory derive most of the important regulatory relationships that govern response to the host environment. Transcription array technology has matured to the point that such experiments are feasible. Proteomics has developed more slowly and high coverage quantitative analysis on a global scale is non-routine, even for prokaryotes with relatively small numbers of protein encoding ORFs, such as P. gingivalis. The global differential analysis of PTMs associated with gene regulation cannot be done in a reproducible or complete fashion at present, but progress in this direction continues at a rapid pace from both analytical and computational/bioinformatic points of view. The global assessment of PTMs and investigation of spectral counting methods as an alternative to metabolic labeling for quantitation are active areas of investigation from both perspectives.
Interest in the emerging field of community proteomics will likely be the driver for much future development work, both in terms of analytical methods and software. The improved quantitative analysis of particular gene products in the context of community proteomics will also be a priority. As the research emphasis expands to microbial communities, the questions being addressed by proteomics will broaden to describe quantitative and qualitative changes to the composition of oral biofilms that parallel the progression from health to disease. In other words, how much of a given organism or phylotype is present relative to all other organisms, rather than how much of a given protein is being expressed by a single organism. At the level of global proteomic studies of tractable individual prokaryotes, such as P. gingivalis, software is badly needed that has been written from the ground up to accept MudPIT data and genomic databases as inputs, and to provide as outputs a probabilistic assessment as to whether a protein encoding ORF is being expressed, the protein’s modification status, and its degree of expression relative to the same ORF expressed under a different set of conditions or multiple conditions. The present generation of software for post acquisition mass spectral data processing of whole cell proteolytic digests has a decidedly “peptide centric” and analytical chemical frame of reference, and is thus cumbersome for global studies. This typically involves requiring a great deal of in-house programming and the use of many individual software programs to yield a biologically useful dataset. The mass spectrometer and associated separations technology has evolved beyond the ability of existing software tools to easily or efficiently convert this mountain of raw data into useful information. The status quo at present is for each specialist lab in the field to patch together their own solution--standardization, even in terms of data formats, is almost nonexistent, although there is a clear trend towards XML-based file formats (http://www.w3.org/XML/).
The probability of actually detecting new drug targets based on this type of research is dependent first of all on generating complete and reproducible datasets, a challenge that only recently has met with real success for any prokaryote. It has not been done for a human host cell proteome and is not likely to be without major progress in several areas. Secondly, it depends on recognizing significance through the use of better data mining procedures that can allow the informed biologist, the person who has the necessary background and experience with a particular organism to recognize an important result, to organize and view the data in more useful ways. Tools for the visualization of regulatory relationships among genes are evolving, but at present few such tools easily accept proteomic datasets as inputs, and none of them has found widespread acceptance for this purpose. Most successful applications of proteomics technology to date aimed specifically at drug targets have generally been focused on a subset of proteins rather than the entire proteome of a cell or tissue. Also, the proteomics technology was successfully integrated into the broader range of experimental tools commonly used in drug discovery and pharmacology, where protein mass spectrometry has been an established method among many for a number of years before the term proteomics was coined in 1994. One recent example is the identification of specific enzymes targeted by Ezetimibe, an inhibitor of cholesterol transport in the intestine that is used clinically to reduce blood serum cholesterol levels [83, 84].
Figure 2.

Processing of P. gingivalis whole cell protein extracts to yield tryptic fragments prior to analysis using 2D capillary HPLC and tandem mass spectrometry (MudPIT).
Acknowledgments
We thank Yoonsuk Park, Özlem Yilmaz, Weibin Chen, Yi Zhang, Tiansong Wang, Qunhua Li, Fred Taub and Kobi Alfandari for their contributions to the research reviewed in this paper. Funding was provided under DE11111 (R. J. L.) and DE14372 (M. H.) from the NIH NIDCR. Additional funding was provided under Microbial Cell Project DE-FG03-01ER15252 from the DOE. We thank Gundula Bosch, John Leigh, Erik Hendrickson and Mike MacCoss for their insights and valuable discussion.
ABBREVIATIONS
- 2D
two dimensional
- 3D
three dimensional
- CID
collision-induced dissociation
- GEC
gingival epithelial cells
- HPLC
high performance liquid chromatography
- HMM
hidden Markov model
- KGM
keratinocyte growth medium
- LANL
Los Alamos National Laboratory
- MS2
second dimension of mass spectrometry
- MS/MS
tandem mass spectrometry
- MudPIT
multidimensional protein identification technology
- nrdb
non-redundant database
- m/z
mass-to-charge ratio
- ORF
open reading frame
- ORNL
Oak Ridge National Laboratory
- PAGE
polyacrylamide gel electrophoresis
- PCR
polymerase chain reaction
- PTM
posttranslational modification
- SCX
strong cation exchange
- TIGR
The Institute for Genomic Research
- XML
Extensible Markup Language
References
- 1.Washburn MP, Yates JR., III Curr Opin Microbiol. 2000;3:292. doi: 10.1016/s1369-5274(00)00092-8. [DOI] [PubMed] [Google Scholar]
- 2.Brötz-Oesterhelt H, Bandow JE, Labischinski H. Mass Spectrom Rev. 2005;24:549. doi: 10.1002/mas.20030. [DOI] [PubMed] [Google Scholar]
- 3.Pandey A, Mann M. Nature. 2000;405:837. doi: 10.1038/35015709. [DOI] [PubMed] [Google Scholar]
- 4.Eichler J, Adams MWW. Microbiol Molec Biol Rev. 2005;69:393. doi: 10.1128/MMBR.69.3.393-425.2005. [DOI] [PMC free article] [PubMed] [Google Scholar]
- 5.Coon JJ, Syka JEP, Shabanowitz J, Hunt DF. BioTechniques. 2005;38:519. doi: 10.2144/05384TE01. [DOI] [PubMed] [Google Scholar]
- 6.Hatzimanikatis V, Lee KH. Metab Eng. 1999;1:275. doi: 10.1006/mben.1999.0115. [DOI] [PubMed] [Google Scholar]
- 7.Perea EJ. Med Oral Patol Oral Cir Bucal. 2004;9:1. [PubMed] [Google Scholar]
- 8.Macarthur DJ, Jacques NA. J Dent Res. 2003;82:870. doi: 10.1177/154405910308201105. [DOI] [PubMed] [Google Scholar]
- 9.Okano S, Shibata Y, Shiroza T, Abiko Y. Proteomics. 2006;6:251. doi: 10.1002/pmic.200401338. [DOI] [PubMed] [Google Scholar]
- 10.Lamont RJ, Chan A, Belton CM, Izutsu KT, Vasel D, Weinberg A. Infect Immun. 1995;63:3878. doi: 10.1128/iai.63.10.3878-3885.1995. [DOI] [PMC free article] [PubMed] [Google Scholar]
- 11.Chen W, Laidig KE, Park Y, Park K, Yates JR, III, Lamont RJ, Hackett M. The Analyst. 2001;126:52. doi: 10.1039/b008012h. [DOI] [PubMed] [Google Scholar]
- 12.Wang T, Zhang Y, Chen W, Park Y, Lamont RJ, Hackett M. The Analyst. 2002;127:1450. doi: 10.1039/b206157k. [DOI] [PMC free article] [PubMed] [Google Scholar]
- 13.Zhang Y, Wang T, Chen W, Yilmaz O, Park Y, Jung IL, Lamont RJ, Hackett M. Proteomics. 2005;5:198. doi: 10.1002/pmic.200400922. [DOI] [PMC free article] [PubMed] [Google Scholar]
- 14.Stonehouse MJ, Cota-Gomez A, Parker SK, Martin WE, Hankin JA, Murphy RC, Chen W, Hackett M, Vasil AI, Vasil ML. Mol Microbiol. 2002;46:661. doi: 10.1046/j.1365-2958.2002.03194.x. [DOI] [PubMed] [Google Scholar]
- 15.Porat I, Kim W, Hendrickson EL, Xia Q, Zhang Y, Wang T, Taub F, Moore BC, Anderson IJ, Hackett M, Leigh JA, Whitman WB. J Bacteriol. 2006;188:1373. doi: 10.1128/JB.188.4.1373-1380.2006. [DOI] [PMC free article] [PubMed] [Google Scholar]
- 16.Xia Q, Hendrickson EL, Zhang Y, Wang T, Taub F, Moore BC, Porat I, Whitman WB, Hackett M, Leigh JA. Molec Cell Proteomics. 2006;5:868. doi: 10.1074/mcp.M500369-MCP200. [DOI] [PMC free article] [PubMed] [Google Scholar]
- 17.Park Y, Simionato MR, Sekiya K, Murakami DJ, Chen W, Hackett M, Yoshimura F, Demuth DM, Lamont RJ. Infect Immunn. 2005;73:3983. doi: 10.1128/IAI.73.7.3983-3989.2005. [DOI] [PMC free article] [PubMed] [Google Scholar]
- 18.Aebersold R, Rist B, Gygi SP. Ann NY Acad Sci. 2000;919:33. doi: 10.1111/j.1749-6632.2000.tb06865.x. [DOI] [PubMed] [Google Scholar]
- 19.Ducret A, Van Oostveen I, Eng JK, Yates JR, Aebersold R. Protein Sci. 1998;7:706. doi: 10.1002/pro.5560070320. [DOI] [PMC free article] [PubMed] [Google Scholar]
- 20.Washburn MP, Yates JR., III Curr Opin Microbiol. 2000;3:292. doi: 10.1016/s1369-5274(00)00092-8. [DOI] [PubMed] [Google Scholar]
- 21.Wang H, Lim KB, Lawrence RF, Howald WN, Taylor JA, Ericsson LH, Walsh KA, Hackett M. Anal Biochem. 1997;250:162. doi: 10.1006/abio.1997.2214. [DOI] [PubMed] [Google Scholar]
- 22.Link AJ, Eng J, Schieltz DM, Carmack E, Mize GJ, Morris DR, Garvik BM, Yates JR., III Nature Biotech. 1999;17:676. doi: 10.1038/10890. [DOI] [PubMed] [Google Scholar]
- 23.Washburn MP, Wolters D, Yates JR., III Nature Biotech. 2001;19:242. doi: 10.1038/85686. [DOI] [PubMed] [Google Scholar]
- 24.Zhu X, Desiderio DM. Mass Spectrom Rev. 1996;15:213. doi: 10.1002/(SICI)1098-2787(1996)15:4<213::AID-MAS1>3.0.CO;2-L. [DOI] [PubMed] [Google Scholar]
- 25.Washburn MP, Ulaszek R, Deciu C, Schieltz DM, Yates JR., III Anal Chem. 2002;74:1650. doi: 10.1021/ac015704l. [DOI] [PubMed] [Google Scholar]
- 26.Gygi SP, Rist B, Gerber SA, Turecek F, Gelb MH, Aebersold R. Nature Biotech. 1999;17:994. doi: 10.1038/13690. [DOI] [PubMed] [Google Scholar]
- 27.Old WM, Meyer-Arendt K, Aveline-Wolf L, Pierce KG, Mendoza A, Sevinski JR, Resing KA, Ahn NG. Molec Cell Proteom. 2005;4:1487. doi: 10.1074/mcp.M500084-MCP200. [DOI] [PubMed] [Google Scholar]
- 28.Gao J, Opiteck GJ, Friedrichs MS, Dongre AR, Hefta SA. J Proteome Res. 2003;2:643. doi: 10.1021/pr034038x. [DOI] [PubMed] [Google Scholar]
- 29.Gao J, Friedrichs MS, Dongre AR, Opiteck GJ. J Am Soc Mass Spectrom. 2005;16:1231. doi: 10.1016/j.jasms.2004.12.002. [DOI] [PubMed] [Google Scholar]
- 30.Liu H, Sadygov RG, Yates JR., 3rd Anal Chem. 2004;76:4193. doi: 10.1021/ac0498563. [DOI] [PubMed] [Google Scholar]
- 31.Zybailov B, Coleman MK, Florens L, Washburn MP. Anal Chem. 2005;77:6218. doi: 10.1021/ac050846r. [DOI] [PubMed] [Google Scholar]
- 32.Pang JX, Ginanni N, Dongre AR, Hefta SA, Opitek GJJ. Proteome Res. 2002;1:161. doi: 10.1021/pr015518w. [DOI] [PubMed] [Google Scholar]
- 33.Blackler AR, Klammer AA, MacCoss MJ, Wu CC. Anal Chem. 2006;78:1337. doi: 10.1021/ac051486a. [DOI] [PubMed] [Google Scholar]
- 34.Li Q, Xia Q, Wang T, Meila M, Hackett M. Rapid Commun Mass Spectrom. 2006;20:1551. doi: 10.1002/rcm.2471. [DOI] [PMC free article] [PubMed] [Google Scholar]
- 35.Qi SY, Li Y, Szyroki A, Giles IG, Moir A, O’Connor CD. Molec Micro. 1995;17:523. doi: 10.1111/j.1365-2958.1995.mmi_17030523.x. [DOI] [PubMed] [Google Scholar]
- 36.Kinter M, Sherman NE. Protein Sequencing and Identification Using Tandem Mass Spectrometry. Wiley; New York: 2000. [Google Scholar]
- 37.Eng JK, McCormack AL, Yates JR. J Amer Soc Mass Spectrom. 1994;5:976. doi: 10.1016/1044-0305(94)80016-2. [DOI] [PubMed] [Google Scholar]
- 38.Yates JR, Eng JK, McCormack AL, Schieltz D. Anal Chem. 1995;67:1426. doi: 10.1021/ac00104a020. [DOI] [PubMed] [Google Scholar]
- 39.Wilkins MR, Williams KL, Appel RD, Hochstrasser DF, editors. Proteome Research: New Frontiers in Functional Genomics. Springer; Berlin: 1997. [Google Scholar]
- 40.Yost RA, Boyd RK. Meth Enzymol. 1990;193:154. doi: 10.1016/0076-6879(90)93415-h. [DOI] [PubMed] [Google Scholar]
- 41.Hunt DF, Yates JR, Shabanowitz J, Winston S, Hauer CR. Proc Natl Acad Sci USA. 1986;83:6233. doi: 10.1073/pnas.83.17.6233. [DOI] [PMC free article] [PubMed] [Google Scholar]
- 42.Hunt DF, Alexander JE, McCormack AL, Martino PA, Michel H, Shabanowitz J, Sherman NE, Moseley MA, Jorgenson JW, Tomer KB. In: Techniques in Protein Chemistry II. Villafranca JJ, editor. Academic Press; New York: 1991. pp. 441–454. [Google Scholar]
- 43.Tabb DL, McDonald WH, Yates JR., III J Proteome Res. 2002;1:21. doi: 10.1021/pr015504q. [DOI] [PMC free article] [PubMed] [Google Scholar]
- 44.Sadygov R, Cociorva D, Yates JR., III Nature Methods. 2004;1:195. doi: 10.1038/nmeth725. [DOI] [PubMed] [Google Scholar]
- 45.Buyya R. High Performance Cluster Computing: Architectures and Systems. Vol. 1. Prentice Hall PTR; New York: 1999. [Google Scholar]
- 46.Geist A, Beguelin A, Dongarra J, Jiang W, Manchek R, Sunderam V. A Users’ Guide and Tutorial for Networked Parallel Computing. MIT Press; Boston: 1994. PVM: Parallel Virtual Machine. [Google Scholar]
- 47.Gerstein M, Jansen R. Curr Op Struct Biol. 2000;10:574. doi: 10.1016/s0959-440x(00)00134-2. [DOI] [PubMed] [Google Scholar]
- 48.Mann M, Wilm M. Anal Chem. 1994;66:4390. doi: 10.1021/ac00096a002. [DOI] [PubMed] [Google Scholar]
- 49.Tabb DL, Saraf A, Yates JR., III Anal Chem. 2003;75:6415. doi: 10.1021/ac0347462. [DOI] [PMC free article] [PubMed] [Google Scholar]
- 50.Leipzig J, Pevzner P, Heber S. Nucleic Acids Res. 2004;32:3977. doi: 10.1093/nar/gkh731. [DOI] [PMC free article] [PubMed] [Google Scholar]
- 51.Perkins DN, Pappin DJ, Creasy DM, Cottrell JS. Electrophoresis. 1999;20:3551. doi: 10.1002/(SICI)1522-2683(19991201)20:18<3551::AID-ELPS3551>3.0.CO;2-2. [DOI] [PubMed] [Google Scholar]
- 52.Geer L, Markey S, Kowalak JA, Wagner L, Xu M, Maynard DM, Yang X, Shi W, Bryant SH. Jour Proteome Res. 2004;3:958. doi: 10.1021/pr0499491. [DOI] [PubMed] [Google Scholar]
- 53.Havilio M, Haddad Y, Smilansky Z. Anal Chem. 2003;75:434. doi: 10.1021/ac0258913. [DOI] [PubMed] [Google Scholar]
- 54.Zhang N, Aebersold R, Schwikowski B. Proteomics. 2002;2:1406. doi: 10.1002/1615-9861(200210)2:10<1406::AID-PROT1406>3.0.CO;2-9. [DOI] [PubMed] [Google Scholar]
- 55.Elias J, Gibbons F, King O, Roth F, Gygi S. Nat Biotech. 2004;22:214. doi: 10.1038/nbt930. [DOI] [PubMed] [Google Scholar]
- 56.Bafna V, Edwards N. Bioinformatics. 2001;17(supplment 1) doi: 10.1093/bioinformatics/17.suppl_1.s13. [DOI] [PubMed] [Google Scholar]
- 57.Colinge J, Masselot A, Giron M, Dessingy T, Magnin J. Proteomics. 2003;3:1454. doi: 10.1002/pmic.200300485. [DOI] [PubMed] [Google Scholar]
- 58.Ferrige A, Seddon M, Green B, Jarvis SA, Skillings J. Rapid Commun Mass Spectrom. 1992;6:707. [Google Scholar]
- 59.Hansen B, Jones J, Mason D, Liebler D. Anal Chem. 2001;73:1676. doi: 10.1021/ac001172h. [DOI] [PubMed] [Google Scholar]
- 60.Liebler D, Hansen B, Davey S, Tiscareno L, Mason D. Anal Chem. 2002;74:203. doi: 10.1021/ac0155512. [DOI] [PubMed] [Google Scholar]
- 61.Pevzner P, Dancik V, Tang C. Jour Comput Biol. 2000;7:777. doi: 10.1089/10665270050514927. [DOI] [PubMed] [Google Scholar]
- 62.Wilkins MR, Gasteiger E, Gooley A, Herbert BR, Molloy MP, Binz PA, Ou K, Sanchez JC, Bairoch A, Williams KL, Hochstrasser DF. Jour Mol Biol. 1999;289:645. doi: 10.1006/jmbi.1999.2794. [DOI] [PubMed] [Google Scholar]
- 63.Tanner S, Shu H, Frank A, Wang L, Zandi E, Mumby M, Pevzner P, Bafna V. Anal Chem. 2005;77:4626. doi: 10.1021/ac050102d. [DOI] [PubMed] [Google Scholar]
- 64.Bartels C. Biomed Environ Mass Spectrom. 1990;19:363. doi: 10.1002/bms.1200190607. [DOI] [PubMed] [Google Scholar]
- 65.Taylor J, Johnson RJ. Rapid Commun Mass Spectrom. 1997;11:1067. doi: 10.1002/(SICI)1097-0231(19970615)11:9<1067::AID-RCM953>3.0.CO;2-L. [DOI] [PubMed] [Google Scholar]
- 66.Taylor J, Johnson RJ. Anal Chem. 2001;73:2594. doi: 10.1021/ac001196o. [DOI] [PubMed] [Google Scholar]
- 67.Ma B, Zhang K, Hendrie C, Liang C, Li M, Doherty-Kirby A, Lajoie G. Rapid Commun Mass Spectrom. 2003;17:2337. doi: 10.1002/rcm.1196. [DOI] [PubMed] [Google Scholar]
- 68.Frank A, Pevzner P. Anal Chem. 2005;77:964. doi: 10.1021/ac048788h. [DOI] [PubMed] [Google Scholar]
- 69.Fischer B, Roth V, Buhmann J, Grossman J, Baginsky S, Gruissem W, Roos F, Widmayer P. Advances in Neural Information Processing Systems. Vol. 17. MIT Press; Cambridge: 2005. pp. 457–464. [Google Scholar]
- 70.Garavelli JS. Proteomics. 2004;4:1527. doi: 10.1002/pmic.200300777. [DOI] [PubMed] [Google Scholar]
- 71.Schwartz JC, Senko MW, Syka JE. Jour Am Soc Mass Spectrom. 2002;13:659. doi: 10.1016/S1044-0305(02)00384-7. [DOI] [PubMed] [Google Scholar]
- 72.Douglas DJ, Frank AJ, Mao D. Mass Spectrom Rev. 2005;24:1. doi: 10.1002/mas.20004. [DOI] [PubMed] [Google Scholar]
- 73.Breci LA, Tabb DL, Yates JR, III, Wysocki VH. Anal Chem. 2003;75:1963. doi: 10.1021/ac026359i. [DOI] [PubMed] [Google Scholar]
- 74.Frank A, Tanner T, Pevzner P. Proceedings of Ninth Annual International Conference on Reseach in Computational Molecular Biology, RECOMB 2005. Springer; Heidelberg: 2005. [Google Scholar]
- 75.Cormen TH, Leiserson CE, Rivest RL, Stein C. Introduction to Algorithms. McGraw-Hill; New York: 2002. [Google Scholar]
- 76.Karp PD, Ouzounis CA, Moore-Kochlacs C, Goldovsky L, Kaipa P, Ahren D, Tsoka S, Darzentas N, Kunin V, Lopez-Vigas N. Nucl Acids Res. 2005;33:6083. doi: 10.1093/nar/gki892. [DOI] [PMC free article] [PubMed] [Google Scholar]
- 77.Nair S, Milohanic E, Berche P. Infect Immun. 2000;68:7061. doi: 10.1128/iai.68.12.7061-7068.2000. [DOI] [PMC free article] [PubMed] [Google Scholar]
- 78.Rouquette C, de Chastellier C, Nair S, Berche P. Mol Microbiol. 1998;27:1235. doi: 10.1046/j.1365-2958.1998.00775.x. [DOI] [PubMed] [Google Scholar]
- 79.Gaillot O, Pellegrini E, Bregenholt S, Nair S, Berche P. Mol Microbiol. 2000;35:1286–1294. doi: 10.1046/j.1365-2958.2000.01773.x. [DOI] [PubMed] [Google Scholar]
- 80.Becker D, Selbach M, Rollenhagen M, Ballmaier M, Meyer TF, Mann M, Bumann D. Nature. 2006;440:303. doi: 10.1038/nature04616. [DOI] [PubMed] [Google Scholar]
- 81.Schmidt FR. Appl Microbiol Biotechnol. 2004;63:335. doi: 10.1007/s00253-003-1344-1. [DOI] [PubMed] [Google Scholar]
- 82.Bandow JE, Brötz H, Leichert LIO, Labischinski H, Hecker M. Antimicrob Agents Chemother. 2003;47:948. doi: 10.1128/AAC.47.3.948-955.2003. [DOI] [PMC free article] [PubMed] [Google Scholar]
- 83.Smart EJ, De Rose RA, Farber SA. PNAS. 2004;101:3450. doi: 10.1073/pnas.0400441101. [DOI] [PMC free article] [PubMed] [Google Scholar] [Retracted]
- 84.Kramer W, Girbig F, Corsiero D, Pfenninger A, Frick W, Jähne G, Rhein M, Wendler W, Lottspeich F, Hochleitner EO, Orso E, Schitz G. J Biol Chem. 2005;280:1306. doi: 10.1074/jbc.M406309200. [DOI] [PubMed] [Google Scholar]
- 85.Biemann K. Ann Rev Biochem. 1992;61:977. doi: 10.1146/annurev.bi.61.070192.004553. [DOI] [PubMed] [Google Scholar]