Abstract
Purpose
To investigate the effectiveness of flow signal suppression of a motion-sensitizing magnetization preparation (MSPREP) sequence and to optimize a 2D MSPREP steady-state free precession (SSFP) sequence for black blood imaging of the heart.
Materials and Methods
Using a flow phantom, the effect of varying field of speed (FOS), b-value, voxel size, and flow pattern on the flow suppression was investigated. In seven healthy volunteers, black blood images of the heart were obtained at 1.5T with MSPREP-SSFP and double inversion recovery fast spin echo (DIR-FSE) techniques. Myocardium and blood signal-to-noise ratio (SNR) and myocardium-to-blood contrast-to-noise ratio (CNR) were measured. The optimal FOS that maximized the CNR for MSPREP-SSFP was determined.
Results
Phantom data demonstrated that the flow suppression was induced primarily by the velocity encoding effect. In humans, FOS = 10-20 cm/s was found to maximize the CNR for short-axis (SA) and four-chamber (4C) views. Compared to DIR-FSE, MSPREP-SSFP provided similar blood SNR efficiency in the SA basal and mid views and significantly lower blood SNR efficiency in the SA apical (P = 0.02) and 4C (P = 0.01) views, indicating similar or better blood suppression.
Conclusion
Velocity encoding is the primary flow suppression mechanism of the MSPREP sequence and 2D MSPREP-SSFP black blood imaging of the heart is feasible in healthy subjects.
Keywords: black blood, cardiac imaging, motion-sensitizing gradients, velocity encoding, diffusion preparation
Introduction
The clinical evaluation of cardiac and vascular structures using MRI often requires the suppression of intravascular signal (black blood [BB] imaging) to improve vessel wall and cardiac chamber visualization. BB imaging is commonly performed using double inversion recovery (DIR) (1-5) or spatial saturation of upstream blood (6,7). Both techniques rely on the inflow of blood with nulled signal into the imaging volume and consequently become less effective for thick imaging volumes and for in-plane flow. To overcome this problem, a BB magnetization preparation technique was developed by utilizing motion-sensitizing gradients to dephase all moving blood spins prior to imaging (8-10). BB images of the aortic and carotid vessel walls were obtained successfully in humans using this approach (11-13). Because the preparation sequence—consisting of 90-180-90 nonselective RF pulses and a pair of identical unipolar gradients around the 180 pulse—was originally developed for diffusion sensitization, this technique is often referred to as “diffusion-prepared” or “diffusion-based” in the literature (10-12). In the presence of weak diffusion-sensitizing gradients such as those used in BB imaging, this description is inadequate because the flow signal attenuation is originated primarily from the velocity encoding effect on coherently moving spins and only slightly from the diffusion effect on incoherently moving spins, as briefly pointed out by recent works (13,14). A full experimental investigation of the underlying signal attenuation mechanisms is therefore important and to the best of our knowledge, has not been performed. The purpose of this study was to investigate effective flow suppression mechanisms using a flow phantom and to optimize a flow-suppressed 2D balanced steady-state free precession (SSFP) sequence for cardiac BB imaging.
Materials and Methods
Flow And Motion Suppression Mechanisms
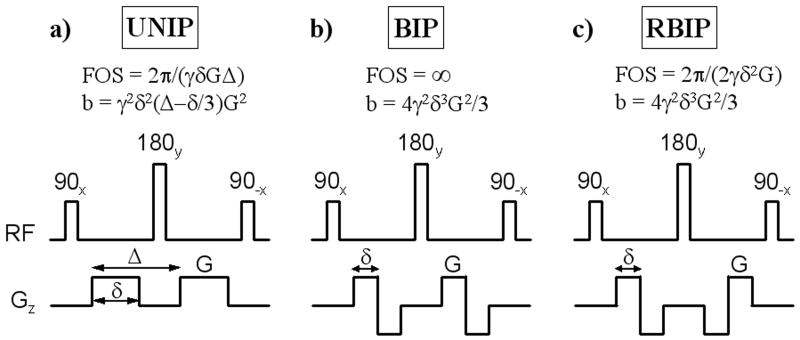
The flow-suppression preparation sequence proposed for BB imaging (10,11) shares similar design features with the Stejskal-Tanner diffusion-sensitizing sequence (15) and the velocity-selective preparation sequence proposed by Korosec et al (16). It consists of 90x tip-down, 180y refocusing, and 90-x tip-up nonselective RF pulses and a pair of identical unipolar gradients positioned around the 180y pulse (UNIP, Fig. 1a). In addition to the signal attenuation of both stationary and moving tissues due to T2 decay, these motion-sensitizing gradients induce two independent intravoxel dephasing mechanisms which lead to further signal attenuation of moving tissues: phase dispersion due to incoherent motion (diffusion effect) (17), and phase dispersion due to coherent motion (velocity encoding effect) (18). The relative signal attenuation due to the diffusion effect is given by 1-exp(-bD) (15), where D is the diffusion coefficient and b depends on the gradient waveforms (Fig. 1). While the b-value used in diffusion imaging is typically on the order of 1000 s/mm2 (19), the b-value used for BB imaging is much smaller and on the order of 1 s/mm2 to 10 s/mm2 (10-12), leading to small (often negligible) diffusion-related signal attenuation. For example, given the diffusion coefficient of pure water D = 2.2 × 10⁻³ mm2s-1 (at room temperature) and b = 1 s/mm2, the theoretical signal attenuation due to the diffusion effect is only 0.2%, which is much less than the typical signal variation due to noise in practical applications. In fact, the suppression of signal from flow (and moving tissues in general) is primarily due to the velocity encoding effect. The phase dispersion induced by UNIP gradients (Fig. 1a) is given by ϕ = γGδΔv = γm1v, where γ is the gyromagnetic constant, v is the spin velocity, and m1 is the gradient first moment (18). The dephasing effect of the gradients can be characterized by velocity encoding (venc = π/γ/m1) or field of speed (FOS = 2π/γ/m1) (18), defined as the velocities corresponding to a velocity-induced phase shift of π and 2π, respectively. If the transverse magnetization is spoiled following the tip-up RF pulse (by means of spoiler gradients), the resulting longitudinal magnetization will be modulated by cos(ϕ). Interestingly, while the velocity encoding effect has found extensive applications in phase contrast MRI of flow (18,20) and moving tissues (21), and in the design of flow-selective excitation (22-24) or magnetization preparation (16), its use in flow-suppressed MRI was demonstrated only recently for vascular imaging (8-11).
Fig. 1.
Three different motion-sensitizing magnetization preparation (MSPREP) sequences consisting of 90x tip-down, 180y refocusing, and 90-x tip-up non-selective RF pulses with a pair of a) unipolar (UNIP), b) bipolar (BIP), and c) reverse bipolar (RBIP) motion-sensitizing gradients positioned around the 180y pulse. Note that the 180y refocusing pulse was used to minimize off-resonance effects, leading to signal attenuation of both stationary and moving tissues due to T2 decay. Moving tissues experience further signal attenuation due to the intravoxel dephasing induced by diffusion effect and velocity encoding effect. The corresponding field of speed (FOS) and b-value are shown assuming rectangular gradient waveforms for simplicity (γ is the gyromagnetic constant). Note that BIP and RBIP have the same b-value, but BIP has infinite FOS (corresponding to no velocity encoding effect) regardless of the gradient amplitude G.
To experimentally demonstrate the predominant dephasing effect of velocity encoding over that of diffusion in BB imaging, two motion-sensitizing magnetization preparation (MSPREP) sequences—having a pair of bipolar (BIP) and reverse bipolar (RBIP) gradients around the 180y pulse, respectively—were implemented in addition to the standard UNIP sequence. Fig. 1 shows the pulse sequence diagrams and the corresponding FOS and b-value for the three sequences, assuming rectangular gradients for simplicity (FOS and b-value were calculated for the actual trapezoidal gradients in the imaging experiments). Note that BIP and RBIP have the same b-value, but BIP has infinite FOS (corresponding to no velocity encoding effect) regardless of the gradient amplitude. Although not as intuitive as FOS, for the special case of UNIP and RBIP sequences, b-value is inversely related to FOS (Fig. 2) and can also be used to characterize the velocity encoding effect.
Fig. 2.
The inverse relationship between FOS and b-value of a) unipolar (UNIP) and b) reverse bipolar (RBIP) MSPREP sequences. Calculations were done assuming rectangular gradient waveforms for simplicity and gradient amplitude G = 33 mT/m (refer to Fig.1 for definition of gradient amplitude and timing parameters).
Imaging Experiments
Imaging studies were performed on a flow phantom and in 7 healthy volunteers (6 males and 1 female, mean age = 41 ± 14 years, age range = 29-60 years, no known cardiac disease) using a 1.5 T clinical MR system (GE Healthcare Technologies, Waukesha, WI, USA; maximum gradient amplitude 33 mT/m, maximum slew rate 120 T/m/s). The flow phantom consisted of a straight silicon tube (9.7 mm diameter) driven by tap water under steady flow. For signal reception, a circular surface coil (7.5 cm diameter) and a standard eight-element phased-array cardiac coil (four anterior and four posterior elements) were used for the phantom and the human volunteers, respectively. This study was approved by the Institutional Review Board and written informed consent was obtained from each subject prior to imaging. Subjects were imaged during end-expiratory breath-holds with vector electrocardiographic (ECG) gating for cardiac synchronization.
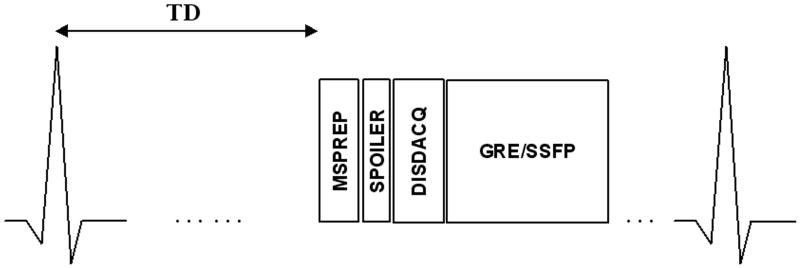
Fig. 3 shows the implemented ECG-triggered segmented-k-space 2D MSPREP imaging sequence schematically. Centric view ordering was used to maximize the motion sensitivity at the k-space center which has the greatest effect on the image contrast. For phantom imaging, the three MSPREP modules (Fig. 1) were incorporated into a 2D gradient recalled echo (GRE) imaging sequence with the following typical parameters: TR = 14.3 ms, TE = 4.7 ms, flip angle (FA) = 30°, readout bandwidth (rBW) = ±31.25 kHz, field of view (FOV) = 6 cm, matrix = 256 × 256, number of signal averages (NEX) = 1, slice thickness = 8 mm, simulated cardiac trigger frequency = 80 beats per minute (bpm), 32 echoes per trigger, 6 dummy repetitions (data acquisition turned off) prior to GRE readout. For all three MSPREP sequences (Fig. 1), the time between the 90x tip-down and 90-x tip-up RF pulses (echo time) was 14 ms. The effect of varying FOS, b-value, voxel size, and flow pattern (laminar/turbulent) on the flow suppression was investigated. Turbulent flow condition was achieved by increasing the flow rate to 20 liter per minute (corresponding to Reynolds number of 5600, which is well above the critical value of about 4000 for water flow in a straight pipe). For human imaging, the UNIP sequence (Fig. 1a) was incorporated into a breath-hold 2D SSFP imaging sequence with the following typical parameters: TR = 4.0 ms, TE = 1.3 ms, FA = 60°, rBW = ±62.5 kHz, FOV = 32 cm, matrix = 256 × 256, NEX = 1, slice thickness = 8 mm, 32 echoes per heartbeat (corresponding to an acquisition window of 128 ms), total imaging time (T) = 8 heartbeats, 6 Kaiser ramp-up magnetization preparation (25) prior to SSFP readout during mid-diastolic diastasis when the ventricular walls are least mobile. Partial echo sampling was used to shorten TR, which was important for minimizing off-resonance effects in the heart region (26). The time between the 90x tip-down and 90-x tip-up RF pulses (echo time) of the MSPREP sequence was 10 ms. The optimal trigger delay between the cardiac trigger and diastasis was determined from a four-chamber (4C) 2D SSFP cine scout scan. Three short-axis (SA) (one basal, one mid, one apical) and one long-axis (4C) images were acquired. Flow-suppressed images were obtained with FOS = 5, 10, 15, 20, 25, 30 cm/s and infinity (motion-sensitizing gradient amplitudes set to 0). As a reference, BB images of the heart were also acquired using a conventional breath-hold T2-weighted DIR 2D fast spin echo (FSE) product sequence with the following typical parameters (27): TR = 2 R-R interval, effective TE = 42 ms, full echo, echo train length (ETL) = 32, T = 16 heartbeats, echo spacing = 5 ms, re-inversion slice thickness = 3 × imaging slice thickness, and identical FOV, matrix size, NEX, slice thickness and slice orientation as that of the MSPREP-SSFP imaging sequence. Parallel imaging was not used.
Fig. 3.
Schematic of the ECG-triggered segmented-k-space motion-sensitizing 2D imaging sequence. After an ECG trigger delay (TD), motion-sensitizing magnetization preparation (MSPREP) was used to dephase moving spins in the transverse plane (while leaving stationary spins unaffected except for T2 relaxation) and store the resultant velocity-modulated signals in the longitudinal magnetization. Spoiler gradients (SPOILER) destroyed remnant transverse magnetization, followed by a short delay (DISDACQ) consisting of 6 dummy repetitions (data acquisition turned off) to provide steady-state magnetization preparation for subsequent imaging. Gradient recalled echo (GRE) and steady-state free-precession (SSFP) readout was used for phantom and human imaging, respectively. In humans, TD was chosen such that imaging occurs during mid-diastole when the ventricular walls are least mobile. The described sequence is repeated until the image data is fully acquired.
Data Analysis
For each imaging technique (MSPREP-SSFP with varying FOS and DIR-FSE) and each imaging plane (SA basal, SA mid, SA apical and 4C), the left ventricular myocardium (LV) and blood signals and the background noise were measured using region-of-interest (ROI) analysis. The ROIs for the LV and the blood measurements were selected to cover the entire LV muscle and the entire LV lumen (excluding the papillary muscles), respectively. The ROI for the noise measurement was selected from a background area free from image artifacts. First, myocardium and blood signal-to-noise ratio (SNR) and LV-to-blood contrast-to-noise ratio (CNR) were calculated as follows: SNRLV = 0.701*SLV/σn, SNRBLOOD = 0.701*SBLOOD/σn, CNR = 0.701*(SLV – SBLOOD) /σn, where SLV and SBLOOD are the LV and blood signals, respectively, σn represents the noise standard deviation measured from the background, and 0.701 is the noise correction factor for an eight-channel coil (28). Next, for each subject, the optimal FOS for MSPREP-SSFP was determined as the FOS that maximized the CNR, and the SNR and CNR corresponding to the optimal FOS were selected for comparison with that of DIR-FSE. The mean CNR was also calculated by averaging the individual CNRs over all subjects, and the inter-subject optimal FOS was determined as the FOS that maximized the mean CNR. Finally, to provide a fair comparison between imaging techniques with different imaging times, SNR efficiency and CNR efficiency were calculated as in (29,30): SNRLVeff = SNRLV/T0.5, SNRBLOODeff = SNRBLOOD/T0.5, CNReff = CNR/T0.5, where T is the total imaging time per slice expressed in seconds. Two-tailed paired-sample t-tests were used to assess the differences in SNRLVeff, SNRBLOODeff, and CNReff between the two techniques. P values of less than 0.05 were considered statistically significant. Using two-tailed paired-sample t-tests, the optimal FOS range of MSPREP-SSFP was also determined for each imaging plane as the FOS values whose mean CNR was statistically the same as the maximum mean CNR (P > 0.05).
Results
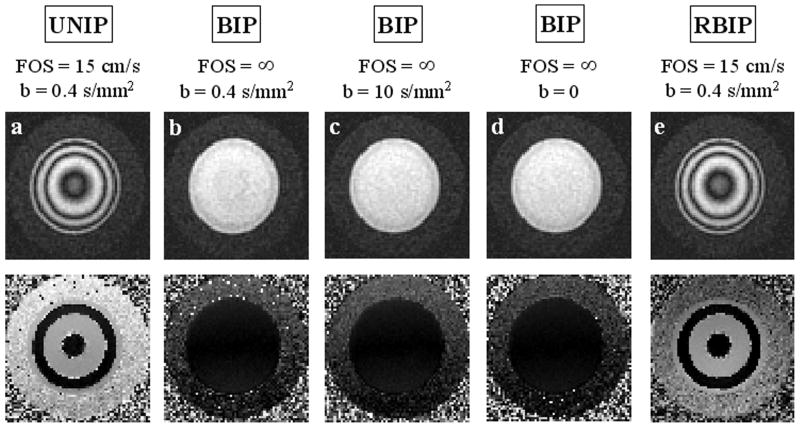
Fig. 4 shows the motion-sensitized phantom images of laminar flow (peak velocity approximately 20 cm/s) obtained with a square pixel size of 0.23 × 0.23 mm2. Note that BIP (FOS = ∞, b = 0.4 s/mm2) (Fig. 4b) and BIP (FOS = ∞, b = 10 s/mm2) (Fig. 4c) did not introduce any observable dephasing and its effect was identical to that of BIP with G = 0 (FOS = ∞, b = 0) (Fig. 4d), demonstrating that the diffusion effect is negligible for the chosen b-values. RBIP (FOS = 15 cm/s, b = 0.4 s/mm2) (Fig. 4e), however, created a cosine-modulated longitudinal magnetization, as did UNIP (FOS = 15 cm/s, b = 0.4 s/mm2) (Fig. 4a), giving rise to the observed concentric rings on the images. Note that the rings were denser and thinner toward the wall of the tube due to higher velocity gradient. These data demonstrated that the spin dephasing was induced primarily by the velocity encoding effect for b-values up to 10 s/mm2. Fig. 5 illustrates increased flow suppression obtained with smaller FOS (due to more rapid intravoxel dephasing), larger voxel size (due to increased signal averaging), or turbulent flow condition (due to the random phases acquired by moving spins). Note that flow suppression was less effective for coherent and uniform flow such as at the center of the tube (Fig. 5a-d).
Fig. 4.
Cross-sectional 2D MSPREP-GRE magnitude (top row) and phase (bottom row) images of a flow phantom under laminar flow conditions (peak velocity approximately 20 cm/s) obtained with a) UNIP (FOS = 15 cm/s, b = 0.4 s/mm2, b) BIP (FOS = ∞, b = 0.4 s/mm2), c) BIP (FOS = ∞, b = 10 s/mm2), d) BIP with G = 0 mT/m (FOS = ∞, b = 0 s/mm2), and e) RBIP (FOS = 15 cm/s, b = 0.4 s/mm2). An infinite FOS corresponds to no velocity encoding effect. The pixel size was 0.23 × 0.23 mm2. Clearly, the dephasing effect of the MSPREP sequence is determined primarily by its FOS and not by its b-value, demonstrating that velocity encoding is the predominant dephasing mechanism for bulk flow. Unlike the BIP sequence, the UNIP and RBIP sequences modulated the longitudinal magnetization with cos(γm1v), where γ is the gyromagnetic constant, v is the spin velocity, and m1 is the gradient first moment. Correspondingly, spins moving at certain velocities will be inverted prior to imaging, leading to phase jumps of π in the phase image (a-e).
Fig. 5.
Cross-sectional 2D MSPREP-GRE images of a flow phantom obtained with the UNIP sequence demonstrating increased dephasing and flow suppression obtained with smaller FOS (due to more rapid intravoxel dephasing) (a-b), larger pixel size dx and dy (due to increased signal averaging) (c-d), or turbulent flow condition (due to the random phases acquired by moving spins) (e).
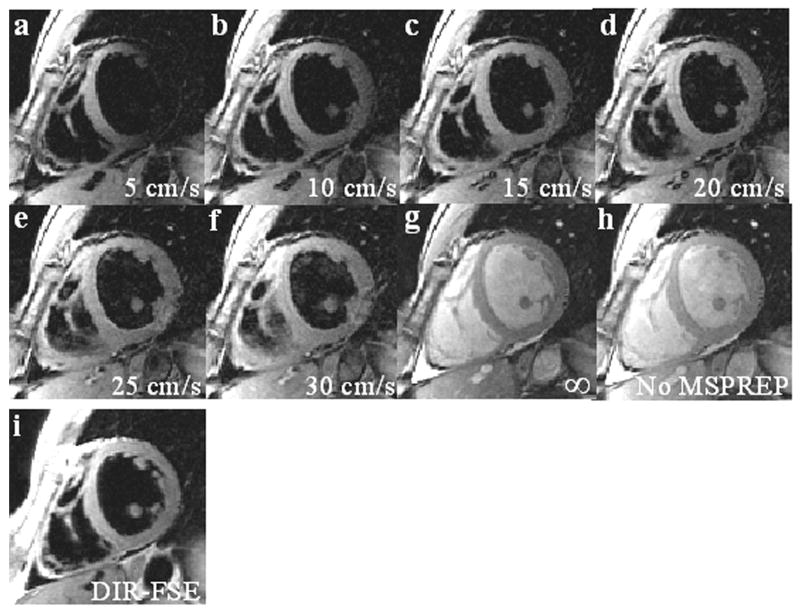
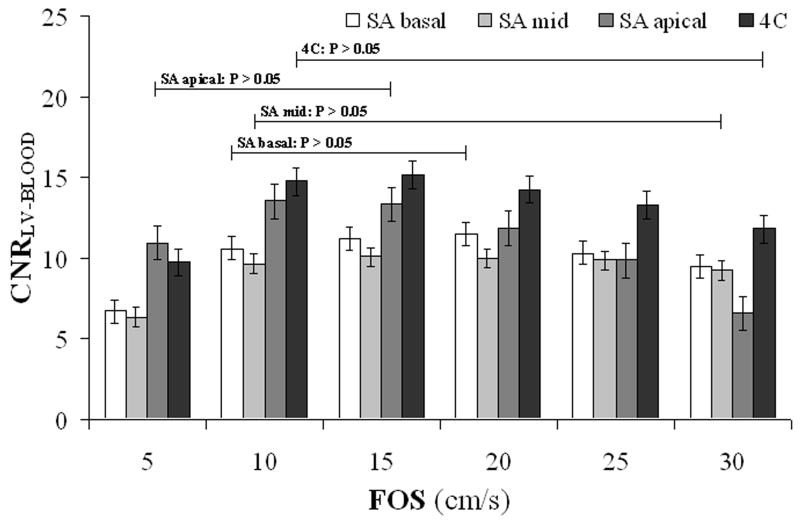
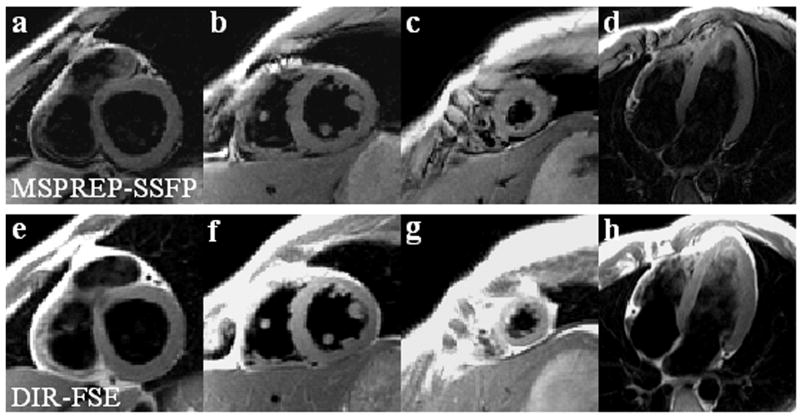
Cardiac BB images were obtained successfully from all 7 subjects. The average heart rate was 65 ± 7 bpm and the average trigger delay time was 664 ± 28 ms. Fig. 6 shows SA midventricular 2D SSFP images obtained with and without MSPREP, demonstrating increased suppression of blood flow (and more mobile cardiac structures) with lower FOS and decreased suppression of blood flow with higher FOS. Based on the average LV-to-blood CNR, the optimal FOS value was found to be approximately 15-20 cm/s for the SA basal and mid views and 10-15 cm/s for the SA apical and 4C views (Fig. 7). Fig. 8 demonstrates MSPREP-SSFP and DIR-FSE sequences effectively suppressing the intraventricular blood and providing very similar depictions of the myocardium and the papillary muscles in the SA views, whereas MSPREP-SSFP imaging provided better blood suppression than DIR-FSE imaging in the 4C view.
Fig. 6.
2D MSPREP-SSFP images of the SA mid view obtained with FOS = 5 cm/s (a), 10 cm/s (b), 15 cm/s (c), 20 cm/s (d), 25 cm/s (e), 30 cm/s (f) and infinity (no velocity encoding effect) (g), and without MSPREP (h). Reducing FOS increased motion sensitivity, leading to improved suppression of blood flow; however, more mobile cardiac structures such as the papillary muscles and the mid-lateral LV wall were also suppressed (a). On the contrary, increasing FOS reduced motion sensitivity, leading to insufficient suppression of slow-moving blood; however, the cardiac structures were better visualized (e-f). In the extreme case of an infinite FOS, blood signal was not suppressed (g), similar to the image acquired without MSPREP (h). The optimal FOS that maximizes the LV-to-blood CNR was approximately 15 cm/s (d). BB image obtained with the conventional DIR-FSE sequence is also shown as a reference (i). Note that both techniques provided effective suppression of the intraventricular blood and very similar depictions of the ventricular walls and the papillary muscles.
Fig. 7.
Mean LV-to-blood contrast-to-noise ratio (CNRLV-BLOOD) as the function of FOS calculated from SA and 4C MSPREP-SSFP images of healthy subjects (N = 7). The error bars represent ± standard error. The optimal FOS value was found to be approximately 15-20 cm/s for the SA basal and mid views and 10-15 cm/s for the SA apical and 4C views. The optimal FOS range (defined as the FOS values whose mean CNR was statistically the same as the maximum mean CNR as determined by t-test) is also shown for each imaging plane.
Fig. 8.
Comparison of SA and 4C BB images obtained with MSPREP-SSFP (a-d) and DIR-FSE (e-h). Both techniques provided very similar depiction of the myocardium and the papillary muscles as well as good intraventricular blood suppression in the SA views. MSPREP-SSFP provided improved blood suppression compared to DIR-FSE in the 4C view.
Table 1 summarizes the differences in average SNR and CNR efficiency between MSPREP-SSFP and DIR-FSE techniques. Compared to DIR-FSE, MSPREP-SSFP provided similar blood SNR efficiency in the SA basal (P = 0.52) and SA mid (P = 0.88) views and significantly lower blood SNR efficiency in the SA apical (P = 0.02) and 4C (P = 0.01) views, indicating similar or better blood suppression performance. On the other hand, DIR-FSE yielded approximately 30% higher myocardium SNR efficiency than MSPREP-SSFP in all cardiac views. As a result, DIR-FSE provided significantly higher LV-to-blood CNR in the SA basal (P = 0.02) and SA mid (P = 0.01) views compared to MSPREP-SSFP. The CNR differences were statistically non-significant in the SA apical (P = 0.16) and 4C (P = 0.81) views.
Table 1.
Comparison of SNR and CNR efficiencies between 2D MSPREP-SSFP and 2D DIR-FSE imaging techniques for the typical cardiac imaging planes (N = 7). For MSPREP-SSFP, FOS was varied from 5 cm/s to 30 cm/s with a step of 5 cm/s, and the optimal SNR and CNR were determined for each subject and each imaging plane. All values are expressed as mean ± standard deviation.
| SNRLVeff | SNRBLOODeff | CNReff | ||||
|---|---|---|---|---|---|---|
| MSPREP-SSFP | DIR-FSE | MSPREP-SSFP | DIR-FSE | MSPREP-SSFP | DIR-FSE | |
| SA basal | 6.5 ± 2.0 * | 8.9 ± 3.9 | 2.1 ± 0.4 | 2.3 ± 1.1 | 4.4 ± 1.7 * | 6.8 ± 3.4 |
| SA mid | 5.8 ± 1.7 * | 7.4 ± 2.6 | 1.9 ± 0.6 | 1.9 ± 0.6 | 3.9 ± 1.2 * | 5.5 ± 2.1 |
| SA apical | 9.1 ± 3.2 * | 14.7 ± 5.3 | 3.6 ± 1.1* | 8.0 ± 4.2 | 5.4 ± 2.4 | 6.6 ± 3.9 |
| 4C | 7.9 ± 3.5 * | 10.8 ± 3.5 | 2.1 ± 0.8* | 4.8 ± 2.1 | 5.9 ± 2.8 | 6.0 ± 2.2 |
SA = short-axis
4C = four-chamber
LV = left ventricle
indicates statistical significance (P < 0.05)
Discussion
Our results show that the primary flow-suppressing mechanism of the MSPREP sequence used for BB imaging is the velocity-induced intravoxel phase dispersion of moving spins. Consequently FOS (which is inversely proportional to the gradient first moment) is a more intuitive parameter than the b-value for characterizing the flow suppression efficiency of the motion-sensitizing gradients as suggested by Wang et al (13). While the degree of flow suppression also depends on the voxel size and the flow pattern at the imaging site, FOS is the most effective parameter for image contrast manipulation. The MSPREP-SSFP technique was successfully applied for cardiac BB imaging in healthy subjects and FOS = 10-20 cm/s was found to maximize the LV-to-blood CNR for typical cardiac SA and 4C views. This choice of FOS provided a sensible trade-off between the suppression of slow blood flow (by decreasing FOS) and the visualization of cardiac structures that may not be completely at rest (by increasing FOS).
Spin echo imaging is known to have an intrinsic BB contrast (2,31), making the study of MSPREP difficult. Accordingly, gradient echo imaging was chosen for evaluating the BB effect of MSPREP. 2D imaging was used to shorten the scan time for FOS optimization and to facilitate a direct comparison with the standard 2D DIR-FSE sequence. Compared to 2D DIR-FSE imaging of the heart in the SA basal and mid views, 2D MSPREP-SSFP imaging was found to provide similar blood suppression but reduced myocardial signal, leading to a decrease in CNR efficiency. However, for the SA apical and 4C views, where insufficient through-plane blood flow is problematic for DIR-FSE (2), MSPREP-SSFP provided better blood suppression, leading to similar CNR efficiency. The myocardial signal loss introduced by MSPREP can be attributed primarily to T2 relaxation and motion-related dephasing. T2-related signal loss can be quantified given myocardial T2 (approximately 50 ms) and MSPREP echo time (approximately 10 ms in this study). The estimation of motion-related signal loss requires the knowledge of local myocardial wall motion and therefore is more difficult. Here this signal loss was minimized by performing imaging during mid-diastolic diastasis, the period of minimal wall motion. We should note that the comparison of the blood suppression between these two fundamentally different imaging pulse sequences using SNR and CNR as figures of merit is biased by their different signal behaviors with respect to tissue characteristics, scan timing parameters, and flow. In the absence of flow, 2D SSFP can be expected to provide lower blood SNR than 2D FSE. However, faster blood flow generally increases the blood SNR of 2D SSFP (flow enhancement effect) and decreases the blood SNR of 2D FSE (spin-echo effect). The reported SNR and CNR differences between 2D MSPREP-SSFP and 2D DIR-FSE are due to the aggregate effect of both BB preparation and sequence-specific signal behavior. A more straightforward comparison using the same pulse sequence type, such as one between MSPREP-FSE and DIR-FSE, will allow a better evaluation of the BB effect of MSPREP against the standard DIR technique. While 2D MSPREP-SSFP at best only provided similar CNR efficiency to that of conventional 2D DIR-FSE, the demonstrated feasibility of the MSPREP sequence for cardiac BB imaging will encourage the ongoing development of efficient and effective 2D cine, 2D multi-slice and 3D cardiovascular BB imaging sequences.
Our preliminary findings did not match those of Koktzoglou et al (11) where 3D MSPREP-SSFP was reported to provide an approximately three-fold increase in CNR efficiency compared to 2D DIR-FSE for aortic and carotid wall imaging. This discrepancy can be explained by the differences in sequence parameters, tissue relaxation parameters (T1/T2 ∼ 600/50 ms for vessel wall and 1000/50 ms for myocardium), and tissue motion. Partial-echo sampling was used in our 2D SSFP sequence, while full-echo sampling was used in the 3D SSFP sequence of Koktzoglou et al (11). The difference in data sampling efficiency between the two imaging techniques used in this study (32 echoes/heartbeat for 2D MSPREP-SSFP vs. 16 echoes/heartbeat for 2D DIR-FSE) was smaller than that reported by Koktzoglou et al (11) (53-71 echoes/heartbeat for 3D MSPREP-SSFP vs. 16 echoes/heartbeat for 2D DIR-FSE). Myocardial wall motion (32) is typically larger than aortic and carotid wall motion (33,34).
Voxel size is an important imaging parameter that can affect the effectiveness of BB techniques. In general, changing the voxel size creates opposite blood suppression effects for DIR and MSPREP. DIR relies on the outflow of blood from the imaging slice and therefore becomes less effective with increasing slice thickness and is not affected by in-plane voxel size. On the contrary, MSPREP depends on motion-induced intravoxel dephasing and becomes more effective with larger voxel size because of increased dispersion of spin velocities, as demonstrated by our flow phantom experiment. The quantification of the blood signal loss of MSPREP requires knowledge of the blood velocity distribution within a voxel. In the simplified case of 1D laminar parabolic flow and ignoring slice profile and partial volume effects, the fractional signal loss is approximately 1 − |sinc ϕ|, where ϕ represents the voxel phase spread which is proportional to the velocity gradient within the voxel and the in-plane voxel size and inversely proportional to FOS (30). We should note that the blood flow pattern within the heart is generally quite complex and may depend on cardiac pathology (35).
The MSPREP sequence can be readily incorporated into both 2D and 3D gradient echo and spin echo imaging sequences, as demonstrated by previous studies of aortic and carotid wall imaging (11,13). 3D imaging with MSPREP can be more advantageous over conventional 2D DIR-FSE imaging because it can provide efficient and effective blood suppression in a thick imaging slab and thinner slices. In particular, BB imaging with MSPREP potentially can reduce plaque-mimicking flow artifacts in the presence of slow and recirculating flow, such as in the carotid bulb and in the peripheral vasculature (36,37). The application of the MSPREP technique to 3D BB fast gradient echo and fast spin echo imaging of the heart and other vascular territories is promising and warrants further investigation.
This study has several limitations. Only through-plane motion was sensitized for flow suppression in order to simplify the FOS optimization and was found to sufficiently suppress blood signal in healthy volunteers. Additional motion-sensitizing gradients can be added to further improve the suppression of in-plane flow without increasing the MSPREP sequence length (10,11,13), particularly for vertical and horizontal long axis views. Healthy subjects with normal resting heart rates were included in this feasibility study. Cardiac patients may exhibit faster and variable heart rates and different myocardial motion and blood flow patterns (35) which need to be considered for effective flow suppression. The FOS optimization was performed using myocardial signal averaged over the entire LV muscle instead of a segmental analysis. While such analysis (e.g., using the AHA 17-segment model) may provide additional insights about the effect of MSPREP on image quality, it may not be helpful in identifying the optimal FOS in a patient. Because local myocardial motion and blood flow are highly subject-specific, a 2D scout scan may be performed with varying FOS values to optimize the image contrast on an individual basis. The optimal FOS values recommended here may be used as an initial estimate. Finally, the clinical utility of the developed BB sequence needs to be evaluated and is the subject of future work.
In conclusion, velocity encoding is the primary flow suppression mechanism of the MSPREP sequence. Furthermore, 2D MSPREP-SSFP black blood imaging of the heart is feasible in healthy subjects and the field of speed can be used to optimize blood flow suppression and myocardial visualization.
References
- 1.Edelman RR, Chien D, Kim D. Fast selective black blood MR imaging. Radiology. 1991;181:655–660. doi: 10.1148/radiology.181.3.1947077. [DOI] [PubMed] [Google Scholar]
- 2.Simonetti OP, Finn JP, White RD, Laub G, Henry DA. “Black blood” T2-weighted inversion-recovery MR imaging of the heart. Radiology. 1996;199:49–57. doi: 10.1148/radiology.199.1.8633172. [DOI] [PubMed] [Google Scholar]
- 3.Parker DL, Goodrich KC, Masiker M, Tsuruda JS, Katzman GL. Improved efficiency in double-inversion fast spin-echo imaging. Magn Reson Med. 2002;47:1017–1021. doi: 10.1002/mrm.10152. [DOI] [PubMed] [Google Scholar]
- 4.Song HK, Wright AC, Wolf RL, Wehrli FW. Multislice double inversion pulse sequence for efficient black-blood MRI. Magn Reson Med. 2002;47:616–620. doi: 10.1002/mrm.10094. [DOI] [PubMed] [Google Scholar]
- 5.Yarnykh VL, Yuan C. Multislice double inversion-recovery black-blood imaging with simultaneous slice reinversion. J Magn Reson Imaging. 2003;17:478–483. doi: 10.1002/jmri.10278. [DOI] [PubMed] [Google Scholar]
- 6.Felmlee JP, Ehman RL. Spatial presaturation: a method for suppressing flow artifacts and improving depiction of vascular anatomy in MR imaging. Radiology. 1987;164:559–564. doi: 10.1148/radiology.164.2.3602402. [DOI] [PubMed] [Google Scholar]
- 7.Nayak KS, Rivas PA, Pauly JM, et al. Real-time black-blood MRI using spatial presaturation. J Magn Reson Imaging. 2001;13:807–812. doi: 10.1002/jmri.1112. [DOI] [PubMed] [Google Scholar]
- 8.Ye FQ, Mattay VS, Jezzard P, Frank JA, Weinberger DR, McLaughlin AC. Correction for vascular artifacts in cerebral blood flow values measured by using arterial spin tagging techniques. Magn Reson Med. 1997;37:226–235. doi: 10.1002/mrm.1910370215. [DOI] [PubMed] [Google Scholar]
- 9.Pell GS, Lewis DP, Branch CA. Pulsed arterial spin labeling using TurboFLASH with suppression of intravascular signal. Magn Reson Med. 2003;49:341–350. doi: 10.1002/mrm.10373. [DOI] [PubMed] [Google Scholar]
- 10.Sirol M, Itskovich VV, Mani V, et al. Lipid-rich atherosclerotic plaques detected by gadofluorine-enhanced in vivo magnetic resonance imaging. Circulation. 2004;109:2890–2896. doi: 10.1161/01.CIR.0000129310.17277.E7. [DOI] [PubMed] [Google Scholar]
- 11.Koktzoglou I, Li D. Diffusion-prepared segmented steady-state free precession: Application to 3D black-blood cardiovascular magnetic resonance of the thoracic aorta and carotid artery walls. J Cardiovasc Magn Reson. 2007;9:33–42. doi: 10.1080/10976640600843413. [DOI] [PubMed] [Google Scholar]
- 12.Koktzoglou I, Li D. Submillimeter isotropic resolution carotid wall MRI with swallowing compensation: imaging results and semiautomated wall morphometry. J Magn Reson Imaging. 2007;25:815–823. doi: 10.1002/jmri.20849. [DOI] [PubMed] [Google Scholar]
- 13.Wang J, Yarnykh VL, Hatsukami T, Chu B, Balu N, Yuan C. Improved suppression of plaque-mimicking artifacts in black-blood carotid atherosclerosis imaging using a multislice motion-sensitized driven-equilibrium (MSDE) turbo spin-echo (TSE) sequence. Magn Reson Med. 2007;58:973–981. doi: 10.1002/mrm.21385. [DOI] [PubMed] [Google Scholar]
- 14.Nguyen TD, de Rochefort L, Spincemaille P, Prince MR, Wang Y. Effective velocity spoiling for black blood imaging of the heart. Berlin, Germany: 2007. May, p. 3631. [Google Scholar]
- 15.Stejskal EO, Tanner JE. Spin diffusion measurements - Spin echoes in presence of a time-dependent field gradient. J Chem Phys. 1965;42:288–292. [Google Scholar]
- 16.Korosec FR, Grist TM, Polzin JA, Weber DM, Mistretta CA. MR angiography using velocity-selective preparation pulses and segmented gradient-echo acquisition. Magn Reson Med. 1993;30:704–714. doi: 10.1002/mrm.1910300608. [DOI] [PubMed] [Google Scholar]
- 17.Le Bihan D, Breton E, Lallemand D, Aubin ML, Vignaud J, Laval-Jeantet M. Separation of diffusion and perfusion in intravoxel incoherent motion MR imaging. Radiology. 1988;168:497–505. doi: 10.1148/radiology.168.2.3393671. [DOI] [PubMed] [Google Scholar]
- 18.Moran PR. A flow velocity zeugmatographic interlace for NMR imaging in humans. Magn Reson Imaging. 1982;1:197–203. doi: 10.1016/0730-725x(82)90170-9. [DOI] [PubMed] [Google Scholar]
- 19.Le Bihan D, Mangin JF, Poupon C, et al. Diffusion tensor imaging: concepts and applications. J Magn Reson Imaging. 2001;13:534–546. doi: 10.1002/jmri.1076. [DOI] [PubMed] [Google Scholar]
- 20.Bryant DJ, Payne JA, Firmin DN, Longmore DB. Measurement of flow with NMR imaging using a gradient pulse and phase difference technique. J Comput Assist Tomogr. 1984;8:588–593. doi: 10.1097/00004728-198408000-00002. [DOI] [PubMed] [Google Scholar]
- 21.Jung B, Schneider B, Markl M, Saurbier B, Geibel A, Hennig J. Measurement of left ventricular velocities: phase contrast MRI velocity mapping versus tissue-doppler-ultrasound in healthy volunteers. J Cardiovasc Magn Reson. 2004;6:777–783. doi: 10.1081/jcmr-200036116. [DOI] [PubMed] [Google Scholar]
- 22.Norris DG, Schwarzbauer C. Velocity selective radiofrequency pulse trains. J Magn Reson. 1999;137:231–236. doi: 10.1006/jmre.1998.1690. [DOI] [PubMed] [Google Scholar]
- 23.Pope JM, Yao S. Flow-selective pulse sequences. Magn Reson Imaging. 1993;11:585–591. doi: 10.1016/0730-725x(93)90477-u. [DOI] [PubMed] [Google Scholar]
- 24.de Rochefort L, Maitre X, Bittoun J, Durand E. Velocity-selective RF pulses in MRI. Magn Reson Med. 2006;55:171–176. doi: 10.1002/mrm.20751. [DOI] [PubMed] [Google Scholar]
- 25.Nguyen TD, Spincemaille P, Prince MR, Wang Y. Cardiac fat navigator-gated steady-state free precession 3D magnetic resonance angiography of coronary arteries. Magn Reson Med. 2006;56:210–215. doi: 10.1002/mrm.20938. [DOI] [PubMed] [Google Scholar]
- 26.Deshpande VS, Shea SM, Chung YC, McCarthy RM, Finn JP, Li D. Breath-hold three-dimensional true-FISP imaging of coronary arteries using asymmetric sampling. J Magn Reson Imaging. 2002;15:473–478. doi: 10.1002/jmri.10087. [DOI] [PubMed] [Google Scholar]
- 27.Greenman RL, Shirosky JE, Mulkern RV, Rofsky NM. Double inversion black-blood fast spin-echo imaging of the human heart: a comparison between 1.5T and 3.0T. J Magn Reson Imaging. 2003;17:648–655. doi: 10.1002/jmri.10316. [DOI] [PubMed] [Google Scholar]
- 28.Constantinides CD, Atalar E, McVeigh ER. Signal-to-noise measurements in magnitude images from NMR phased arrays. Magn Reson Med. 1997;38:852–857. doi: 10.1002/mrm.1910380524. [DOI] [PMC free article] [PubMed] [Google Scholar]
- 29.Mani V, Itskovich VV, Szimtenings M, et al. Rapid extended coverage simultaneous multisection black-blood vessel wall MR imaging. Radiology. 2004;232:281–288. doi: 10.1148/radiol.2321031022. [DOI] [PubMed] [Google Scholar]
- 30.Haacke EM, Brown RW, Thompson MR, Venkatesan R. Magnetic Resonance Imaging: Physical Principles and Sequence Design. New York: Wiley-Liss; 1999. pp. 674–675. [Google Scholar]
- 31.Edelman RR, Mattle HP, Wallner B, et al. Extracranial carotid arteries: evaluation with “black blood” MR angiography. Radiology. 1990;177:45–50. doi: 10.1148/radiology.177.1.2399337. [DOI] [PubMed] [Google Scholar]
- 32.Kvitting JP, Ebbers T, Engvall J, Sutherland GR, Wranne B, Wigstrom L. Three-directional myocardial motion assessed using 3D phase contrast MRI. J Cardiovasc Magn Reson. 2004;6:627–636. doi: 10.1081/jcmr-120038692. [DOI] [PubMed] [Google Scholar]
- 33.Wedding KL, Draney MT, Herfkens RJ, Zarins CK, Taylor CA, Pelc NJ. Measurement of vessel wall strain using cine phase contrast MRI. J Magn Reson Imaging. 2002;15:418–428. doi: 10.1002/jmri.10077. [DOI] [PubMed] [Google Scholar]
- 34.Schmidt-Trucksass A, Grathwohl D, Schmid A, et al. Assessment of carotid wall motion and stiffness with tissue Doppler imaging. Ultrasound Med Biol. 1998;24:639–646. doi: 10.1016/s0301-5629(98)00023-4. [DOI] [PubMed] [Google Scholar]
- 35.Mohiaddin RH. Flow patterns in the dilated ischemic left ventricle studied by MR imaging with velocity vector mapping. J Magn Reson Imaging. 1995;5:493–498. doi: 10.1002/jmri.1880050503. [DOI] [PubMed] [Google Scholar]
- 36.Steinman DA, Rutt BK. On the nature and reduction of plaque-mimicking flow artifacts in black blood MRI of the carotid bifurcation. Magn Reson Med. 1998;39:635–641. doi: 10.1002/mrm.1910390417. [DOI] [PubMed] [Google Scholar]
- 37.Mohajer K, Zhang H, Gurell D, et al. Superficial femoral artery occlusive disease severity correlates with MR cine phase-contrast flow measurements. J Magn Reson Imaging. 2006;23:355–360. doi: 10.1002/jmri.20514. [DOI] [PubMed] [Google Scholar]


