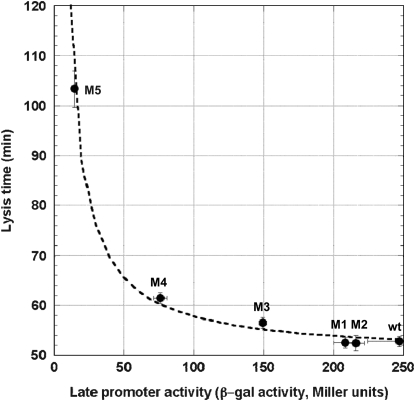
Figure 2.—
Effect of the late promoter activity on lysis time. Solid symbols represent the empirically determined lysis times. Error bars denote the 95% confidence intervals. Some of the intervals are too small to show. The dashed curve represents the fitted model of tL =  , where tL is the lysis time and a is the late promoter activity.

