Abstract
In mammals, males and females exhibit anatomical, hormonal, and metabolic differences. A major example of such sex dimorphism in mouse involves hepatic drug metabolism, which is also a noticeable target of circadian timekeeping. However, whether the circadian clock itself contributes to sex-biased metabolism has remained unknown, although several daily output parameters differ between sexes in a number of species, including humans. Here we show that dimorphic liver metabolism is altered when the circadian regulators Cryptochromes, Cry1 and Cry2, are inactivated. Indeed, double mutant Cry1–/– Cry2–/– male mice that lack a functional circadian clock express a number of sex-specific liver products, including several cytochrome P450 enzymes, at levels close to those measured in females. In addition, body growth of Cry-deficient mice is impaired, also in a sex-biased manner, and this phenotype goes along with an altered pattern of circulating growth hormone (GH) in mutant males, specifically. It is noteworthy that hormonal injections able to mimic male GH pulses reversed the feminized gene expression profile in the liver of Cry1–/– Cry2–/– males. Altogether, our observations suggest that the 24-h clock paces the dimorphic ultradian pulsatility of GH that is responsible for sex-dependent liver activity. We thus conclude that circadian timing, sex dimorphism, and liver metabolism are finely interconnected.
Phenotypic differences between males and females of a given species exist from invertebrates to humans and cover various features including disease susceptibility and life span, for example. Although the anatomical and hormonal differences between sexes are well described, few genetic determinants are known to account for sexual dimorphism in mammals. Recent genome-wide studies on various mouse tissues showed that major differences in gene expression between males and females involve drug metabolism (1, 2), and among somatic organs, the sex-biased transcriptional activity is particularly high in the liver (3–5). These observations may provide insight into why many drugs exhibit a faster clearance in women as compared with men (6) but also underscore the importance of considering sex issues in studies on liver metabolism.
Interestingly, liver activity also fluctuates along the light-dark cycle and is a noticeable target of circadian timekeeping (7–9). Both systemic cues and a circadian clock within hepatocytes are involved in daily oscillations of liver metabolism (10, 11). However, because most of these studies were focused on males exclusively, the possible interaction between circadian oscillators and sex dimorphism of hepatic activity is not documented.
This prompted us to investigate whether circadian cogwheels could also be involved in the sexual dimorphism observed at the hepatic level. Indeed, several daily output parameters differ between sexes in a number of species, including humans (12–14), which may reflect the ability of the suprachiasmatic nuclei (SCN),3 where the central pacemaker resides, to sense sexual hormones through receptors to androgens and estrogens (15, 16). We therefore assessed liver activity in homozygous double mutant Cryptochrome 1 and 2 males and females (hereafter referred to as Cry–/– mice) that are devoid of a functional circadian clock (17). Our results reveal that Cry–/– males have a feminized liver and pinpoint dimorphic GH pulsatility as the main signal altered by the inactivation of Cryptochromes.
EXPERIMENTAL PROCEDURES
Quantitative Real-time PCR—Eight-week-old Cry–/– (17) and isogenic control mice, maintained under a 12-h light/12-h dark cycle (ZT0 and ZT12 refer to lights on and off, respectively) and free access to food and water, were sacrificed by cervical dislocation. Livers were rapidly removed, frozen in liquid nitrogen, and stored at –80 °C until use. Total RNA extraction was done with the RNeasy kit (Qiagen) according to the manufacturer's instructions. Total RNA was then reverse-transcribed into cDNA by using Superscript III reverse transcriptase (Invitrogen) with oligonucleotide random hexamers. Primers of the mouse mRNAs to be investigated were designed using Primer Express (Applied Biosystems) or Beacon Designer (Premier Biosoft) and checked for specificity using the BLAST program. In general, PCR primers were chosen to introduce a minimum of a two-nucleotide mismatch with all related Cyp subfamily members. Results presented for Cyp3a41 may actually represent the combined contribution of Cyp3a41 and Cyp3a16 RNA because the primers bring only one single nucleotide mismatch in between the two forms and theoretical amplicons with 96% homology that may not be distinguished by the dissociation curve of amplified products conducted to verify the unicity of amplified products. Real-time PCR was performed and analyzed using a 7500 Fast real-time PCR system with SYBR Green master mix (Applied Biosystems). Relative expression levels were determined using the comparative CT method to normalize target gene mRNA to Gapdh.
Microsome Preparation and Assessment of Cytochrome P450 Enzymatic Activity—Two-month-old mice were sacrificed at ZT4, and their livers were rapidly dissected, homogenized in homogenizing buffer (10 mm Tris-HCl, pH 7.4, 1 mm EDTA, and 250 mm sucrose) with the addition of phosphatase inhibitors (1 mm sodium orthovanadate and 10 mm sodium fluoride) and a protease inhibitor (100 μm phenylmethylsulfonyl fluoride) and centrifuged at 9000 rpm for 15 min to obtain a total tissue homogenate. Microsomal pellets were separated from cytosolic supernatant by ultracentrifugation and suspended in potassium phosphate buffer, pH 7.4, containing 0.1 mm EDTA and 20% glycerol. Microsomal protein concentrations were determined using the Bradford assay.
Testosterone hydroxylase activity was measured as described previously (18). Liver microsomes were tested at 1 mg of proteins/ml in 0.05 m Tris buffer, pH 7.4, for testosterone hydroxylase activity using 300 μm of 14C-labeled testosterone as a substrate. In addition, 5α-reductase activity was inhibited by the addition of 5 μm finasteride to the incubation mixture. The NADPH-regenerating system was composed of 10 mm glucose-6-phosphate, 5 IU/ml glucose-6-phosphate dehydrogenase, and 10 mm MgCl2 in 0.05 m Tris buffer, pH 7.4. The reaction was started by the addition of 1 mm NADPH. The incubation, at 37 °C, lasted 15 min, and the reaction was stopped using a mixture of 3 ml of dichloromethane and 65 nmol of 11β-hydroxytestosterone (UV internal standard). Each sample was vigorously vortexed and centrifuged. Two ml of organic phase were transferred to a clean glass test tube and evaporated to dryness under a stream of nitrogen gas. Nitrogen-dried dichloromethane extracts were dissolved in a mixture of 0.1 m ammonium acetate/methanol/acetonitrile. Testosterone metabolites were separated by reverse phase high pressure liquid chromatography, using Symmetry C18 column 5 μm (220 × 2.1 mm), heated at 55 °C. The mobile phases used were (phase A) 0.1 m ammonium acetate; 30% methanol and (phase B) 0.1 m ammonium acetate; 70% methanol. Hydroxylated metabolites were monitored by UV at 247 nm and by radioactivity detection and eluted with a linear gradient: 0.7% of phase B/min at a flow rate of 350 μl/min. Hydroxylated testosterone (OHT) standards (2α-OHT, 2β-OHT, 6α-OHT, 6β-OHT, 7α-OHT, 11β-OHT, 15α-OHT, 15β-OHT, 16α-OHT, 16β-OHT) were used to identify testosterone metabolites.
Determination of MUPs Levels in Urine—Urine was collected at ZT4 and briefly centrifuged (3 min at 8800 × g). The supernatant was diluted (1/20) with 2× Laemmli buffer and heated at 90 °C for 90 s. Routinely, 8 μl of urine solution were analyzed by electrophoresis on a 15% SDS-polyacrylamide gel stained with Coomassie Blue. Relative amounts of proteins in the molecular weight range of 20,000 were estimated by integrating band density, expressed in arbitrary units.
Hormonal Assays—Circulating hormones were measured from trunk blood collected in heparinized centrifuge tubes for plasma preparation. For pituitary content, anterior pituitary glands were homogenized in phosphate-buffered saline. Assays were performed using a testosterone enzyme-linked immunosorbent assay kit (Cayman Chemical), according to the manufacturer's recommendations, and a GH-specific radioimmunoassay using reagents provided by A. F. Parlow.
RESULTS
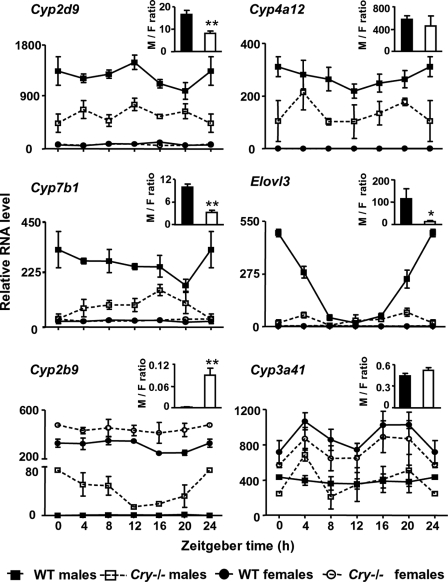
The Sex Dimorphism in Liver Activity Is Impaired in Cry–/– Mice—To determine whether circadian clock components impact on differences between males and females, we assessed by real-time quantitative PCR the expression of several dimorphic genes in the liver of male and female mice sacrificed at selected time points around the light-dark cycle and compared their expression level in control and double homozygous Cry–/– mice. Sexually dimorphic genes include members of the cytochrome P450 (Cyp) family that are involved in the hydroxylation of steroid hormones and various chemicals, and Elovl3, involved in fatty acid biosynthesis (1). In control animals, we found that the difference in expression between males and females persists all along the light-dark cycle for most of the genes considered (Fig. 1). As reported previously (19, 20), Elovl3 exhibits daily variations in male liver and is hardly detectable in females at any time point (Fig. 1). Interestingly, the male-female dimorphism is strongly reduced in Cry–/– mice. Indeed, the male-predominant genes Cyp2d9, Cyp4a12, and Cyp7b1 are significantly down-regulated along the light-dark cycle in male Cry–/– livers, whereas modest, if any, alteration is noticed in females (Fig. 1). The expression of Elovl3 becomes constitutively low, and daily variations are abolished in male livers. Conversely, the female-predominant gene Cyp2b9 is significantly up-regulated in Cry–/– mutant males, which dramatically increased the expression ratio between males and females (Fig. 1, inset). Hence, inactivation of Cry1 and Cry2 genes leads to a feminization of the expression patterns of several genes in the male liver.
FIGURE 1.
The sex dimorphism in gene expression is reduced in the liver of Cry–/– mice. Livers from control and Cry–/– mice were collected every 4 h. Relative RNA levels, measured by quantitative PCR, are shown for control wild type (WT, closed symbols, solid lines) and Cry–/– (open symbols, dotted lines) males (squares) and females (circles), respectively. Data from ZT0 are replotted at ZT24 to improve readability. RNA levels are graphed as means ± S.E., n = 3–4 for each series. For all genes, the global statistical significance is p < 0.005 between control males and females and between males of both genotypes (two-way ANOVA). Insets show the average ratio of expression over 24 h between male and female livers (M/F ratio) in wild type (solid bars) and Cry–/– mice (open bars). **, p < 0.01 and *, p < 0.05 as compared with control males, Mann-Whitney U test.
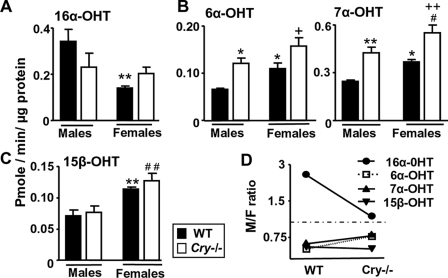
The different expression patterns of Cyp genes between sexes are believed to affect the rate of metabolism for a given substrate directly. To assess whether the feminized gene expression profile of Cry–/– males is translated at the metabolic level, we measured the activity of microsomal hydroxylases. Levels of the male-predominant testosterone 16α-hydroxylase activity tend to become similar in microsomes from Cry–/– males and females (Fig. 2, A and D). In parallel, the sexual dimorphism in production of the female-predominant metabolites 6α-OH and 7α-OH testosterone is reduced in Cry–/– mice as compared with wild types (Fig. 2, B and D). Although testosterone metabolites cannot be reliably ascribed to individual Cyp forms, these findings mirror our results obtained with quantitative PCR and support that metabolic sex dimorphism is altered in Cry–/– mice.
FIGURE 2.
Sex differences in liver microsomal testosterone hydroxylase activities are reduced in Cry–/– mice. Testosterone hydroxylase activities were determined in liver microsomes prepared from wild type (WT, solid bars) and Cry–/– mice (open bars). Specific activities are shown for male-predominant 16α-hydroxylase (A), female-predominant 6α-hydroxylase and 7α-hydroxylase (B), and 15β-hydroxylase (C). D, activity ratios between male and female microsomes are plotted on a log scale. Note that this ratio tends to 1 (horizontal dashed line) for microsomal activities measured from Cry–/– mice in A and B, whereas it remains constant for 15β-hydroxylase activity. **, p < 0.01 and *, p < 0.05 as compared with control males, ++, p < 0.01 and +, p < 0.05 as compared with control females and ##, p < 0.01 and #, p < 0.05 as compared with Cry–/– males; symbols are omitted when differences are not significant (two-way ANOVA; n = 5 animals in each condition, means ± S.E.).
It is worth noting that the feminization of Cry–/– males is incomplete and does not extend to all sexually dimorphic genes of liver metabolism. For example, the male-female difference in expression of the female-predominant gene Cyp3a41 remains unchanged in Cry–/– animals (Fig. 1). Similarly, the female-predominant testosterone 15β-hydroxylase activity is not altered in either Cry–/– males or females (Fig. 2, C and D). Moreover, Cry–/– males are fertile4 and exhibit normal levels of circulating testosterone (3784 ± 1099 pg/ml, n = 8, and 2996 ± 860 pg/ml, n = 6, in wild type and Cry–/– males, respectively, p > 0.05, Mann-Whitney U test), which is in contrast with another mutant mouse line lacking the circadian clock protein BMAL1 (21). These observations suggest that the feminization of the liver of Cry–/– mutant males is not driven by impaired gonadic function. Instead, a definite pathway must be altered downstream the testicular activity, leading to the partial feminization of the liver.
Dimorphic Traits Dependent on Ultradian GH Pulsatility Are Feminized in Cry–/– Males—Ultradian profiles of circulating GH are a key mediator for sex-dependent effects on the liver in many species (3, 22–24). Indeed, a major difference between males and females in both rats and mice is the sustained (3–4 h) interpulse interval of low GH between peaks of secretion (25, 26), required for the expression of male-specific liver genes (27). These sex differences in GH patterns largely contribute to the sexual dimorphism in body growth (28). The pulsatile GH release is also well known for increasing the synthesis of major urinary proteins (MUPs) in the liver of males and their subsequent accumulation in urine (29, 30). We therefore decided to rely on these two parameters, body growth and MUPs content, as indirect readouts of GH pulsatility.
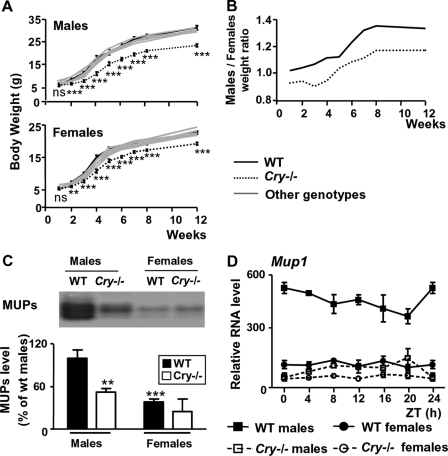
Firstly, previous studies reported that clock-deficient Bmal1–/– or Cry–/– mice are significantly smaller than control animals (31–33). This prompted us to systematically compare the postnatal growth of Cry–/– males and females. Double mutant Cry1–/– Cry2–/– animals of either sex exhibit a marked reduction in size and show a 10–20% reduction of body weight as compared with littermates bearing at least one wild type allele of either Cry gene (Fig. 3A). This growth deficit first becomes apparent at 2–3 weeks after birth, which matches the onset of the somatotroph axis (28). Importantly, the growth deficiency of Cry–/– mice is more pronounced in males than in females, leading to a decrease of sex dimorphism in body growth as emphasized by the lower body weight ratio between males and females in mutant animals as compared with wild type mice (Fig. 3B).
FIGURE 3.
The GH-dependent sex dimorphism is suppressed in Cry–/–mice. A, body weight of animals obtained from Cry1+/–/Cry2+/– intercrosses. Wild type (black solid line), Cry–/– (dotted line) and littermates bearing at least one wild type Cry allele (gray solid lines), males (upper panel) and females (lower panel), were weighted weekly from 1 to 8 weeks of age and at 12 weeks. Data are graphed as means ± S.E. ***, p < 0.005, **, p < 0.01, and ns, not significant, for control versus Cry–/– mice, Mann-Whitney U test. B, male/female body weight ratios for wild type (WT, solid line) and Cry–/– (dotted line) mice. Note that ratio values are close to 1 in Cry–/– mice, indicating a loss of sexually dimorphic growth rates. C, MUPs accumulation. A representative example of MUPs stained with Coomassie Blue after SDS-polyacrylamide gel electrophoresis (upper panel) and pooled analysis of MUPs content in urine of wild type (solid bars, n = 9 males and n = 14 females) and Cry–/– (open bars, n = 15 males and n = 12 females) is shown. ***, p < 0.005 and **, p < 0.01 as compared with wild type males (two-way ANOVA). D, Mup1 expression level in the liver of mice used in Fig. 1. The global statistical significance by two-way ANOVA is p < 0.001 between control males and females and between males of both genotypes.
Secondly, to estimate the accumulation of MUPs, urine from matched control and Cry–/– males and females was collected and analyzed by electrophoresis. We found that MUPs levels are dramatically decreased in the urine of male Cry–/– mice as compared with wild type males (Fig. 3C). This is not due to a deficiency in urine concentration because urine osmolarity is even slightly higher in Cry–/– mice than in control animals (2397 ± 184 mosm/kg H2O, n = 12 and 2451 ± 231 mosm/kg H2O, n = 9 for mutant males and females, respectively; 1871 ± 130 mosm/kg H2O, n = 11 and 1873 ± 316 mosm/kg H2O, n = 7 for wild type males and females, respectively). Rather, the decreased MUPs content in the urine of Cry–/– males is associated with the down-regulation of the Mup1 gene expression in their liver (Fig. 3D). Thus, both body growth and MUPs accumulation show impaired sex dimorphism in Cry–/– mice, suggesting that altered GH profiles may be responsible for their feminized metabolic pattern.
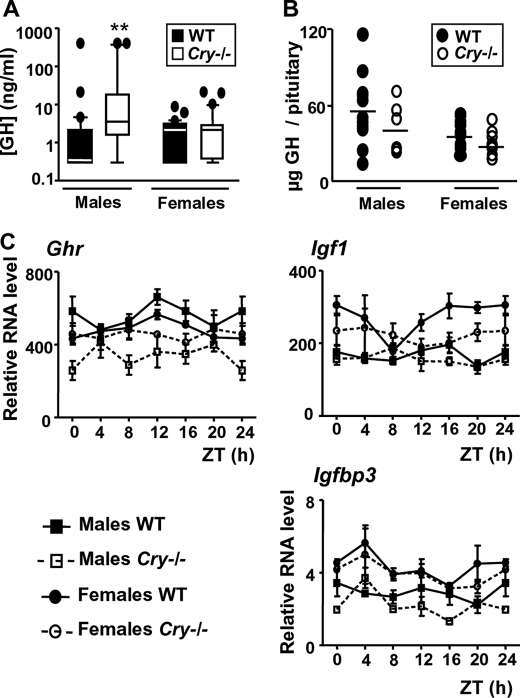
Cry–/– Males Exhibit Altered Circulating GH Levels—The direct assessment of temporal GH patterns in the mouse, unlike in rat, is hampered by technical difficulties of repeated blood sampling in freely moving animals. To evaluate whether the inactivation of the Cry genes is associated with an altered GH secretion pattern, we collected trunk blood at random times from control and Cry–/– males and females. As reported previously (29), control males and females show a similar distribution of their GH levels, except that maximal values are higher in males (Fig. 4A). Interestingly, 53% of the values obtained from male blood (16/30) were below 1 ng/ml, whereas this proportion falls to only 23% in females (7/30). It is likely that such a difference is the footprint of the long and short durations of GH troughs in between secretion peaks in males and females, respectively, as described in the single study that reported direct measurements of GH pulsatility in the mouse (25). The Cry deletion did not significantly alter the distribution of GH values in females. In contrast, GH levels were significantly shifted higher in Cry–/– males (Fig. 4A). Only 20% of random GH values were below 1 ng/ml (4/20), suggesting that GH trough duration is shorter than in control males. These data suggest that the ultradian GH profile is altered in Cry–/– males with reduced non-secreting episodes.
FIGURE 4.
Circulating GH levels are altered in Cry–/– males. A, box plots of circulating GH levels measured in trunk blood randomly collected between ZT2 and ZT8 from wild type (WT, solid boxes with median in white, n = 30 males and 30 females) and Cry–/– mice (open boxes with median in black, n = 20 males and 30 females) of each sex. Individual values outside 90% of the population distributions are plotted as black circles. The median values of the four groups are significantly different (p < 0.05, Kruskal-Wallis test). **, p < 0.01 between wild type and Cry–/– males (Dunn's multiple comparison test). B, the total amount of GH was quantified from whole pituitary glands of Cry–/– (open circles) and control (solid circles) males and females. The inactivation of Cry genes has no effect on average GH levels (p = 0.20 and p = 0.15 for control versus Cry–/– mice in males and females, respectively, Mann-Whitney U test). C, expression levels of genes involved in GH signaling were measured in the liver from mice used in Fig. 1. RNA levels are graphed as means ± S.E., n = 3–4 for each series. The global statistical significance by two-way ANOVA is p < 0.001 and p < 0.05 between males of both genotypes for Ghr and Igfbp3, respectively. No significant alteration was found for Igf1 in Cry–/– males as compared with controls. Ghr, GH receptor.
Accordingly, we found that total pituitary GH contents from wild type males are scattered along a wide range of values (Fig. 4B), which possibly depicts the alternating course of GH surges and troughs, whereas the narrow pattern obtained with glands from Cry–/– males resembles the distribution of values from females (Fig. 4B). However, although GH patterns are altered in Cry–/– males, their pituitary gland remains able to secrete a high amount of GH when stimulated with the intravenous injection of 100 ng of GH-releasing hormone or synthetic GH-releasing hexapeptide GHRP6 (data not shown). Moreover, although we noticed a slight down-regulation of the GH receptor, Ghr, in the liver of Cry–/– males, no important alteration were found in the somatotroph liver outputs, such as genes coding for the insulin-like growth factor Igf1 and its binding protein Igfbp3 (Fig. 4C).
Taken together, our data show that the Cry–/– mutation alters the GH tempo. Interestingly, it is already known that the internal circadian clock gets less robust (34) and that the somatotroph axis dampens (35) during aging. To investigate whether these alterations may affect sex dimorphism in liver metabolism, we compared liver genes expression between young and old male mice. We found that aged wild type male mice have a feminized liver gene pattern (Fig. 5), as reported previously in rats (27). Although slight differences can be noted, the liver of young Cry–/– and old wild type males are therefore submitted to similar changes as compared with young control animals (Figs. 1 and 5). Hence, we reasoned that circadian timekeeping may pace the GH pulsatility that is responsible for male-specific liver activity and body growth.
FIGURE 5.
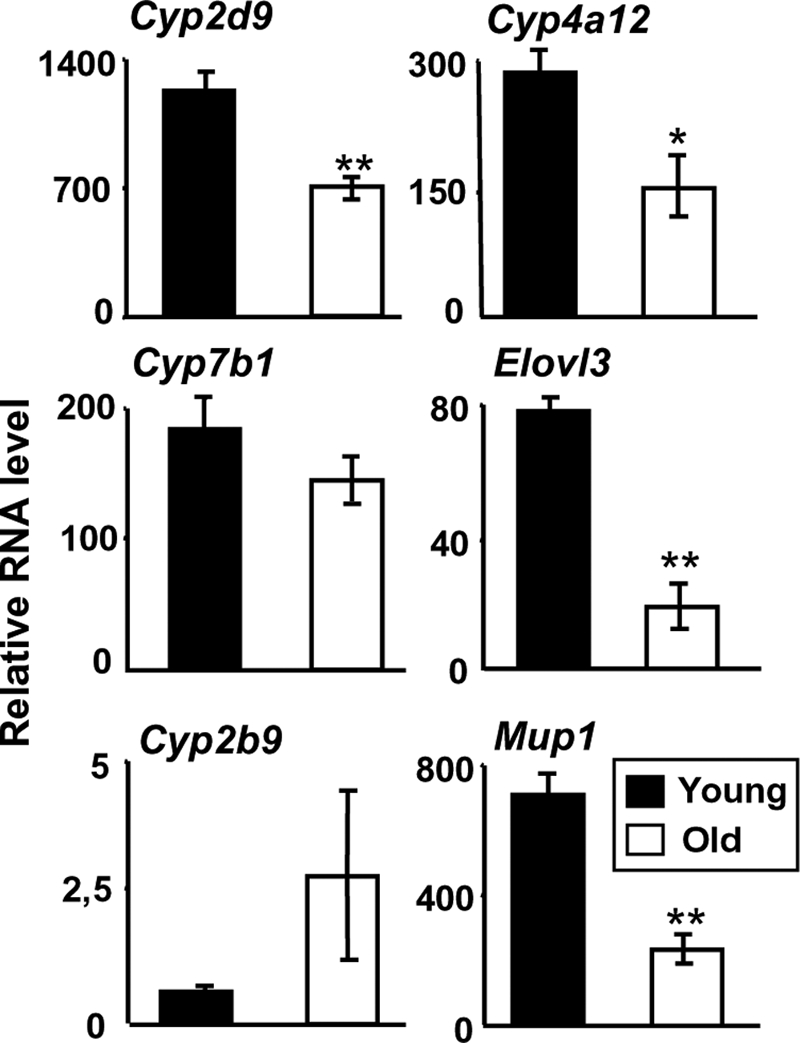
Aged male mice have a feminized liver gene pattern. Livers of 8-week-old (solid bars) and 2-year-old (open bars) C57BL/6 male mice were collected between ZT2 and ZT4. Sex-specific liver genes show a feminization of their expression level in aged males. Relative RNA levels are graphed as means ± S.E., n = 5 animals in each condition. **, p < 0.01 and *, p < 0.05, Mann-Whitney U test.
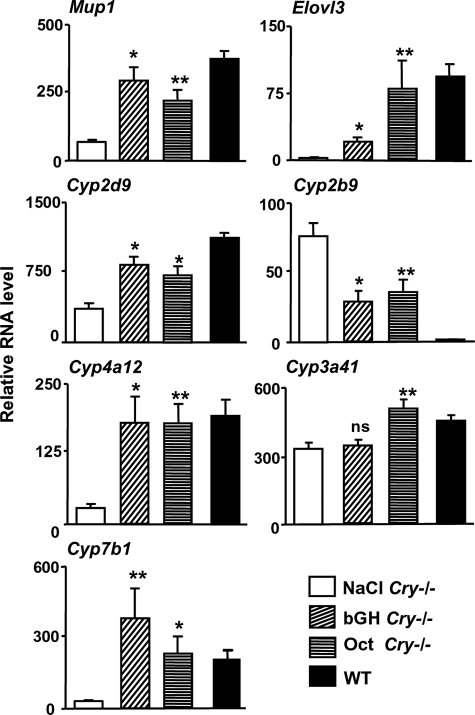
Mimicking GH Pulses Reverses the Feminized Phenotype of Cry–/– Males—If our hypothesis is correct that altered GH profiles are responsible for the loss of sex dimorphism, it should be possible to reverse the hepatic feminization by reinstating GH pulses and interpulses in Cry–/– males. Accordingly, we administered bovine GH (50 μg/mouse) at 12-h intervals during 1 week to Cry–/– males, a protocol previously shown to masculinize hepatic gene expression in wild type female mice (23). This treatment restores typical male Mup1 mRNA levels and reverses the feminized pattern of hepatic Cyp2b9, Cyp2d9, Cyp4a12, Cyp7b1, and Elovl3 in Cry–/– males to levels similar to those measured in untreated wild type males (Fig. 6). To exclude a spurious effect from high concentrations of exogenous GH, we forced the pituitary gland of Cry–/– males to secrete endogenous GH in a pulsatile manner but without generating excess GH exposure. Because patterned infusions of somatostatin can elicit rebound bursts of GH (36), we repeatedly injected octreotide (50 ng/mouse every 12 h), a long lasting somatostatin agonist, to Cry–/– males. This treatment also rescues a male pattern of liver gene expression in the mutant mice (Fig. 6), and confirms that rhythmic activation of the GH axis, with regular and sustained low trough values of GH, is responsible for the reversal of the feminized phenotype of the Cry–/– male liver.
FIGURE 6.
Patterned GH pulses reverse the feminized phenotype of Cry–/– males. Liver gene expression was assessed at ZT4 in Cry–/– males that received two subcutaneous injections a day, at ZT0 and ZT12 during 1 week, of saline (n = 4), 50 μg of highly purified pituitary bovine GH (bGH, n = 5), or 50 ng of octreotide (n = 5), and untreated control males (n = 5). Both hormonal treatments restored a control-like expression pattern in the liver of Cry–/– males. **, p < 0.01 and *, p < 0.05 as compared with NaCl, Mann-Whitney U test. WT, wild type.
DISCUSSION
Circadian Timekeeping as a Regulator of Ultradian GH Release—Altogether, our data reveal Cry1 and Cry2 as genetic determinants of sexual dimorphism in liver metabolism. The presence of functional CRY products appears essential for tuning the ultradian GH pulsatility required for the male-specific liver activity. Similarly, previous studies reported that the circadian clock gene Bmal1 is also necessary to maintain male-female differences in body growth (33) or that liver expression of Elovl3 follows a female-like profile in male homozygous Clock/Clock mutants (19). Moreover, male rats with lesioned SCN exhibit a feminized steroid metabolism (37), as we observed for Cry–/– mice. Last, the alteration of circadian timekeeping during aging (34) is concomitant with dampening of the GH pulsatility (35) and leads to the feminization of liver gene expression in rats (27) and mice (this study). Thus, although we cannot exclude a non-circadian role for Cry genes, we conclude that the feminized phenotype of Cry–/– males is at least partly due to the disruption of their circadian clock.
The SCN transiently synchronize the GH rhythm with the light-dark cycle, likely through somatostatinergic neurons (38, 39), and male rats with SCN lesions present alterations in the amplitude of ultradian GH pulses (39). Thus, the alteration of GH secretion in Cry–/– may result from impaired circadian outputs from their SCN (40). Indeed, the SCN, equipped with receptors for gonadal hormones (15, 16), may indirectly tune the GH secretion profiles responsible for dimorphic liver metabolism.
Another hypothesis, not exclusive from the former one, is that the circadian clockwork within the pituitary gland may synchronize unitary ultradian activities of GH-secreting cells (41, 42) through long distance homotypic cell networks (43, 44). Although such a possibility remains to be investigated, it is worth noting that circadian timekeeping is known to interfere with other rhythms outside the 24-h range, such as ultradian courtship song in flies (45) and infradian estrous cycles in mice (46).
The GH secretion profile in Cry–/– males differs from that of control males, with fewer trough values. However, it remains distinct from the female GH pattern, which exhibits a lower mean level. Thus, Cry–/– males have a unique GH profile that leads to a female-like metabolic pattern. However, this feminization is not complete and underscores the complex regulation of sexually dimorphic liver genes, which mainly involves transduction through the signal transducer and activator of transcription 5b (STAT5b) and hepatic nuclear factor 4 α (HNF4α) pathways (47–49). For example, the expression level of the female-predominant gene Cyp3a41 is not altered in Cry–/– mutants. Interestingly, several genes of the Cyp3a family, including Cyp3a41, were previously reported to be resilient to the inactivation of STAT5b (47) but not of HNF4α (49). Our data may thus define a new paradigm to study the sexually dimorphic action of GH in the mammalian liver through both transduction cascades.
Interrelationship between Circadian Timekeeping, Sex Dimorphism, and Liver Metabolism—Finally, our data reveal that circadian timekeeping may control cell and body metabolism by pacing the secretion of pituitary GH, in addition to the well known direct regulation at the transcription level in liver cells (7, 8). Over the last decades, chronomedecine has been developed, assuming that a circadian control of sensitivity to drugs exists in humans as well as in rodents (7, 50, 51). Interestingly, a recent trial for time-modulated treatment of metastatic colorectal cancer revealed intriguing opposite outcomes for men and women patients (52). Further studies will be necessary to unveil whether our results could be extended to human beings and provide some mechanistic insights into how the circadian time, sex, and metabolism must interact and constitute an undividable troika to optimize personalized therapy.
Acknowledgments
We are indebted to A. F. Parlow (National Institutes of Health, NIDDK, National Hormone and Peptide Program, Torrance, CA) for providing us with bovine GH and reagents for radioimmunoassay. We thank C. Legraverend, F. Gachon, and A.-L. Mausset-Bonnefont for critical reading of the manuscript. D. Haddou, P. Makoundou, N. Oueslati, and S. Faibie are acknowledged for technical assistance.
This work was supported by the Netherlands Organization for Scientific Research Grant ZonMW Vici 918.36.619 to G. T. J. v. d. H., a Marie Curie European Reintegration Grant from the European Community (to X. B.), a grant from the Région Languedoc-Roussillon (to P. M.), a grant from the Institut National de la Santé et de la Recherche Médicale (to P. M. and X. B.), and a grant from the Centre National de la Recherche Scientifique (to P. M. and X. B.).
Footnotes
The abbreviations used are: SCN, suprachiasmatic nuclei; Cry, Cryptochrome; Cyp, cytochrome P450; GH, growth hormone; OHT, hydroxylated testosterone; MUP, major urinary protein; STAT5b, signal transducer and activator of transcription 5b; ZT, zeitgeber time; ANOVA, analysis of variance.
I. M. Bur, A. M. Cohen-Solal. and X Bonnefont, unpublished observations.
References
- 1.Rinn, J. L., Rozowsky, J. S., Laurenzi, I. J., Petersen, P. H., Zou, K., Zhong, W., Gerstein, M., and Snyder, M. (2004) Dev. Cell 6 791–800 [DOI] [PubMed] [Google Scholar]
- 2.Yang, X., Schadt, E. E., Wang, S., Wang, H., Arnold, A. P., Ingram-Drake, L., Drake, T. A., and Lusis, A. J. (2006) Genome Res. 16 995–1004 [DOI] [PMC free article] [PubMed] [Google Scholar]
- 3.Ahluwalia, A., Clodfelter, K. H., and Waxman, D. J. (2004) Mol. Endocrinol. 18 747–760 [DOI] [PubMed] [Google Scholar]
- 4.Rinn, J. L., and Snyder, M. (2005) Trends Genet. 21 298–305 [DOI] [PubMed] [Google Scholar]
- 5.Isensee, J., and Ruiz Noppinger, P. (2007) Gend. Med 4 Suppl. B, S75–S95 [DOI] [PubMed] [Google Scholar]
- 6.Schwartz, J. B. (2003) Clin. Pharmacokinet. 42 107–121 [DOI] [PubMed] [Google Scholar]
- 7.Gachon, F., Olela, F. F., Schaad, O., Descombes, P., and Schibler, U. (2006) Cell Metab 4 25–36 [DOI] [PubMed] [Google Scholar]
- 8.Panda, S., Antoch, M. P., Miller, B. H., Su, A. I., Schook, A. B., Straume, M., Schultz, P. G., Kay, S. A., Takahashi, J. S., and Hogenesch, J. B. (2002) Cell 109 307–320 [DOI] [PubMed] [Google Scholar]
- 9.Zhang, Y. K., Yeager, R. L., and Klaassen, C. D. (2008) Drug Metab. Dispos. 37 106–115 [DOI] [PMC free article] [PubMed] [Google Scholar]
- 10.Kornmann, B., Schaad, O., Bujard, H., Takahashi, J. S., and Schibler, U. (2007) PLoS Biol. 5 e34. [DOI] [PMC free article] [PubMed] [Google Scholar]
- 11.Lamia, K. A., Storch, K. F., and Weitz, C. J. (2008) Proc. Natl. Acad. Sci. U. S. A. 105 15172–15177 [DOI] [PMC free article] [PubMed] [Google Scholar]
- 12.Daan, S., Damassa, D., Pittendrigh, C. S., and Smith, E. R. (1975) Proc. Natl. Acad. Sci. U. S. A. 72 3744–3747 [DOI] [PMC free article] [PubMed] [Google Scholar]
- 13.Davis, F. C., Darrow, J. M., and Menaker, M. (1983) Am. J. Physiol. 244 R93–R105 [DOI] [PubMed] [Google Scholar]
- 14.Roenneberg, T., Kuehnle, T., Pramstaller, P. P., Ricken, J., Havel, M., Guth, A., and Merrow, M. (2004) Curr. Biol. 14 R1038–1039 [DOI] [PubMed] [Google Scholar]
- 15.Karatsoreos, I. N., Wang, A., Sasanian, J., and Silver, R. (2007) Endocrinology 148 5487–5495 [DOI] [PMC free article] [PubMed] [Google Scholar]
- 16.Vida, B., Hrabovszky, E., Kalamatianos, T., Coen, C. W., Liposits, Z., and Kallo, I. (2008) J. Neuroendocrinol. 20 1270–1277 [DOI] [PubMed] [Google Scholar]
- 17.van der Horst, G. T., Muijtjens, M., Kobayashi, K., Takano, R., Kanno, S., Takao, M., de Wit, J., Verkerk, A., Eker, A. P., van Leenen, D., Buijs, R., Bootsma, D., Hoeijmakers, J. H., and Yasui, A. (1999) Nature 398 627–630 [DOI] [PubMed] [Google Scholar]
- 18.Reinerink, E. J., Doorn, L., Jansen, E. H., and Van Iersel, A. A. (1991) J. Chromatogr. 553 233–241 [DOI] [PubMed] [Google Scholar]
- 19.Anzulovich, A., Mir, A., Brewer, M., Ferreyra, G., Vinson, C., and Baler, R. (2006) J. Lipid Res. 47 2690–2700 [DOI] [PubMed] [Google Scholar]
- 20.Brolinson, A., Fourcade, S., Jakobsson, A., Pujol, A., and Jacobsson, A. (2008) Endocrinology 149 3158–3166 [DOI] [PubMed] [Google Scholar]
- 21.Alvarez, J. D., Hansen, A., Ord, T., Bebas, P., Chappell, P. E., Giebultowicz, J. M., Williams, C., Moss, S., and Sehgal, A. (2008) J. Biol. Rhythms 23 26–36 [DOI] [PMC free article] [PubMed] [Google Scholar]
- 22.Legraverend, C., Mode, A., Wells, T., Robinson, I., and Gustafsson, J. A. (1992) FASEB J. 6 711–718 [DOI] [PubMed] [Google Scholar]
- 23.Jarukamjorn, K., Sakuma, T., Jaruchotikamol, A., Ishino, Y., Oguro, M., and Nemoto, N. (2006) Toxicology 219 97–105 [DOI] [PubMed] [Google Scholar]
- 24.Waxman, D. J., and O'Connor, C. (2006) Mol. Endocrinol. 20 2613–2629 [DOI] [PubMed] [Google Scholar]
- 25.MacLeod, J. N., Pampori, N. A., and Shapiro, B. H. (1991) J. Endocrinol. 131 395–399 [DOI] [PubMed] [Google Scholar]
- 26.Tannenbaum, G. S., and Martin, J. B. (1976) Endocrinology 98 562–570 [DOI] [PubMed] [Google Scholar]
- 27.Dhir, R. N., and Shapiro, B. H. (2003) Proc. Natl. Acad. Sci. U. S. A. 100 15224–15228 [DOI] [PMC free article] [PubMed] [Google Scholar]
- 28.Clark, R. G., Jansson, J. O., Isaksson, O., and Robinson, I. C. (1985) J. Endocrinol. 104 53–61 [DOI] [PubMed] [Google Scholar]
- 29.Low, M. J., Otero-Corchon, V., Parlow, A. F., Ramirez, J. L., Kumar, U., Patel, Y. C., and Rubinstein, M. (2001) J. Clin. Investig. 107 1571–1580 [DOI] [PMC free article] [PubMed] [Google Scholar]
- 30.Norstedt, G., and Palmiter, R. (1984) Cell 36 805–812 [DOI] [PubMed] [Google Scholar]
- 31.Kondratov, R. V., Kondratova, A. A., Gorbacheva, V. Y., Vykhovanets, O. V., and Antoch, M. P. (2006) Genes Dev. 20 1868–1873 [DOI] [PMC free article] [PubMed] [Google Scholar]
- 32.Masuki, S., Todo, T., Nakano, Y., Okamura, H., and Nose, H. (2005) J. Physiol. (Lond.) 566 213–224 [DOI] [PMC free article] [PubMed] [Google Scholar]
- 33.Sun, Y., Yang, Z., Niu, Z., Wang, W., Peng, J., Li, Q., Ma, M. Y., and Zhao, Y. (2006) J. Biomed. Sci. 13 845–851 [DOI] [PubMed] [Google Scholar]
- 34.Hastings, M. H., Reddy, A. B., and Maywood, E. S. (2003) Nat. Rev. Neurosci. 4 649–661 [DOI] [PubMed] [Google Scholar]
- 35.Kuwahara, S., Sari, D. K., Tsukamoto, Y., Tanaka, S., and Sasaki, F. (2004) Brain Res. 998 164–173 [DOI] [PubMed] [Google Scholar]
- 36.Clark, R. G., and Robinson, I. C. (1988) Endocrinology 122 2675–2682 [DOI] [PubMed] [Google Scholar]
- 37.Gustafsson, J. A., Eneroth, P., Hokfelt, T., and Skett, P. (1978) Endocrinology 103 141–151 [DOI] [PubMed] [Google Scholar]
- 38.Davies, J. S., Carter, D. A., and Wells, T. (2004) Endocrinology 145 2950–2958 [DOI] [PubMed] [Google Scholar]
- 39.Willoughby, J. O., and Martin, J. B. (1978) Brain Res. 151 413–417 [DOI] [PubMed] [Google Scholar]
- 40.Albus, H., Bonnefont, X., Chaves, I., Yasui, A., Doczy, J., van der Horst, G. T., and Meijer, J. H. (2002) Curr. Biol. 12 1130–1133 [DOI] [PubMed] [Google Scholar]
- 41.Bonnefont, X., Fiekers, J., Creff, A., and Mollard, P. (2000) Endocrinology 141 868–875 [DOI] [PubMed] [Google Scholar]
- 42.Bonnefont, X., and Mollard, P. (2003) FEBS Lett. 548 49–52 [DOI] [PubMed] [Google Scholar]
- 43.Bonnefont, X., Lacampagne, A., Sanchez-Hormigo, A., Fino, E., Creff, A., Mathieu, M. N., Smallwood, S., Carmignac, D., Fontanaud, P., Travo, P., Alonso, G., Courtois-Coutry, N., Pincus, S. M., Robinson, I. C., and Mollard, P. (2005) Proc. Natl. Acad. Sci. U. S. A. 102 16880–16885 [DOI] [PMC free article] [PubMed] [Google Scholar]
- 44.Fauquier, T., Guérineau, N. C., McKinney, R. A., Bauer, K., and Mollard, P. (2001) Proc. Natl. Acad. Sci. U. S. A. 98 8891–8896 [DOI] [PMC free article] [PubMed] [Google Scholar]
- 45.Kyriacou, C. P., and Hall, J. C. (1980) Proc. Natl. Acad. Sci. U. S. A. 77 6729–6733 [DOI] [PMC free article] [PubMed] [Google Scholar]
- 46.Miller, B. H., Olson, S. L., Turek, F. W., Levine, J. E., Horton, T. H., and Takahashi, J. S. (2004) Curr. Biol. 14 1367–1373 [DOI] [PMC free article] [PubMed] [Google Scholar]
- 47.Clodfelter, K. H., Holloway, M. G., Hodor, P., Park, S. H., Ray, W. J., and Waxman, D. J. (2006) Mol. Endocrinol. 20 1333–1351 [DOI] [PubMed] [Google Scholar]
- 48.Holloway, M. G., Laz, E. V., and Waxman, D. J. (2006) Mol. Endocrinol. 20 647–660 [DOI] [PubMed] [Google Scholar]
- 49.Wiwi, C. A., Gupte, M., and Waxman, D. J. (2004) Mol. Endocrinol. 18 1975–1987 [DOI] [PubMed] [Google Scholar]
- 50.Gorbacheva, V. Y., Kondratov, R. V., Zhang, R., Cherukuri, S., Gudkov, A. V., Takahashi, J. S., and Antoch, M. P. (2005) Proc. Natl. Acad. Sci. U. S. A. 102 3407–3412 [DOI] [PMC free article] [PubMed] [Google Scholar]
- 51.Levi, F., and Schibler, U. (2007) Annu. Rev. Pharmacol. Toxicol. 47 593–628 [DOI] [PubMed] [Google Scholar]
- 52.Giacchetti, S., Bjarnason, G., Garufi, C., Genet, D., Iacobelli, S., Tampellini, M., Smaaland, R., Focan, C., Coudert, B., Humblet, Y., Canon, J. L., Adenis, A., Lo Re, G., Carvalho, C., Schueller, J., Anciaux, N., Lentz, M. A., Baron, B., Gorlia, T., and Levi, F. (2006) J. Clin. Oncol. 24 3562–3569 [DOI] [PubMed] [Google Scholar]


