Abstract
4-Hydroxynonenal (HNE) is a pro-apoptotic electrophile generated during the spontaneous decomposition of oxidized lipids. We have previously shown that HNE activates the transcription factor, heat shock factor 1 (HSF1), and promotes cytoprotective heat shock gene expression and that silencing HSF1 sensitizes the colon cancer cell line RKO to HNE-induced apoptosis. Here we report a reduction in the anti-apoptotic proteins Bcl-XL, Mcl-1, and Bcl-2 in HSF1-silenced RKO cells, and we examine the underlying mechanism. To investigate the regulation of the Bcl-2 family by HSF1, microarray analysis of gene expression was performed. We observed that the Hsp70 co-chaperone, BAG3 (Bcl-2-associated athanogene domain 3), is strongly induced by HNE in control but not in HSF1-silenced colon cancer cells. Silencing BAG3 expression with small interfering RNA caused a dramatic reduction in Bcl-XL, Mcl-1, and Bcl-2 protein levels in colon cancer cells and increased apoptosis, similar to the effect of silencing HSF1. Also, immunoprecipitation experiments indicate specific interactions between BAG3, Hsp70, and the Bcl-2 family member, Bcl-XL. Overall, our data reveal that BAG3 is HSF1-inducible and has a unique role facilitating cancer cell survival during pro-apoptotic stress by stabilizing the level of Bcl-2 family proteins.
The indiscriminate oxidation of biological membranes is increasingly recognized as a contributing factor in a variety of neurodegenerative and inflammatory diseases, including Alzheimer and Parkinson diseases, atherosclerosis, diabetes, alcoholic liver disease, and cancer (1–5). An established route for lipid oxidation involves hydrogen atom abstraction from unsaturated fatty acids by reactive oxidants, followed by reaction with oxygen to form lipid hydroperoxides (6). Various electrophiles, including the α,β-unsaturated aldehyde 4-hydroxynonenal (HNE),2 are generated from the nonenzymatic decomposition of lipid hydroperoxides (7). HNE is a diffusible lipid species and is capable of reacting with nucleophiles throughout the cell, such as glutathione, nucleic acids, and proteins (8).
HNE promotes apoptosis in mammalian cells at low to mid-micromolar concentrations (9–11). In response to HNE, cells also activate cytoprotective pathways that abrogate programmed cell death. Microarray analysis of gene expression highlights the variety of protective measures activated in response to HNE, including DNA damage, antioxidant, heat shock, and ER stress pathways (12). The heat shock response, mediated by the transcription factor HSF1, is strongly activated in HNE-treated cells. We previously reported that HNE elicits the nuclear translocation of HSF1 and promotes Hsp40 (DNAJB1) and Hsp72 (HspA1A) expression (13). Using siRNA to silence HSF1, we found that cells deficient in heat shock gene expression are dramatically sensitized to the pro-apoptotic effects of HNE. Investigating the mechanism of cell death in HSF1-silenced cells, we discovered that Bcl-XL protein levels are significantly reduced, thereby predisposing the cells to apoptosis.
The purpose of this investigation was to determine the mechanism by which HSF1 affects the level of anti-apoptotic Bcl-2 family members in colon cancer cells. Microarray analysis of gene expression suggests a potential role for the HSF-regulated protein, Bcl-2 associated athanogene domain 3 (BAG3), in the cellular response to HNE challenge. Biochemical investigations indicate that BAG3 protects cancer cells from apoptosis by stabilizing Bcl-XL, Mcl-1, and Bcl-2.
EXPERIMENTAL PROCEDURES
Cell Culture and Treatment—Colon cancer (RKO) and normal colon cells (CCD-112CoN) were obtained from ATCC. RKO cells were cultured in Dulbecco's modified Eagle's medium (Invitrogen) supplemented with 10% fetal bovine serum (Atlas Biologicals). CCD-112CoN cells were cultured in minimum Eagles medium (Invitrogen) supplemented with 10% fetal bovine serum and 2 mm l-glutamine. Cells were grown in humidified cell culture incubators under 5% CO2, 95% air. HNE was synthesized by the laboratory of Ned Porter at the Vanderbilt Chemistry Department and re-constituted in DMSO for experiments. HNE was quantified by UV-visible spectroscopy using a molar extinction coefficient of 13,750 m-1 cm-1 at 223 nm. HNE or DMSO (vehicle control) was added to cell culture medium to achieve a final concentration of 0.1% DMSO and incubated for the indicated lengths of time.
siRNA Transfections—Transfections were performed using 0.2 nmol of Stealth (Invitrogen) siRNA per 107 cells (HSF1 sense sequence, 5′-CGGAUUCAGGGAAGCAGCUGGUGCA-3′; BAG3 sense sequence, 5′-AACAGGUGCAGUUUCUCGAUGGGUC-3′) and Lipofectamine 2000 (Invitrogen) according to the manufacturer's protocol. Transfections were performed in Opti-MEM for 4 h. After an additional 24 h, cells were split and allowed to adhere overnight. Cells were transfected a second time with siRNA using the same protocol, then split into the appropriate format (10-cm dishes or 96-well plates), and allowed 24 h to adhere before performing the experiment.
Plasmid Constructs—cDNA clones of BAG3 (Mammalian Gene Collection accession number BC006418) and BCLXL (Mammalian Gene Collection accession number accession BC019307) were obtained from the Vanderbilt Microarray Shared Resource cDNA clone collection. BAG3 was excised from pOTB7 using EcoRI and XhoI, and subsequently digested with Hsp92I. The resulting 2.3-kb fragment was ligated into the EcoRV and XhoI sites of pCR3.1 (Invitrogen) along with a double-stranded oligonucleotide encoding an N-terminal methionine plus the FLAG tag (MDYKDDDDK). BCLXL was PCR-amplified from pOTB7 using the primers 5′-TAATACGACTCACTATAGG-3′ and 5′-GGATATCTTTCCGACTGAAGAGTGAGC-3′. The PCR product was digested with EcoRI and EcoRV and ligated into pcDNA3.1 Hygro(+) (Invitrogen) along with a double-stranded oligonucleotide encoding the c-Myc tag plus a stop codon (EQKLISEEDL). Sequences were confirmed at the Vanderbilt DNA Sequencing Facility. Cells were transfected using 5 μg of either the expression construct or empty vector using Lipofectamine 2000 (Invitrogen). After 24 h cells were split into media containing either 800 μg/ml G418 (for pCR3.1) or 250 μg/ml hygromycin (for pcDNA3.1 Hygro(+)), and stably expressing clones were selected for 2–3 weeks prior to conducting experiments.
Total Protein Extraction and Western Blotting—Total proteins were collected using M-PER lysis buffer (Thermo) containing mammalian protease inhibitors and phosphatase inhibitor mixtures I and II (Sigma). Lysates were centrifuged at 14,000 × g for 30 min and stored at -80 °C. Protein concentrations were determined by the Bradford assay (Bio-Rad). For Western blotting, equal quantities of protein was resolved by SDS-PAGE and transferred onto a 0.2-μm nitrocellulose membrane. Membranes were blocked (20 mm Tris, pH 7.6, 140 mm NaCl, 0.05% Tween 20, 5% nonfat dry milk) prior to incubation with antibodies. Luminol-based detection was performed using SuperSignal West Pico reagents (Thermo Scientific). Primary antibodies were obtained from the following sources: Bcl-2, Bcl-XL, pro-caspase 3, cleaved caspase 3, and c-Myc tag from Cell Signaling; Mcl-1, BAG3, and Hsp70 from BD Biosciences; HSF1, actin, and all secondary antibodies from Santa Cruz Biotechnology.
Immunoprecipitation—Total protein lysate (400 μg) in M-PER buffer with protease inhibitors was incubated at 4 °C overnight on a tube rotator with 40 μl of either anti-FLAG-agarose bead slurry (Sigma) or anti-c-Myc-agarose bead slurry (Sigma). Following three washes with phosphate-buffered saline and elution in 40 μl of SDS loading buffer, 5% β-mercaptoethanol was added, and samples were resolved by SDS-PAGE and analyzed by Western blot.
Viability Assays—Cells were seeded in 96-well plates at a density of 7.5 × 10³ per well, allowed to adhere overnight, and then treated with DMSO or HNE (10–100 μm). After 48 h, cells were washed once with phosphate-buffered saline and then 2 μm calcein-AM (Molecular Probes) in phosphate-buffered saline was added and incubated at 20 °C for 30 min. Fluorescence was then read using a SpectraMax multiwell plate reader (Molecular Devices) with λex = 494 nm, λem = 517 nm.
RNA Sample Preparation—Cells were scraped and collected by centrifugation, and cell pellets were resuspended in 1 ml of TRIzol (Sigma) and incubated at 20 °C for 5 min, and then 200 μl of CHCl3 was added and mixed by vigorous shaking. After centrifugation at 14,000 × g for 10 min at 4 °C, the aqueous phase was transferred to a separate 1.5-ml tube, and an equal volume of 70% EtOH was added. Total RNA was then isolated using the RNeasy collection kit (Qiagen). Digestion of DNA was performed using DNA-free reagent (Ambion). RNA samples were quantified by absorbance at λ260 and λ280 and diluted in nuclease-free water to 100 ng/μl. Samples were stored at -80 °C until further analysis.
Microarray Analysis—RNA samples were submitted in triplicate samples for each condition (control siRNA - HNE; control siRNA + HNE; HSF1 siRNA - HNE; HSF1 siRNA + HNE) to the Vanderbilt Shared Microarray Resource. First and second strand synthesis, followed by two rounds of SPIA amplification to generate cDNA, was performed using WT-Ovation FFPE System V2 (Nugen). Fragmentation and biotinylation were completed using FL-Ovation cDNA Biotin Module V2 (Nugen). Hybridization was performed against the Affymetrix GeneChip Human Gene 1.0 ST array and scanned using an Affymetrix GeneChip Scanner 3000. Raw data were processed using Expression Console software (Affymetrix) using default RMA parameters. Statistical analysis of expression data was performed using an HTML-based tool at the National Institute on Aging (14). Data were analyzed using the following parameters: threshold z-value = 8; analysis of variance error model = maximum of averaged and actual error variance; size of window for variance averaging = 500; percentage of highest variance values removed before variance averaging = 10%; false discovery rate = 0.05; fold-change threshold = 1.5.
Real Time PCR Analysis—1 μg of total RNA was reverse-transcribed in a 20-μl reaction using iScript (Bio-Rad). 10% of each reaction (2 μl) was used per well in subsequent real time PCR analysis using iQ SYBR Green Supermix (Bio-Rad). Real time reactions were performed on a Bio-Rad iCycler. Standard curves were generated by the amplification of target sequences previously cloned into pGEM-T (Promega), in dilution series from 10-1 to 10-6 fmol of target sequence per well. Real time PCR primers include the following: HSF1 (upper, 5′-CCGGCGGGAGCATAGACGAGAGG-3′; lower, 5′-GACGGAGGCGGGGGCAGGTTCACT-3′); BAG3 (upper, 5′-CATTGATGTCCCAGGTCAAG-3′; lower, 5′-ATCGGTTCCGAGTCTGATTT-3′); BCLXL (upper, 5′-GGTACCGGCGGGCATTCAGTG-3′; lower, 5′-AAGTATCCCAGCCGCCGTTCTCC-3′); MCL1 (upper, 5′-CGACCCCCGCGAGGCTGCTTTTCT-3′; lower, 5′-CTGGCGGCGGCGTCGAGGGTAGT-3′); and BCL2 (upper, 5′-ACGGGGTGAACTGGGGGAGGATTG-3′; lower, 5′-TGTTTGGGGCAGGCATGTTGACTT-3′).
RESULTS
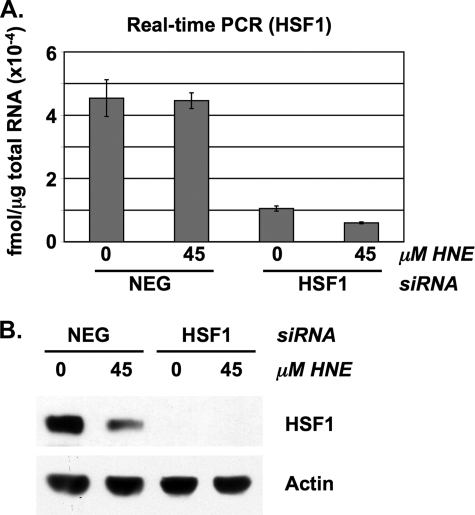
Microarray Analysis of HSF1-silenced Cells—To determine the contribution of HSF1-mediated gene expression in the anti-apoptotic response to HNE, a combination of siRNA and microarray analysis was used. Colon carcinoma cells (RKO) were transfected with either negative control or HSF1-specific siRNA. To confirm silencing of HSF1 expression at the mRNA and protein levels, cell lysates were examined by real time PCR and Western blot, respectively (Fig. 1). For microarray studies, siRNA-transfected cells were treated with either vehicle (DMSO) or 45 μm HNE for 6 h. We have previously demonstrated that the 6-h time point is optimal for examining the HSF1-mediated transcriptional response to HNE (13). Although the effects of HNE on cellular viability are not obvious by visual inspection at 6 h, significant changes in gene expression have occurred that either mediate the commitment toward cell death or abrogate this process through cytoprotective measures. Global changes in gene expression were analyzed using the Affymetrix GeneChip Human Gene 1.0 ST array, representing 28,869 transcripts. Parameters for statistical analysis were set at a false discovery rate of 0.05 and a fold-change threshold of 1.5. Comparing gene expression in HNE-treated cells, we identified 567 overexpressed and 994 underexpressed genes in HSF1-silenced versus control cells. The 100 most overexpressed and 100 most underexpressed genes with RefSeq entries and Gene Ontology descriptors are listed in supplemental Tables SI and SII, respectively. In contrast to HNE-treated cells, in samples collected from vehicle-treated cells, we observed only 84 overexpressed and 85 underexpressed genes. Gene expression data are available in the Gene Expression Omnibus data base, www.ncbi.nlm.nih.gov (accession number GSE12762). Data were further analyzed using Gene Map Annotator and Pathway Profiler (GenMAPP 2.1), open source software that facilitates the comparison of microarray data in the context of biological processes and disease (15). Also, for visual representation of data, heat maps of differential gene expression were generated using functional genomics widgets installed in the Orange data analysis framework (16).
FIGURE 1.
Silencing HSF1 expression using siRNA. RKO cells were transfected with either negative control (NEG) or HSF1 siRNA and subsequently treated with DMSO (0) or 45 μm HNE. A, real time PCR analysis of HSF1 mRNA expression. Total RNA was extracted after 6 h of treatment and analyzed by real time PCR. Data represent femtomoles of transcript per μg of total RNA. Error bars indicate mean values ± S.D. of four replicates. B, total protein lysates were collected after 8 h and analyzed by Western blot for HSF1 expression. Actin was included as a loading control.
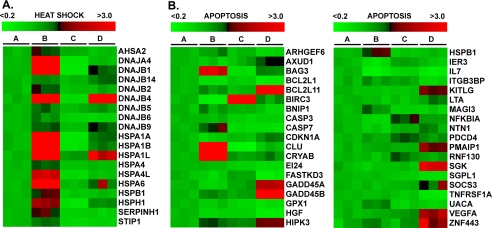
Gene ontology analysis of microarray data from HNE-treated cells revealed that silencing HSF1 reduced the expression of several genes with protein folding or chaperone activities. The spectrum of heat shock proteins whose expression depends on HSF1 is illustrated as a heat map in Fig. 2A. In HSF1-silenced cells, a significant decrease in the HNE-mediated induction of DnaJ co-chaperones was observed, including the following isoforms: DNAJA4; DNAJB1 (Hsp40); DNAJB2; DNAJB4; DNAJB5 (Hsc40); and DNAJB6. Curiously, some DnaJ members, including DNAJB9 and DNAJB14, were moderately induced by HNE but were not attenuated by silencing HSF1, implying that their transcriptional induction is mediated by factors other than HSF1. In addition, the expression of several HSP isoforms was diminished in HSF1-silenced cells, including the following: HSPA1A (Hsp72); HSPA1L; HSPA4; HSPA4L; HSPA6; HSPB1 (Hsp27); and HSPH1 (Hsp105/110).
FIGURE 2.
Heat map representation of microarray data for heat shock gene expression (A) and apoptosis gene expression (B). RKO cells were transfected with either negative control (NEG) or HSF1 siRNA, and RNA samples were analyzed by Affymetrix GeneChip in triplicate for each condition (lane A, negative control + DMSO; lane B, negative control + 50 μm HNE; lane C, HSF1 + DMSO; lane D, HSF1 + 50 μm HNE). A, heat map representing heat shock protein gene expression. Data represent genes with ≥1.5-fold-change, and a false discovery rate ≤0.05.
We hypothesized that an HSF1-inducible gene product inhibits Bcl-XL protein turnover, and that increased Bcl-XL levels limit apoptosis in HNE-treated cells. Interrogating expression data with GenMAPP 2.1, we identified several genes involved in apoptosis (Fig. 2B). There was an enhanced expression of multiple pro-apoptotic genes, including the following: BCL2L11 (Bim); CDKN1A (p21Waf1/Cip1); LTA; GADD45A; GADD45B; and PMAIP1 (NOXA), reflecting increased apoptosis in HSF1-silenced cells. We also identified HSF1-dependent genes, induced by HNE in control cells but not in HSF1-silenced cells. These include BAG3, CASP7, CLU, CRYAB, and HSPB1. Because BAG3 is anti-apoptotic and is a Bcl-2 interacting protein, we suspected it might explain the effect of silencing HSF1 on Bcl-XL turnover.
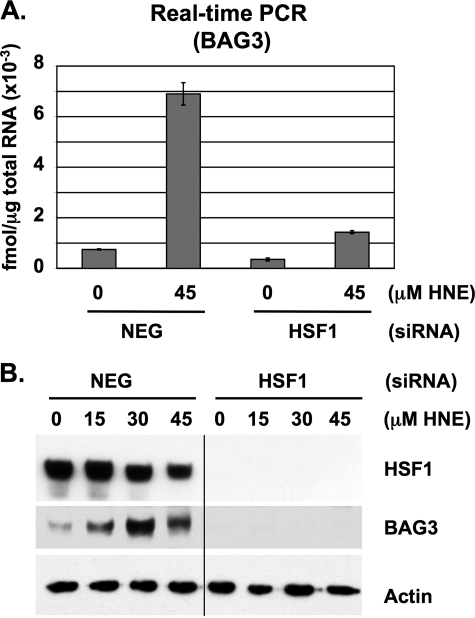
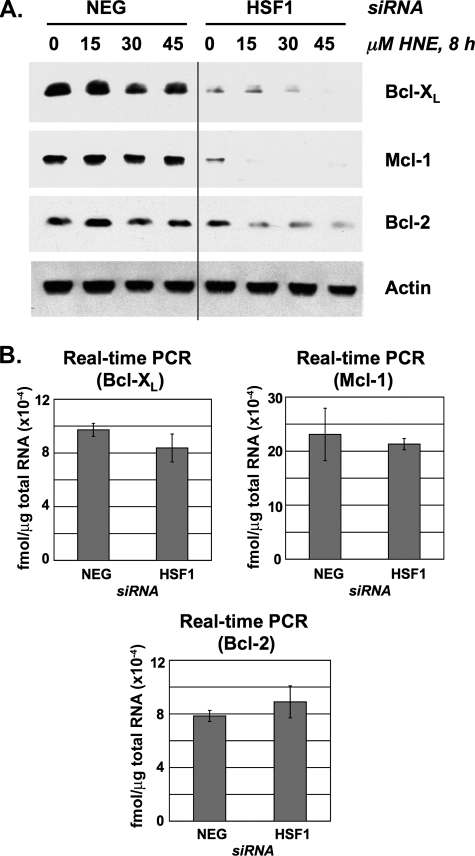
Effect of HSF1 siRNA on BAG3, Bcl-XL, Mcl-1, and Bcl-2 Expression—Real time PCR analysis of BAG3 mRNA levels confirmed that HNE promotes BAG3 transcriptional expression in control but not in HSF1-silenced RKO cells (Fig. 3A). Similarly, Western blot analysis confirmed that HNE causes a similar increase in BAG3 protein levels that is attenuated in HSF1-silenced cells (Fig. 3B). BAG3 has been suggested to prevent apoptosis by limiting the proteasome-mediated turnover of anti-apoptotic proteins, but the identity of these targets has not been determined (17). We previously showed that HSF1-silenced cells express diminished levels of Bcl-XL, causing an increased sensitivity to apoptosis (13). Here, we repeat our previous observations with Bcl-XL, and we also identify significant decreases in Mcl-1 and Bcl-2 expression in HSF1-silenced RKO cells (Fig. 4A). The reduction in Bcl-2 protein expression was less pronounced than the decrease in Bcl-XL and Mcl-1 levels. This is perhaps because of higher basal expression of Bcl-2 or perhaps a slower rate of Bcl-2 protein turnover in comparison with Bcl-XL and Mcl-1. In contrast to the decrease in protein levels, real time PCR analysis revealed that Bcl-XL, Mcl-1, and Bcl-2 mRNA expression was not affected by silencing HSF1 (Fig. 4B). Therefore, the reduction in Bcl-XL, Mcl-1, and Bcl-2 in HSF1-silenced cells appears to be due to an effect on protein turnover, and not a consequence of reduced gene transcription or mRNA stability.
FIGURE 3.
Effect of HSF1 siRNA on BAG3 expression. A, real time PCR analysis of BAG3 mRNA levels. Total RNA was extracted from RKO cells treated for 6 h and analyzed by real time PCR. Data represent femtomoles of transcript per μg of total RNA. Error bars indicate mean values ± S.D. of four replicates. B, total protein lysates were collected after 8 h and analyzed by Western blot for HSF1 and BAG3 expression. Actin was included as a loading control.
FIGURE 4.
Effect of HSF1 siRNA on Bcl-XL, Mcl-1, and Bcl-2 levels. A, RKO cells were transfected with either negative control (NEG) or HSF1 siRNA then treated with DMSO or HNE. Total protein lysates were collected after 8 h and analyzed by Western blot for Bcl-XL, Mcl-1, and Bcl-2. B, total RNA was extracted from untreated cells and analyzed by real time PCR. Data represent femtomoles of transcript per μg of total RNA. Error bars indicate mean values ± S.D. of four samples for each condition.
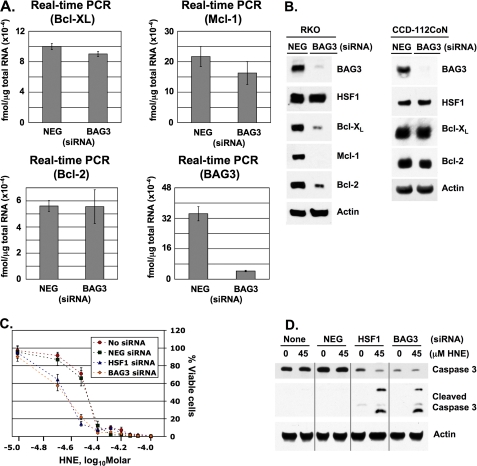
Silencing BAG3 Causes Diminished Levels of Bcl-XL, Mcl-1, and Bcl-2 and Facilitates Apoptosis—We investigated whether attenuated BAG3 expression was responsible for the concomitant decreases in Bcl-XL, Mcl-1, and Bcl-2 protein levels in HSF1-silenced cells. Accordingly, siRNA was used to silence BAG3, and the effect on the expression of Bcl-2 family proteins and cellular viability was examined. Real time PCR and Western blot analysis show a significant reduction in BAG3 mRNA and protein levels in cells transfected with BAG3-specific siRNA (Fig. 5A). Silencing BAG3 did not affect Bcl-XL, Mcl-1, or Bcl-2 mRNA, but it did result in diminished levels of Bcl-XL, Mcl-1, and Bcl-2 proteins (Fig. 5B). This effect is similar to silencing HSF1, implying that deficient BAG3 expression in HSF1-silenced cells accounts for the reduced level of Bcl-2 family proteins. Also, BAG3 siRNA did not affect HSF1 protein expression, confirming that BAG3 is functionally downstream of HSF1.
FIGURE 5.
Effect of BAG3 siRNA on Bcl-XL, Mcl-1, and Bcl-2 levels and cellular viability. A, RKO cells were transfected with either negative control (NEG) or BAG3 siRNA. Total RNA was analyzed by real time PCR. Data represent femtomoles of transcript per μg of total RNA. Error bars indicate mean values ± S.D. of four samples for each condition. B, total protein lysates from RKO cells and CCD-112CoN cells were analyzed by Western blot for BAG3, HSF1, Bcl-XL, Mcl-1, and Bcl-2 levels. Actin was included as a loading control. C, RKO cells were either not transfected or transfected with negative control (NEG), HSF1, or BAG3 siRNA, and sensitivity to HNE-mediated apoptosis was assessed in a 96-well plate format. Cells were treated for 48 h with HNE prior to measuring viability. HNE is represented as log10 molar concentration, and % viable cells represents mean calcein-AM fluorescence ± S.D. for eight replicates. D, nontransfected and siRNA-transfected RKO cells were treated for 24 h with DMSO (0) or 45 μm HNE. Total protein lysates were analyzed by Western blot for caspase 3 (uncleaved procaspase 3) and caspase 3 cleavage fragments. Actin was included as a loading control.
To evaluate the relative importance of BAG3 expression in the control of Bcl-2 family proteins in cancer cells and normal cells, we tested the normal colon cell line, CCD-112CoN. Cells were transfected with either control siRNA or BAG3 siRNA. Total proteins lysates were examined by Western blot, showing a significant reduction in BAG3 levels (Fig. 5B). In contrast to RKO cells, silencing BAG3 in CCD-112CoN cells did not affect Bcl-XL or Bcl-2 protein levels. Mcl-1 protein expression was not detected in either control siRNA or BAG3 siRNA-transfected cells.
We had previously observed that silencing HSF1 sensitizes colon cancer cells to HNE-induced apoptosis. Because silencing BAG3 causes a similar decrease in Bcl-2 family proteins, we hypothesized that BAG3 siRNA would also sensitize colon cancer cells to HNE. We compared cellular viability following HNE addition to nontransfected, control siRNA, HSF1 siRNA, and BAG3 siRNA-transfected RKO cells. HNE was added in concentrations ranging from 10 to 100 μm, and cellular viability was measured after 48 h of treatment. In both nontransfected and control siRNA-transfected cells, the LC50 (the concentration causing a 50% reduction in cell viability) of HNE was 45 μm (Fig. 5C). However, in HSF1- and BAG3-silenced cells, the LC50 of HNE was reduced to 25 μm. Also, treating cells with 45 μm HNE for 24 h induced caspase 3 cleavage in both HSF1- and BAG3-silenced cells, but not in the nontransfected or control siRNA-transfected cells (Fig. 5D), confirming that HSF1 siRNA and BAG3 siRNA both sensitize RKO cells to apoptosis to a similar degree.
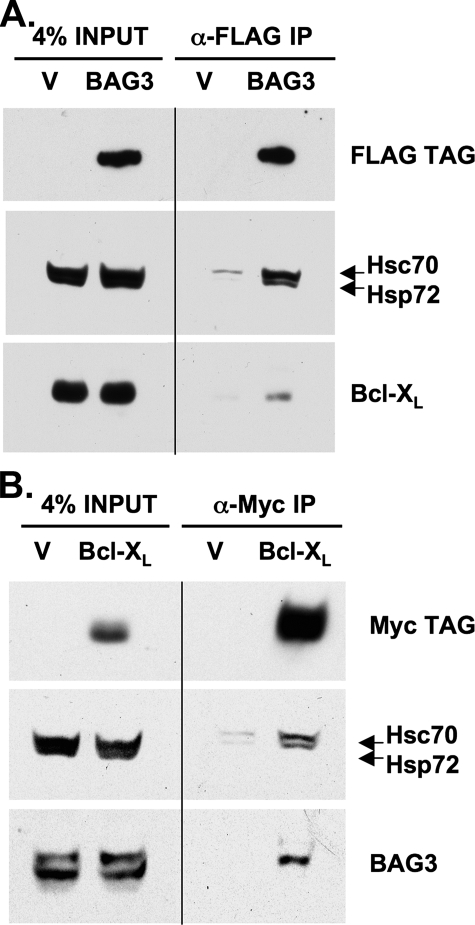
Co-immunoprecipitation of BAG3, Bcl-XL, and Hsp70—Although BAG3 is known to inhibit apoptosis in cancer cells, the underlying mechanism is less clear (17). We speculate that in cooperation with Hsp70, BAG3 acts to support the expression of anti-apoptotic Bcl-2 proteins, particularly in cells experiencing heat shock or chemical stress, where BAG3 levels are highly induced. BAG3 has been shown previously to interact with Bcl-2 in co-immunoprecipitation (co-IP) studies (18, 19). To investigate if BAG3 also interacts with Bcl-XL and Mcl-1, we generated a FLAG-tagged BAG3 expression construct and performed co-IP studies. Immunoprecipitation of the FLAG epitope resulted in co-IP of endogenous Hsp70 (Hsc70/Hsp72) from BAG3-FLAG lysates, but not from control (vector-expressing) lysates (Fig. 6A), substantiating the known function of BAG3 as an Hsp70 co-chaperone. In addition, native Bcl-XL was recovered from BAG3-FLAG cell lysates by co-IP but not from control, suggesting a specific interaction of BAG3 with endogenous Bcl-XL. Although we did not detect an interaction between FLAG-tagged BAG3 and Mcl-1 by co-IP, we suspect this is because of the relatively low expression of Mcl-1 in RKO cells. To confirm our observations we performed the reciprocal co-IP, using a c-Myc-tagged Bcl-XL expression construct. Immunoprecipitation of the c-Myc epitope resulted in co-IP of endogenous Hsp70 (Hsc70 and Hsp72) in lysates from Bcl-XL-Myc expressing cells but not from control (Fig. 6B). In addition, native BAG3 was recovered from Bcl-XL-Myc lysates by co-IP but not from control. These data therefore imply the existence of a multiprotein complex between BAG3, Hsp70, and Bcl-XL.
FIGURE 6.
Co-immunoprecipitation of BAG3, Bcl-XL, and Hsp70. A, total protein lysates were collected from RKO cells expressing either empty pCR3.1 vector (V) or BAG3-FLAG (BAG3). For immunoprecipitation, lysate (400 μg) was incubated with anti-FLAG-conjugated beads at 4 °C overnight. Samples were analyzed by Western blot for expression of the FLAG tag epitope, Hsp70 (Hsc70/Hsp72), and Bcl-XL. B, total protein lysates were collected from RKO cells expressing either empty pcDNA3.1 Hygro(+) vector (pcDNA) or Bcl-XL-Myc (Bcl-XL). Lysate (400 μg) was incubated with anti-c-Myc-conjugated beads at 4 °C overnight. Samples were analyzed by Western blot for expression of the c-Myc tag epitope, Hsp70 (Hsc70/Hsp72), and BAG3.
DISCUSSION
HNE is a principal breakdown product of lipid hydroperoxides with a suspected role in a variety of disease processes. HNE conjugates to biological molecules have been used as surrogate markers of HNE generation in vivo, and to correlate HNE with various disease processes. For example, liver samples from rats experiencing oxidative stress show a 5–10-fold increase in the quantity of HNE-glutathione and related metabolites (20). Also DNA and protein adducts of HNE have been detected in a number of diseases, including Alzheimer disease, Parkinson disease, atherosclerosis, alcoholic liver disease, diabetes, and pre-malignant inflammation (21–27).
A variety of cytoprotective pathways are activated in response to HNE, promoting changes in gene expression that facilitate cell survival and recovery from stress (12). For example, HNE activates the transcription factors Nrf2 and HSF1, which mediate the antioxidant and heat shock responses, respectively. This occurs by modification of the inhibitory proteins Keap1 (for Nrf2) or Hsp70 and Hsp90 (for HSF1), causing transcription factor release and translocation into the nucleus (13, 28–30). The heat shock response controls the expression of a conserved set of inducible heat shock proteins, their DnaJ cohorts, and a variety of co-chaperones (31). In this study, using microarray data we identify a large variety of heat shock proteins that are induced in the presence of HNE. In specifically looking for anti-apoptotic gene products, we find that the Hsp70 co-chaperone BAG3 is strongly induced in an HSF1-dependent manner and has a critical role in mitigating apoptosis.
The BAG family of protein co-chaperones (BAG1–6) share a highly conserved BAG domain and regulate diverse cellular processes, including proliferation, migration, and apoptosis (32). The activation of HSF1 has previously been shown to promote the expression of the BAG family member BAG3 (33, 34). We observe that HSF1-regulated BAG3 expression significantly attenuates HNE-mediated apoptosis in colon cancer cells. BAG3 has been shown elsewhere to prevent apoptosis caused by other agents, including micro-injection of Bax DNA or addition of Fas antibody (19). Elevated BAG3 expression is also speculated to mediate tumor cell survival in certain cancers. Accordingly, BAG3 is reportedly overexpressed in pancreatic and thyroid lesions, and it is vital for the maintenance of chronic lymphocytic and acute lymphoblastic leukemias (35–38). During review of this manuscript, silencing of BAG3 was reported to sensitize several human leukemia cell lines to bortezomib-induced cell death (39).
In addition to BAG3, relatively few anti-apoptotic genes were induced by HNE in an HSF1-dependent fashion; these include CLU (clusterin), CRYAB (αB-crystallin), and HSPB1 (Hsp27). Clusterin has been implicated in DNA repair, cell cycle regulation, and apoptosis and is highly expressed in diabetes, cancer, and neurodegenerative diseases (40). Also, tumor-associated expression of clusterin is enhanced in response to androgen ablation therapy, chemotherapy, and radiation (41). The small heat shock proteins αB-crystallin and Hsp27 also have cytoprotective functions and are induced under similar pathological conditions (42).
A principal goal of this study was to ascertain why silencing HSF1 leads to diminished levels of Bcl-XL, Mcl-1, and Bcl-2 in colon cancer cells. Using siRNA to silence BAG3 in RKO cells, we found that Bcl-XL, Mcl-1, and Bcl-2 protein expression was significantly reduced, similar to the effect of silencing HSF1. Notably, their mRNA levels were not affected by knockdown of either HSF1 or BAG3, suggesting that the effect is mediated at the level of protein turnover. Silencing BAG3 in the normal colon cell line, CCD-112CoN, did not cause diminished expression of anti-apoptotic Bcl-2 family members. We suspect this observation may reflect differences in either the rate or mechanism of Bcl-2 protein turnover between cancer cells and normal cells. The generality of this observation between cancer cells and normal cells will have to be established in future experiments, and it will likely determine the interest in BAG3 as a potential anti-neoplastic drug target.
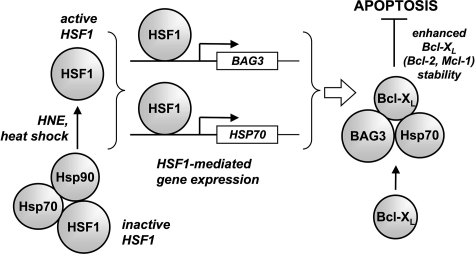
Through its interaction with Hsp70, BAG3 has been shown to inhibit the degradation of various Hsp70 client proteins (43). Our co-IP experiments using epitope-tagged expression constructs suggest that direct interactions exist between BAG3, Hsp70, and Bcl-XL. Accordingly, the scheme that we propose for the cytoprotective mechanism of BAG3 involves the stabilization of anti-apoptotic Bcl-2 family members in a multiprotein complex with BAG3 and Hsp70 (Fig. 7).
FIGURE 7.
Proposed mechanism for the anti-apoptotic actions of BAG3. Dissociation of the inhibitory protein chaperones Hsp70 and Hsp90 leads to the activation HSF1, which promotes the expression of heat shock and oxidized lipid-inducible genes. BAG3 and Hsp70 form a complex with anti-apoptotic Bcl-2 proteins (Bcl-XL shown), preventing turnover and resulting in inhibition of apoptosis.
The anti-apoptotic Bcl-2 family members Bcl-XL, Mcl-1, and Bcl-2 have established roles in an array of diseases. A partial list includes arterial restenosis, rheumatoid arthritis, hepatic carcinoma, multiple myeloma, prostate cancer, and colon cancer (44–50). With the recognition that anti-apoptotic Bcl-2 family members have essential roles in the viability of some cancer cells, aggressive efforts have been undertaken to design or identify small molecule inhibitors (51). A significant challenge has been developing drugs that effectively target each of the anti-apoptotic Bcl-2 family members. For example, resistance among tumor cell lines to the BH3 mimetic ABT-737 correlates with elevated levels of Mcl-1, against which the drug is comparatively less effective (52). An alternative Bcl-2 family inhibitor, apogossypolone, targets Bcl-2 and Mcl-1, but is ∼20-fold less potent against Bcl-XL (53). We propose that BAG3 may represent an alternative target for future drug development, because inhibition of BAG3 results in a combined decrease in the expression of Bcl-XL, Mcl-1, and Bcl-2 in colon cancer cells, and potentially other types of cancer.
Supplementary Material
Acknowledgments
We appreciate the assistance of the Vanderbilt Shared Microarray Resource in performing Affymetrix GeneChip analysis.
This work was supported, in whole or in part, by National Institutes of Health Grant P01ES013125 from NIEHS (Program Project Grant).
The on-line version of this article (available at http://www.jbc.org) contains supplemental Tables S1 and SII.
Footnotes
The abbreviations used are: HNE, 4-hydroxynonenal; HSF1, heat shock factor 1; siRNA, small interfering RNA; co-IP, co-immunoprecipitation.
References
- 1.Albano, E. (2008) Mol. Aspects Med. 29 9-16 [DOI] [PubMed] [Google Scholar]
- 2.Bartsch, H., and Nair, J. (2006) Langenbecks Arch. Surg. 391 499-510 [DOI] [PubMed] [Google Scholar]
- 3.Jenner, P. (2003) Ann. Neurol. 53 Suppl. 3, S26-S38 [DOI] [PubMed] [Google Scholar]
- 4.Montine, K. S., Reich, E., Neely, M. D., Sidell, K. R., Olson, S. J., Markesbery, W. R., and Montine, T. J. (1998) J. Neuropathol. Exp. Neurol. 57 415-425 [DOI] [PubMed] [Google Scholar]
- 5.Negre-Salvayre, A., Coatrieux, C., Ingueneau, C., and Salvayre, R. (2008) Br. J. Pharmacol. 153 6-20 [DOI] [PMC free article] [PubMed] [Google Scholar]
- 6.Porter, N. A., Caldwell, S. E., and Mills, K. A. (1995) Lipids 30 277-290 [DOI] [PubMed] [Google Scholar]
- 7.Schneider, C., Porter, N. A., and Brash, A. R. (2008) J. Biol. Chem. 283 15539-15543 [DOI] [PMC free article] [PubMed] [Google Scholar]
- 8.Schaur, R. J. (2003) Mol. Aspects Med. 24 149-159 [DOI] [PubMed] [Google Scholar]
- 9.Ji, C., Amarnath, V., Pietenpol, J. A., and Marnett, L. J. (2001) Chem. Res. Toxicol. 14 1090-1096 [DOI] [PubMed] [Google Scholar]
- 10.Liu, W., Kato, M., Akhand, A. A., Hayakawa, A., Suzuki, H., Miyata, T., Kurokawa, K., Hotta, Y., Ishikawa, N., and Nakashima, I. (2000) J. Cell Sci. 113 635-641 [DOI] [PubMed] [Google Scholar]
- 11.Zhang, W., He, Q., Chan, L. L., Zhou, F., El Naghy, M., Thompson, E. B., and Ansari, N. H. (2001) Free Radic. Biol. Med. 30 699-706 [DOI] [PubMed] [Google Scholar]
- 12.West, J. D., and Marnett, L. J. (2005) Chem. Res. Toxicol. 18 1642-1653 [DOI] [PubMed] [Google Scholar]
- 13.Jacobs, A. T., and Marnett, L. J. (2007) J. Biol. Chem. 282 33412-33420 [DOI] [PubMed] [Google Scholar]
- 14.Sharov, A. A., Dudekula, D. B., and Ko, M. S. (2005) Bioinformatics (Oxf.) 21 2548-2549 [DOI] [PubMed] [Google Scholar]
- 15.Salomonis, N., Hanspers, K., Zambon, A. C., Vranizan, K., Lawlor, S. C., Dahlquist, K. D., Doniger, S. W., Stuart, J., Conklin, B. R., and Pico, A. R. (2007) BMC Bioinformatics 8 217. [DOI] [PMC free article] [PubMed] [Google Scholar]
- 16.Curk, T., Demsar, J., Xu, Q., Leban, G., Petrovic, U., Bratko, I., Shaulsky, G., and Zupan, B. (2005) Bioinformatics (Oxf.) 21 396-398 [DOI] [PubMed] [Google Scholar]
- 17.Rosati, A., Ammirante, M., Gentilella, A., Basile, A., Festa, M., Pascale, M., Marzullo, L., Belisario, M. A., Tosco, A., Franceschelli, S., Moltedo, O., Pagliuca, G., Lerose, R., and Turco, M. C. (2007) Int. J. Biochem. Cell Biol. 39 1337-1342 [DOI] [PubMed] [Google Scholar]
- 18.Antoku, K., Maser, R. S., Scully, W. J., Jr., Delach, S. M., and Johnson, D. E. (2001) Biochem. Biophys. Res. Commun. 286 1003-1010 [DOI] [PubMed] [Google Scholar]
- 19.Lee, J. H., Takahashi, T., Yasuhara, N., Inazawa, J., Kamada, S., and Tsujimoto, Y. (1999) Oncogene 18 6183-6190 [DOI] [PubMed] [Google Scholar]
- 20.Volkel, W., Alvarez-Sanchez, R., Weick, I., Mally, A., Dekant, W., and Pahler, A. (2005) Free Radic. Biol. Med. 38 1526-1536 [DOI] [PubMed] [Google Scholar]
- 21.Ando, Y., Brannstrom, T., Uchida, K., Nyhlin, N., Nasman, B., Suhr, O., Yamashita, T., Olsson, T., El Salhy, M., Uchino, M., and Ando, M. (1998) J. Neurol. Sci. 156 172-176 [DOI] [PubMed] [Google Scholar]
- 22.Bartsch, H., and Nair, J. (2005) Mutat. Res. 591 34-44 [DOI] [PubMed] [Google Scholar]
- 23.Paradis, V., Kollinger, M., Fabre, M., Holstege, A., Poynard, T., and Bedossa, P. (1997) Hepatology 26 135-142 [DOI] [PubMed] [Google Scholar]
- 24.Sayre, L. M., Zelasko, D. A., Harris, P. L., Perry, G., Salomon, R. G., and Smith, M. A. (1997) J. Neurochem. 68 2092-2097 [DOI] [PubMed] [Google Scholar]
- 25.Toyokuni, S., Yamada, S., Kashima, M., Ihara, Y., Yamada, Y., Tanaka, T., Hiai, H., Seino, Y., and Uchida, K. (2000) Antioxid. Redox. Signal. 2 681-685 [DOI] [PubMed] [Google Scholar]
- 26.Uchida, K., Toyokuni, S., Nishikawa, K., Kawakishi, S., Oda, H., Hiai, H., and Stadtman, E. R. (1994) Biochemistry 33 12487-12494 [DOI] [PubMed] [Google Scholar]
- 27.Yoritaka, A., Hattori, N., Uchida, K., Tanaka, M., Stadtman, E. R., and Mizuno, Y. (1996) Proc. Natl. Acad. Sci. U. S. A. 93 2696-2701 [DOI] [PMC free article] [PubMed] [Google Scholar]
- 28.Cajone, F., and Crescente, M. (1992) Chem. Biol. Interact. 84 97-112 [DOI] [PubMed] [Google Scholar]
- 29.Numazawa, S., Ishikawa, M., Yoshida, A., Tanaka, S., and Yoshida, T. (2003) Am. J. Physiol. 285 C334-C342 [DOI] [PubMed] [Google Scholar]
- 30.Vila, A., Tallman, K. A., Jacobs, A. T., Liebler, D. C., Porter, N. A., and Marnett, L. J. (2008) Chem. Res. Toxicol. 21 432-444 [DOI] [PMC free article] [PubMed] [Google Scholar]
- 31.Moseley, P. L. (1997) J. Appl. Physiol. 83 1413-1417 [DOI] [PubMed] [Google Scholar]
- 32.Doong, H., Vrailas, A., and Kohn, E. C. (2002) Cancer Lett. 188 25-32 [DOI] [PubMed] [Google Scholar]
- 33.Franceschelli, S., Rosati, A., Lerose, R., De Nicola, S., Turco, M. C., and Pascale, M. (2008) J. Cell. Physiol. 215 575-577 [DOI] [PubMed] [Google Scholar]
- 34.Pagliuca, M. G., Lerose, R., Cigliano, S., and Leone, A. (2003) FEBS Lett. 541 11-15 [DOI] [PubMed] [Google Scholar]
- 35.Chiappetta, G., Ammirante, M., Basile, A., Rosati, A., Festa, M., Monaco, M., Vuttariello, E., Pasquinelli, R., Arra, C., Zerilli, M., Todaro, M., Stassi, G., Pezzullo, L., Gentilella, A., Tosco, A., Pascale, M., Marzullo, L., Belisario, M. A., Turco, M. C., and Leone, A. (2007) J. Clin. Endocrinol. Metab. 92 1159-1163 [DOI] [PubMed] [Google Scholar]
- 36.Liao, Q., Ozawa, F., Friess, H., Zimmermann, A., Takayama, S., Reed, J. C., Kleeff, J., and Buchler, M. W. (2001) FEBS Lett. 503 151-157 [DOI] [PubMed] [Google Scholar]
- 37.Romano, M. F., Festa, M., Pagliuca, G., Lerose, R., Bisogni, R., Chiurazzi, F., Storti, G., Volpe, S., Venuta, S., Turco, M. C., and Leone, A. (2003) Cell Death Differ. 10 383-385 [DOI] [PubMed] [Google Scholar]
- 38.Romano, M. F., Festa, M., Petrella, A., Rosati, A., Pascale, M., Bisogni, R., Poggi, V., Kohn, E. C., Venuta, S., Turco, M. C., and Leone, A. (2003) Cancer Biol. Ther. 2 508-510 [DOI] [PubMed] [Google Scholar]
- 39.Liu, P., Xu, B., Li, J., and Lu, H. (2009) FEBS Lett. 583 401-406 [DOI] [PubMed] [Google Scholar]
- 40.Trougakos, I. P., and Gonos, E. S. (2006) Free Radic. Res. 40 1324-1334 [DOI] [PubMed] [Google Scholar]
- 41.Gleave, M., and Chi, K. N. (2005) Ann. N. Y. Acad. Sci. 1058 1-15 [DOI] [PubMed] [Google Scholar]
- 42.Parcellier, A., Schmitt, E., Brunet, M., Hammann, A., Solary, E., and Garrido, C. (2005) Antioxid. Redox. Signal. 7 404-413 [DOI] [PubMed] [Google Scholar]
- 43.Doong, H., Rizzo, K., Fang, S., Kulpa, V., Weissman, A. M., and Kohn, E. C. (2003) J. Biol. Chem. 278 28490-28500 [DOI] [PubMed] [Google Scholar]
- 44.Brocardo, M., Lei, Y., Tighe, A., Taylor, S. S., Mok, M. T., and Henderson, B. R. (2008) J. Biol. Chem. 283 5950-5959 [DOI] [PubMed] [Google Scholar]
- 45.Cavarretta, I. T., Neuwirt, H., Untergasser, G., Moser, P. L., Zaki, M. H., Steiner, H., Rumpold, H., Fuchs, D., Hobisch, A., Nemeth, J. A., and Culig, Z. (2007) Oncogene 26 2822-2832 [DOI] [PubMed] [Google Scholar]
- 46.Fleischer, B., Schulze-Bergkamen, H., Schuchmann, M., Weber, A., Biesterfeld, S., Muller, M., Krammer, P. H., and Galle, P. R. (2006) Int. J. Oncol. 28 25-32 [PubMed] [Google Scholar]
- 47.Liu, H., Eksarko, P., Temkin, V., Haines, G. K., III, Perlman, H., Koch, A. E., Thimmapaya, B., and Pope, R. M. (2005) J. Immunol. 175 8337-8345 [DOI] [PubMed] [Google Scholar]
- 48.Wuilleme-Toumi, S., Robillard, N., Gomez, P., Moreau, P., Le Gouill, S., Avet-Loiseau, H., Harousseau, J. L., Amiot, M., and Bataille, R. (2005) Leukemia (Baltimore) 19 1248-1252 [DOI] [PubMed] [Google Scholar]
- 49.Yang, Z., Gagarin, D., Ramezani, A., Hawley, R. G., and McCaffrey, T. A. (2007) J. Vasc. Res. 44 483-494 [DOI] [PubMed] [Google Scholar]
- 50.Zheng, B., Marinova, E., Switzer, K., Wansley, D., He, H., Bheekha-Escura, R., Behrens, T. W., and Han, S. (2007) J. Immunol. 179 7087-7092 [DOI] [PubMed] [Google Scholar]
- 51.Manion, M. K., Fry, J., Schwartz, P. S., and Hockenbery, D. M. (2006) Curr. Opin. Investig. Drugs 7 1077-1084 [PubMed] [Google Scholar]
- 52.Lin, X., Morgan-Lappe, S., Huang, X., Li, L., Zakula, D. M., Vernetti, L. A., Fesik, S. W., and Shen, Y. (2007) Oncogene 26 3972-3979 [DOI] [PubMed] [Google Scholar]
- 53.Arnold, A. A., Aboukameel, A., Chen, J., Yang, D., Wang, S., Al-Katib, A., and Mohammad, R. M. (2008) Mol. Cancer 7 20. [DOI] [PMC free article] [PubMed] [Google Scholar]
Associated Data
This section collects any data citations, data availability statements, or supplementary materials included in this article.


