Abstract
Nuclear peroxisome proliferator-activated receptor-γ (PPARγ) is required for adipocyte differentiation, but its role in mature adipocytes is less clear. Here, we report that knockdown of PPARγ expression in 3T3-L1 adipocytes returned the expression of most adipocyte genes to preadipocyte levels. Consistently, down-regulated but not up-regulated genes showed strong enrichment of PPARγ binding. Surprisingly, not all adipocyte genes were reversed, and the adipocyte morphology was maintained for an extended period after PPARγ depletion. To explain this, we focused on transcriptional regulators whose adipogenic regulation was not reversed upon PPARγ depletion. We identified GATA2, a transcription factor whose down-regulation early in adipogenesis is required for preadipocyte differentiation and whose levels remain low after PPARγ knockdown. Forced expression of GATA2 in mature adipocytes complemented PPARγ depletion and impaired adipocyte functionality with a more preadipocyte-like gene expression profile. Ectopic expression of GATA2 in adipose tissue in vivo had a similar effect on adipogenic gene expression. These results suggest that PPARγ-independent down-regulation of GATA2 prevents reversion of mature adipocytes after PPARγ depletion.
Peroxisome proliferator-activated receptors (PPARs)2 are ligand-activated transcription factors that bind to PPAR response elements as heterodimers with the retinoid X receptor α (1). Among all PPARs, the expression of PPARγ exhibits the greatest specificity for adipose tissue (2, 3), and the antidiabetic thiazolidinedione drugs are high affinity PPARγ ligands that promote adipogenesis (4). One of the most common models used to study adipocyte differentiation is the mouse 3T3-L1 cell line. After hormonal stimulation of growth-arrested preadipocytes, cells undergo a clonal expansion phase before they permanently exit the cell cycle for the final adipocyte commitment (5). During this process, PPARγ is induced and stimulates the expression of many adipocyte-specific genes. PPARγ is both necessary (6) and sufficient (7) for the differentiation of murine fibroblasts into adipocytes, and no factor is known to stimulate adipocyte differentiation in the absence of PPARγ.
PPARγ itself is activated mainly by hormonally induced changes in the expression of transcriptional activators and repressors. Upstream of the induction of PPARγ are, for instance, EGR2 (early growth response 2) and members of the Krüppel-like factors and C/EBP (CCAAT/enhancer binding protein) families. C/EBPβ has been shown to directly or indirectly induce PPARγ expression (5). On the other hand, several inhibiting factors upstream of PPARγ are regulators of alternative cell fates, including some members of the WNT family (8) as well as factors highly expressed in preadipocytes and down-regulated during differentiation, including PREF-1 and GATA2/3 (9-11).
In contrast to the thoroughly studied role of PPARγ during adipocyte differentiation, our knowledge about the role of PPARγ in maintaining the adipocyte phenotype in mature adipocytes is limited. PPARγ activation has been shown to regulate a variety of genes involved in glucose and lipid metabolism as well as many secreted adipokines (12), suggesting a central position of PPARγ in the transcriptional control of adipocyte gene expression. Indeed, recent genome-wide analyses identified thousands of binding sites of PPARγ in mature 3T3-L1 adipocytes (13, 14).
In vivo, complete depletion of PPARγ in mature adipocytes resulted in cell death and replacement with newly differentiated PPARγ-expressing cells (15). However, lentivirus-mediated knockdown of PPARγ in 3T3-L1 adipocytes altered glucose uptake and inflammatory responses but did not lead to dedifferentiation of committed adipocytes (16). Here, we confirmed that adipocyte characteristics were maintained after knockdown of PPARγ. Although most adipocyte-specific genes returned to preadipocyte levels after PPARγ depletion, we identified a subset of genes whose regulation during adipogenesis was not reversed by PPARγ knockdown. Among these genes was Gata2, which was down-regulated during adipocyte differentiation and remained low after prolonged PPARγ depletion. Forced expression of GATA2 in 3T3-L1 adipocytes as well as adipose tissue in vivo impaired adipocyte functionality and, in combination with PPARγ depletion, led to a more preadipocyte-like gene expression profile. These results suggest that PPARγ-independent regulation of Gata2 prevents reversion of mature adipocytes after PPARγ depletion.
EXPERIMENTAL PROCEDURES
Cell Culture and Differentiation—Reagents were obtained from Invitrogen unless otherwise noted. 293A and murine 3T3-L1 cells were maintained in Dulbecco's modified Eagle's medium supplemented with 10% fetal bovine serum (U. S. BioTechnologies Inc., Parkerford, PA), 100 units/ml penicillin, and 100 μg/ml streptomycin. 3T3 cells were grown to confluence and induced to differentiate 2 days after confluence with medium containing 1 μm dexamethasone, 10 μg/ml bovine insulin, and 0.5 mm 3-isobutyl-1-methylxanthine (all from Sigma) for 2 days and for an additional 2 days in insulin only. Adipocytes were considered mature after 8 days with at least 95% conversion into the adipocyte morphology.
Transfection and Knockdown—3T3-L1 cells at the indicated stages of differentiation were transfected by electroporation (Nucleofector II, Amaxa). Cells were detached from culture dishes with 0.25% trypsin and 0.5 mg/ml collagenase in phosphate-buffered saline, washed twice, resuspended in electroporation buffer (solution V, Amaxa), mixed with 2 or 3 nmol of control nontargeting oligonucleotide (Dharmacon) or siRNA oligonucleotides (supplemental Table S1), and seeded into 12-well plates after electroporation.
Immunoblot Analysis—Proteins were isolated and separated in 4-20% SDS-polyacrylamide gels and transferred to polyvinylidene difluoride membrane. After incubation with the primary antibodies for PPARγ (sc-7273, Santa Cruz Biotechnology), GATA2 (sc-9008, Santa Cruz Biotechnology, or 4595, Cell Signaling), or the ubiquitously expressed GTPase RAN (BD Biosciences), a secondary horseradish-conjugated antibody (Thermo Scientific) was added, and an enhanced chemiluminescent substrate kit (Thermo Scientific) was used for detection.
mRNA Isolation and Quantitative Polymerase Chain Reaction (qPCR)—RNA was purified with the RNeasy mini kit (Qiagen GmbH, Hilden, Germany). cDNA was generated using the Sprint PowerScript system (Clontech). All primers and probes are listed in supplemental Table S1. All PCRs were carried out using either Taqman Universal Polymerase Master Mix or SYBR Green PCR Master Mix (Applied Biosystems, Foster City, CA) and the PRISM 7900 instrument (Applied Biosystems) and evaluated according to the standard curve method. All mRNA expression data were normalized to 36B4 gene expression.
Gene Expression Profiling and Analysis—Gene expression values were determined using Affymetrix mouse4302 GeneChip® arrays (Affymetrix, Santa Clara, CA) by hybridizing triplicate samples of preadipocytes and control or PPARγ siRNA-treated adipocytes (day 14 after initiation of differentiation). The University of Pennsylvania Microarray Core Facility performed cRNA labeling, GeneChip hybridization, and biotinylated cRNA detection according to standard Affymetrix protocols. Hybridized arrays were scanned using an Affymetrix GeneChip Scanner 3000. The image files were analyzed for probe intensities and converted to tabular formats using Microarray Suite Expression Analysis software from Affymetrix. Probe set intensity summarization and normalization were calculated using RMA (17) implemented using the Bioconductor project (18) in the software package R (19). Prior to statistical analysis for differential probe set expression, the data were filtered to exclude probe sets with low variability by selecting those probe sets whose expression values had an inner quartile range >0.5. To determine differential probe set expression between the treatment conditions, we used the linear modeling functions from the BioC limma package (20). Initially, a linear model was fit to a group-means parameterization design matrix defining each treatment condition. A contrast matrix defining all of the pairwise comparisons was subsequently fit, which utilized an empirical Bayes method to moderate the S.E. of the estimated log -fold changes as described (20). Controlling the false discovery rate was used to correct for multiple testing (21). Both processed and raw array data have been deposited with the Gene Expression Omnibus at NCBI under accession number GSE14004.
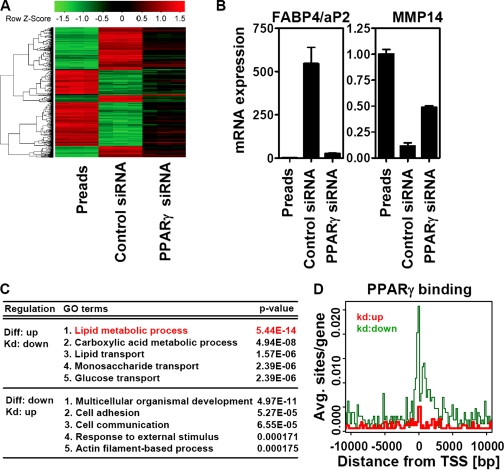
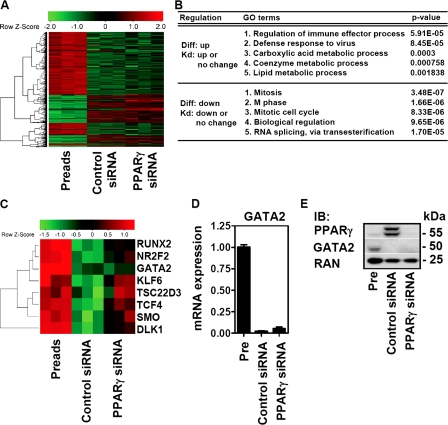
Heat Maps, Gene Ontology (GO) Analysis, and Association with PPARγ Binding—Heat maps were generated with the software package R using probe sets with a -fold change ≥7 and a q-value <0.01 (see Fig. 2A) or with a -fold change ≥2 of at least two conditions and limited to up- or down-regulation during both differentiation and knockdown (see Fig. 3A). Detection of overrepresented GO terms among genes presented in the heat maps was calculated using the hyperGTest function in R to calculate hypergeometric p values for GO term overrepresentation using a universe defined by the mouse4302 GeneChip. Overrepresentation was considered significant at p < 0.05. Genomic coordinates of genes regulated by >2-fold after PPARγ knockdown were assigned to a previously generated data set for whole genome PPARγ binding (14). Relative binding to up- or down-regulated genes was expressed in 200-bp bins relative to transcriptional start sites.
FIGURE 2.
PPARγ depletion in differentiated adipocytes reverses most adipogenic gene expression. A, heat map of genes with differential expression in preadipocytes (Preads) and adipocytes electroporated with control or PPARγ siRNA oligonucleotides (genes with a -fold change ≥7 between all conditions) determined by microarray. B, representative expression of adipocyte- and preadipocyte-specific genes measured by qPCR. C, GO analysis of these genes divided into two groups according to indicated patterns of regulation. D, localization of PPARγ binding to up- and down-regulated genes after PPARγ depletion in relation to distance to their transcriptional start sites (TSS; Pos. 0). Diff, differentiation; Kd, knockdown.
FIGURE 3.
PPARγ depletion in differentiated adipocytes does not entirely reverse the adipogenic gene expression. A, heat map of genes with differential expression in preadipocytes (Preads) and adipocytes electroporated with control or PPARγ siRNA oligonucleotides (with a -fold change ≥2 with the same orientation between differentiation and knockdown or with a -fold change ≥2 between at least two conditions) determined by microarray. B, GO analysis of these genes divided into two groups according to indicated patterns of regulation. C, heat map of transcription factors expressed in preadipocytes and known to control adipocyte differentiation. D and E, mRNA and protein expression of Gata2 in preadipocytes (Pre), control, or PPARγ siRNA-treated adipocytes measured by qPCR and immunoblotting (IB).
Adenoviral Overexpression of GATA2 in 3T3-L1 Cells—Adenoviral overexpression of GATA2 in 3T3 cells was carried out by using Adeno-X Expression System 2 (Clontech). In short, the coding sequence of Gata2 was cloned into the pDNR-CMV entry vector. After verification of the insert by sequencing, a recombination with the adenoviral acceptor vector pLP-Adeno-X-CMV was performed. PacI-digested positive recombined vectors were used to infect 293A cells. Produced adenoviruses were purified using the Adeno-X virus purification kit (Clontech), and titers were determined using the Adeno-X rapid titer kit (Clontech). Equal titers of Gata2- or green fluorescent protein (GFP)-containing adenoviruses were used to infect preadipocytes. Mature adipocytes were infected by the addition of 0.5 μg/ml polylysine (Sigma) to the virus-containing solution. Adipocytes were incubated with the virus overnight in 0.5% bovine serum albumin/Dulbecco's modified Eagle's medium. Overexpression of GATA2 was confirmed by qPCR and protein expression and compared with the GFP control.
Measurement of Lipolysis—Lipolysis was assessed by measuring glycerol release into the culture medium. Adipocytes were serum-starved for 2 h in Dulbecco's modified Eagle's medium containing 0.2% bovine serum albumin, washed with Krebs-Ringer phosphate buffer, and incubated for 45 min in Krebs-Ringer phosphate buffer containing 4% bovine serum albumin and 1 μm isoproterenol. Glycerol concentrations were determined by a glycerol reagent (Sigma) following the manufacturer's instructions and correlated to total protein concentration.
Mouse Studies—Experimental procedures were in accordance with institutional guidelines and regulations. Male C57BL/6J wild-type mice were fed a high fat diet (60 kcal % fat diet) from Research Diets for 20 weeks starting at 6 weeks of age. After high fat chow loading, body weight-matched mice were anesthetized using isoflurane prior to dissection of the skin and body wall. The adenoviral preparation (∼0.5 × 10¹⁰ plaque-forming units in a volume of 100 μl) was injected into three points each on both epididymal fat pads of five (GFP) and six (GATA2) mice per group. 2 weeks later, animals were sacrificed, and total epididymal fat pads were isolated and processed for protein and mRNA.
Statistical Analysis—For 3T3-L1 gene expression experiments, representative results of at least three independent experiments are shown. Results are expressed as mean ± S.D. of triplicates. Murine expression data are shown as mean ± S.E. Statistical significance was determined using either the two-tailed Student's t test or analysis of variance, as appropriate, and p < 0.05 was deemed significant (*, p < 0.05).
RESULTS
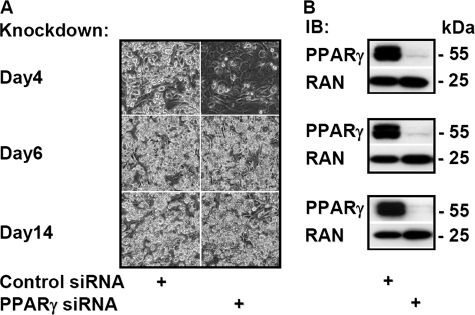
PPARγ Depletion Minimally Affects Appearance of Mature Adipocytes—Differentiating day 4 adipocytes, which already express PPARγ at significant levels and are close to acquiring the typical adipocyte morphology, were electroporated with four different siRNA oligonucleotides (supplemental Table S1), and PPARγ2 expression and adipocyte conversion were compared 48 h after reseeding the cells. All oligonucleotides efficiently reduced PPARγ2 mRNA expression and blocked further adipocyte conversion compared with the control siRNA oligonucleotide as assessed by phase-contrast microscopy, and the most efficient oligonucleotide was used for all subsequent knockdown experiments (supplemental Fig. S1A). We next compared the impact of PPARγ knockdown at different stages of differentiation. 3T3-L1 adipocytes are considered as terminally differentiated 6-8 days after the addition of hormonal inducers. As shown in Fig. 1A, PPARγ knockdown inhibited adipocyte conversion only during the early stages (day 4) of differentiation when investigated 48 h after electroporation by phase-contrast microscopy (Fig. 1A). However, PPARγ seems less important for the maintenance of mature adipocytes because no apparent physical changes were observed in adipocytes electroporated at day 6 or 14 (Fig. 1A), which is in agreement with the recent results of Liao et al. (16). Furthermore, even after an extended time of PPARγ knockdown (electroporated at day 10 and grown for an additional 10 days), there was no major change in adipocyte appearance (data not shown).
FIGURE 1.
PPARγ is required for adipocyte differentiation but not for the maintenance of mature adipocyte phenotypes. A, 3T3-L1 cells at 4, 6, or 14 days after initiation of differentiation were electroporated with control or PPARγ siRNA oligonucleotides and reseeded. Phase-contrast microscopy was performed 48 h later. B, the corresponding protein expression of PPARγ and RAN at indicated times was analyzed by immunoblotting (IB) experiments.
PPARγ Depletion in Mature Adipocytes Partially Reverses the Majority of Adipogenic Gene Expression Changes—To explore why PPARγ depletion does not reverse adipogenesis, we compared global gene expression of preadipocytes with control and PPARγ siRNA-treated adipocytes. To avoid interfering with the differentiation process, mature day 14 adipocytes were studied. 48 h after electroporation, PPARγ protein levels of adipocytes treated with the corresponding siRNA oligonucleotide were comparable with those in preadipocytes (supplemental Fig. S1B). Gene expression in PPARγ knockdown, control siRNA-treated adipocytes, and preadipocytes was analyzed by Affymetrix expression microarrays.
759 genes were found to be changed by >7-fold during differentiation and PPARγ knockdown. qPCR was used to validate these changes in several genes (supplemental Fig. S1C). Heat map analysis of the differentially regulated genes showed that there were two main categories of reciprocal regulation; genes up-regulated during differentiation were down-regulated by PPARγ knockdown, and conversely, genes down-regulated during differentiation were up-regulated after depletion of PPARγ (Fig. 2A). Interestingly, in both groups, PPARγ knockdown led to only a partial rescue of preadipocyte gene expression (compare color spectra in Fig. 2A). In accordance with this finding, qPCR analysis of adipocyte-specific aP2 and preadipocyte-specific Mmp14 showed a higher degree of regulation during differentiation than after PPARγ knockdown (Fig. 2B).
Adipocyte Genes Down-regulated by PPARγ Knockdown Regulate Lipid Metabolism—Consistent with the known role of PPARγ in lipid metabolism, genes up-regulated during differentiation and down-regulated by PPARγ knockdown were highly enriched for lipid metabolic pathways as determined by GO analysis (Fig. 2C, top). Most adipocyte-specific genes can be found in this group, including several genes known to contain functional PPAR response elements (supplemental Table S2). Indeed, the genome-wide analysis of PPARγ binding in adipocytes (14) demonstrated an enrichment of PPARγ-binding sites in genes down-regulated after PPARγ knockdown, especially those close to the transcriptional start site (Fig. 2D), suggesting that these genes are direct targets of PPARγ. By contrast, GO analysis of the genes down-regulated during adipogenesis and up-regulated in mature adipocytes depleted of PPARγ demonstrated enrichment for genes important for fibroblast growth (Fig. 2C, bottom). These genes were not enriched for PPARγ binding in the genome-wide analysis (Fig. 2D), suggesting that although their reduced adipocyte expression is dependent on PPARγ, this regulation is indirect.
Subgroup of Genes Is Resistant to Reversal after PPARγ Knockdown in Mature Adipocytes—Because the findings thus far indicate that PPARγ regulates numerous adipocyte genes involved in lipid metabolism, the explanation for a lack of altered adipocyte appearance after PPARγ depletion remained unclear. We hypothesized that the residual expression of adipocyte-specific genes is above a certain threshold necessary for the maintenance of the differentiated state. The reason for that could be an incomplete depletion of PPARγ or the existence of additional factors that are not regulated by PPARγ contributing to gene expression and maintenance of the differentiated state of mature adipocytes.
To address this, we focused on genes whose expression changed in a manner that was not reversed by PPARγ knockdown. By applying the 7-fold cutoff used earlier, we identified only a small number of genes. To increase this number, we investigated genes that changed by >2-fold. We found 1,315 genes exhibiting these characteristics, along with a small subset of genes that were not regulated during differentiation but altered after PPARγ knockdown (Fig. 3A). GO analysis of all up- or down-regulated genes that were not reversed after PPARγ knockdown showed enrichment for functional pathways not related to the specific functions of the mature adipocyte (Fig. 3B). Genes up-regulated during differentiation but not down-regulated by PPAR knockdown exhibited modest enrichment for lipid metabolic processes. In contrast, genes down-regulated during differentiation but not up-regulated by PPAR knockdown were enriched for cell cycle functions (Fig. 3B). This suggested that the expression of some genes involved in lipid metabolism and cell cycle regulation is not reversed after PPARγ knockdown and therefore could be responsible for the maintained adipocyte morphology.
Special Role for GATA2 among Upstream Factors after PPARγ Depletion—We next ordered regulated genes not reversed after PPARγ knockdown according to their -fold change during differentiation (see top 10 lists in supplemental Table S2). High on this list was GATA2, a transcription factor important for various types of cell differentiation (22). In adipocytes, GATA2 inhibits differentiation and is down-regulated early after hormonal stimulation of preadipocytes (10). GATA2 has been described to inhibit adipocyte differentiation just upstream of PPARγ by direct binding to the PPARγ promoter and by interfering with C/EBPα- and C/EBPβ-mediated transcription (23). We therefore investigated whether PPARγ knockdown only affects genes that are regulated downstream of PPARγ during adipocyte differentiation. Surprisingly, transcription factors implicated in the differentiation process upstream of PPARγ activation were increased after PPARγ knockdown, with the exception of GATA2 (Fig. 3C). qPCR confirmed that Gata2 gene expression was reduced in adipocytes whether or not PPARγ was depleted (Fig. 3D); likewise, GATA2 protein expression was also decreased during adipocyte differentiation and did not increase after PPARγ depletion (Fig. 3E). We therefore hypothesized that continued low Gata2 expression could contribute to the maintenance of residual adipocyte-specific gene expression and adipocyte morphology after depletion of PPARγ.
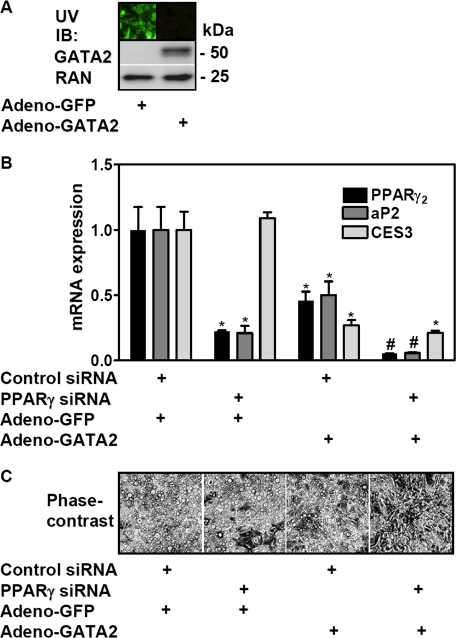
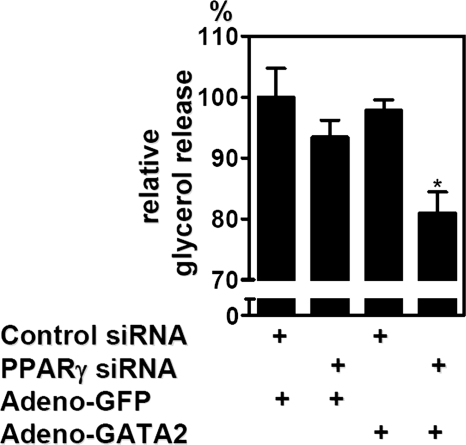
Forced GATA2 Expression in Mature Adipocytes Complements PPARγ Depletion—3T3-L1 preadipocytes infected with a GATA2-expressing adenovirus and grown to confluency (supplemental Fig. S2A, left panel) showed markedly decreased adipocyte conversion in comparison with the GFP control, confirming that GATA2 down-regulation is required for adipogenesis (supplemental Fig. S2A, right panel). Adenoviral gene transduction was next used to restore Gata2 expression in mature adipocytes, with substantial expression of GFP and GATA2 noted after 48 h (Fig. 4A) and maintained for at least 7 days (data not shown). Forced expression of GATA2 in control siRNA-treated adipocytes led to a reduction of PPARγ and its target gene aP2 (Fig. 4B). Interestingly, forced expression of GATA2 also decreased the expression of Ces3 (carboxylesterase 3), a major lipase in mature 3T3-L1 adipocytes (24-26) that, like Gata2, was high on the list of regulated genes not reversed after PPARγ knockdown (supplemental Table S2). Combining GATA2 expression with PPARγ depletion resulted in an even stronger reduction of aP2 (Fig. 4B). Furthermore, simultaneous PPARγ knockdown and GATA2 expression changed adipocyte morphology more than either manipulation alone (Fig. 4C). In addition, the adipocyte-specific function of isoproterenol-stimulated lipolysis was reduced in cells with combined PPARγ knockdown and GATA2 expression but not with either treatment alone (Fig. 5).
FIGURE 4.
Forced GATA2 protein expression in differentiated adipocytes complements PPARγ knockdown. A, ectopic expression of GFP or GATA2 in adipocytes is shown. B and C, differentiated adipocytes were electroporated with control or PPARγ siRNA oligonucleotides and infected with GFP-expressing (Adeno-GFP) or GATA2-expressing (Adeno-GATA2) adenoviruses. 5 days later, mRNA expression of the indicated genes was determined by qPCR, and cell morphology was assessed by phase-contrast microscopy. Data are mean ± S.D. (*, p < 0.05; #, p < 0.05 versus control knockdown). IB, immunoblot.
FIGURE 5.
Combined PPARγ depletion and GATA2 overexpression reduce lipolytic capacity of adipocytes. Glycerol release after β-adrenergic stimulation was measured and is expressed relative to total cell protein. Data are mean ± S.D. (*, p < 0.05). Adeno-GFP, GFP-expressing adenoviruses; Adeno-GATA2, GATA2-expressing adenoviruses.
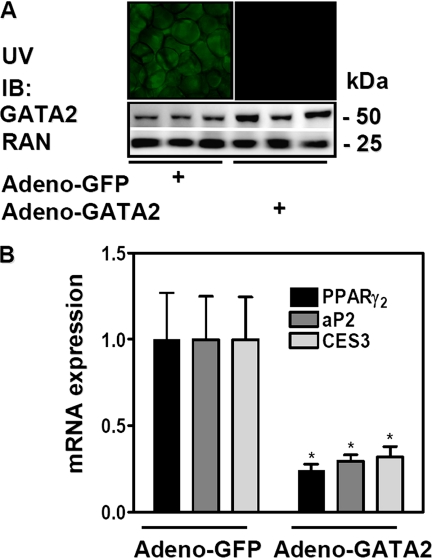
Overexpression of GATA2 in White Adipose Tissue in Vivo Reduces Adipocyte-specific Gene Expression—Gata2 expression is reduced in several rodent models of obesity (10). Direct injection of adenovirus into the epididymal fat pad led to selective expression in 50-70% of the whole fat pad, as shown for GFP (supplemental Fig. S2B) for up to 3 weeks (data not shown). Isolated overexpression of GATA2 in epididymal white adipose tissue using this method was confirmed by immunoblot analysis (Fig. 6A). Remarkably, ectopic expression of GATA2 in adult adipose tissue in vivo revealed that GATA2 exhibited markedly reduced mRNA expression of PPARγ2, aP2, as well as Ces3 (Fig. 6B).
FIGURE 6.
Ectopic expression of GATA2 in adipose tissue in vivo decreases adipogenic gene expression. A and B, epididymal fat pads were injected with adenoviruses expressing GFP (Adeno-GFP) or GATA2 (Adeno-GATA2). After 14 days, GFP expression was visualized by UV light, and GATA2 overexpression was confirmed by immunoblotting (IB). Relative mRNA expression of PPARγ2, aP2, and Ces3 was determined by qPCR (B). Data are mean ± S.E. (*, p < 0.05).
DISCUSSION
We have found that depletion of adipocyte PPARγ to levels comparable with undifferentiated cells leads to a partial reversal of the vast majority of gene expression changes occurring during adipogenesis. In agreement with a previous study (16), this did not result in a dedifferentiated appearance of the cells. To explain this finding, we focused on genes that are highly regulated during differentiation but not reversed after PPARγ knockdown. The antiadipogenic transcription factor Gata2 ranked high among these genes, and its forced expression in mature adipocytes and adipose tissue in vivo resulted in the down-regulation of adipocyte-specific gene expression and partial dedifferentiation of the cells. Thus, lack of Gata2 expression appears to be a factor that contributes to maintenance of the adipocytes independently of PPARγ.
A large number of the genes whose high level of expression in adipocytes was reduced by depletion of PPARγ play a role in the cellular lipid and glucose metabolism, which are key specialized properties of adipocytes. Many of these genes have nearby binding sites for PPARγ as determined by genome-wide analysis of PPARγ binding in adipocytes (13, 14). Thus, these genes are likely to be direct targets of PPARγ. We also identified a large number of genes whose expression was reduced during adipocyte differentiation and up-regulated by PPARγ knockdown. The fact that the expression of these genes is induced by PPARγ knockdown implies a role for PPARγ in their regulation. However, unlike the genes whose high level of expression depended upon PPARγ, we found far fewer PPARγ-binding sites in the vicinity of these genes, consistent with what has been observed for the entire set of genes that are down-regulated during the more global analysis of genes during adipocyte differentiation (14). Thus, although the repressed expression of many of these genes depends upon the presence of PPARγ, this appears to be an indirect effect.
Although most metabolic genes induced during adipogenesis were dependent upon PPARγ for expression in adipocytes, a notable exception was the adipocyte lipase Ces3. Ces3 is involved in maintaining the metabolic properties of adipocytes but, like Gata2, was unaffected by PPARγ knockdown. Forced expression of GATA2 in mature adipocytes repressed Ces3, suggesting that Ces3 is likely a GATA2 target whose regulation is independent of PPARγ. Consistent with this, recent genome-wide analysis of PPARγ binding in adipocytes did not detect PPARγ binding within 65 kb of the transcriptional start siteW. In addition, a recent study showed that thiazolidinedione treatment does not regulate Ces3 expression in adipocytes (24), providing further evidence of a PPARγ-independent mechanism.
The combination of PPARγ knockdown and GATA2 overexpression synergistically reversed the adipocyte-specific pattern of gene expression, and indeed, only the combined treatments markedly decreased phenotypic characteristics such as lipolytic capacity of mature adipocytes. Thus, in addition to high levels of PPARγ, low Gata2 expression is critical for the maintenance of adipocyte characteristics. Forced expression of GATA2 repressed PPARγ mRNA, consistent with the notion that GATA2 is upstream of PPARγ (23), although GATA2 also functions as a PPARγ-independent regulator of adipocyte genes, as exemplified by Ces3. Whether GATA2 represses Ces3 directly or via another factor remains to be elucidated. GATA2 has been shown to mediate the inhibitory effects of SFPI1 and NR2F2 (27, 28) on adipocyte differentiation, which could also be part of this pathway. However, it is important to note that even the combined knockdown of PPARγ and reintroduction of GATA2 did not completely dedifferentiate mature adipocytes. Although potentially due to the experimental limitations of our cell model, this finding may also point to the existence of additional factors critical for maintaining the molecular and metabolic properties of differentiated adipocytes.
Supplementary Material
This work was supported, in whole or in part, by National Institutes of Health Grant R01 DK49780 (to M. A. L.) from NIDDK and Training Grants 5-F32-DK070405 and T32-DK07314 (to J. C. C.) and Nuclear Receptor Signaling Atlas/National Institutes of Health Grant U19DK62434 (to M. A. L., S. A. O., and N. J. M.). This work was also supported by mentored fellowship awards from the American Diabetes Association (to M. S. and M. Q.). The costs of publication of this article were defrayed in part by the payment of page charges. This article must therefore be hereby marked “advertisement” in accordance with 18 U.S.C. Section 1734 solely to indicate this fact.
The on-line version of this article (available at http://www.jbc.org) contains supplemental Figs. S1 and S2 and Tables S1 and S2.
Footnotes
The abbreviations used are: PPAR, peroxisome proliferator-activated receptor; GFP, green fluorescent protein; qPCR, quantitative polymerase chain reaction; GO, gene ontology; siRNA, small interfering RNA.
References
- 1.Rosen, E. D., and MacDougald, O. A. (2006) Nat. Rev. Mol. Cell Biol. 7 885-896 [DOI] [PubMed] [Google Scholar]
- 2.Chawla, A., Schwarz, E. J., Dimaculangan, D. D., and Lazar, M. A. (1994) Endocrinology 135 798-800 [DOI] [PubMed] [Google Scholar]
- 3.Tontonoz, P., Hu, E., Graves, R. A., Budavari, A. I., and Spiegelman, B. M. (1994) Genes Dev. 8 1224-1234 [DOI] [PubMed] [Google Scholar]
- 4.Lehmann, J. M., Moore, L. B., Smith-Oliver, T. A., Wilkison, W. O., Willson, T. M., and Kliewer, S. A. (1995) J. Biol. Chem. 270 12953-12956 [DOI] [PubMed] [Google Scholar]
- 5.Farmer, S. R. (2006) Cell Metab. 4 263-273 [DOI] [PMC free article] [PubMed] [Google Scholar]
- 6.Rosen, E. D., Hsu, C. H., Wang, X., Sakai, S., Freeman, M. W., Gonzalez, F. J., and Spiegelman, B. M. (2002) Genes Dev. 16 22-26 [DOI] [PMC free article] [PubMed] [Google Scholar]
- 7.Tontonoz, P., Hu, E., and Spiegelman, B. M. (1994) Cell 79 1147-1156 [DOI] [PubMed] [Google Scholar]
- 8.Prestwich, T. C., and Macdougald, O. A. (2007) Curr. Opin. Cell Biol. 19 612-617 [DOI] [PMC free article] [PubMed] [Google Scholar]
- 9.Smas, C. M., and Sul, H. S. (1993) Cell 73 725-734 [DOI] [PubMed] [Google Scholar]
- 10.Tong, Q., Dalgin, G., Xu, H., Ting, C. N., Leiden, J. M., and Hotamisligil, G. S. (2000) Science 290 134-138 [DOI] [PubMed] [Google Scholar]
- 11.Rosen, E. D., and Spiegelman, B. M. (2006) Nature 444 847-853 [DOI] [PMC free article] [PubMed] [Google Scholar]
- 12.Badman, M. K., and Flier, J. S. (2007) Gastroenterology 132 2103-2115 [DOI] [PubMed] [Google Scholar]
- 13.Nielsen, R., Pedersen, T. A., Hagenbeek, D., Moulos, P., Siersbaek, R., Megens, E., Denissov, S., Borgesen, M., Francoijs, K. J., Mandrup, S., and Stunnenberg, H. G. (2008) Genes Dev. 22 2953-2967 [DOI] [PMC free article] [PubMed] [Google Scholar]
- 14.Lefterova, M. I., Zhang, Y., Steger, D. J., Schupp, M., Schug, J., Cristancho, A., Feng, D., Zhuo, D., Stoeckert, C. J., Jr., Liu, X. S., and Lazar, M. A. (2008) Genes Dev. 22 2941-2952 [DOI] [PMC free article] [PubMed] [Google Scholar]
- 15.Imai, T., Takakuwa, R., Marchand, S., Dentz, E., Bornert, J. M., Messaddeq, N., Wendling, O., Mark, M., Desvergne, B., Wahli, W., Chambon, P., and Metzger, D. (2004) Proc. Natl. Acad. Sci. U. S. A. 101 4543-4547 [DOI] [PMC free article] [PubMed] [Google Scholar]
- 16.Liao, W., Nguyen, M. T., Yoshizaki, T., Favelyukis, S., Patsouris, D., Imamura, T., Verma, I. M., and Olefsky, J. M. (2007) Am. J. Physiol. 293 E219-E227 [DOI] [PubMed] [Google Scholar]
- 17.Irizarry, R. A., Hobbs, B., Collin, F., Beazer-Barclay, Y. D., Antonellis, K. J., Scherf, U., and Speed, T. P. (2003) Biostatistics 4 249-264 [DOI] [PubMed] [Google Scholar]
- 18.Gentleman, R. C., Carey, V. J., Bates, D. M., Bolstad, B., Jonker Dettling, M., Dudoit, S., Ellis, B., Gautier, L., Ge, Y., Gentry, J., Hornik, K., Hothorn, T., Huber, W., Iacus, S., Irizarry, R., Leisch, F., Li, C., Maechler, M., Rossini, A. J., Sawitzki, G., Smith, C., Smyth, G., Tierney, L., Yang, J. Y., and Zhang, J. (2004) Genome Biol. 5 R80. [DOI] [PMC free article] [PubMed] [Google Scholar]
- 19.Ihaka, R., and Gentleman, R. R. (1996) J. Graph. Comput. Stat. 1 299-314 [Google Scholar]
- 20.Smyth, G. K. (2004) Stat. Appl. Genet. Mol. Biol. 3 Article3 [DOI] [PubMed]
- 21.Benjamini, Y., and Hochberg, Y. (1995) J. R. Stat. Soc. Ser. B 57 289-300 [Google Scholar]
- 22.Wozniak, R. J., and Bresnick, E. H. (2008) Curr. Top. Dev. Biol. 82 55-83 [DOI] [PubMed] [Google Scholar]
- 23.Tong, Q., Tsai, J., Tan, G., Dalgin, G., and Hotamisligil, G. S. (2005) Mol. Cell. Biol. 25 706-715 [DOI] [PMC free article] [PubMed] [Google Scholar]
- 24.Dolinsky, V. W., Gilham, D., Hatch, G. M., Agellon, L. B., Lehner, R., and Vance, D. E. (2003) Biochim. Biophys. Acta 1635 20-28 [DOI] [PubMed] [Google Scholar]
- 25.Lehner, R., and Vance, D. E. (1999) Biochem. J. 343 1-10 [PMC free article] [PubMed] [Google Scholar]
- 26.Soni, K. G., Lehner, R., Metalnikov, P., O'Donnell, P., Semache, M., Gao, W., Ashman, K., Pshezhetsky, A. V., and Mitchell, G. A. (2004) J. Biol. Chem. 279 40683-40689 [DOI] [PubMed] [Google Scholar]
- 27.Xu, Z., Yu, S., Hsu, C. H., Eguchi, J., and Rosen, E. D. (2008) Proc. Natl. Acad. Sci. U. S. A. 105 2421-2426 [DOI] [PMC free article] [PubMed] [Google Scholar]
- 28.Wang, F., and Tong, Q. (2008) Am. J. Physiol. 295 C213-C220 [DOI] [PubMed] [Google Scholar]
Associated Data
This section collects any data citations, data availability statements, or supplementary materials included in this article.


