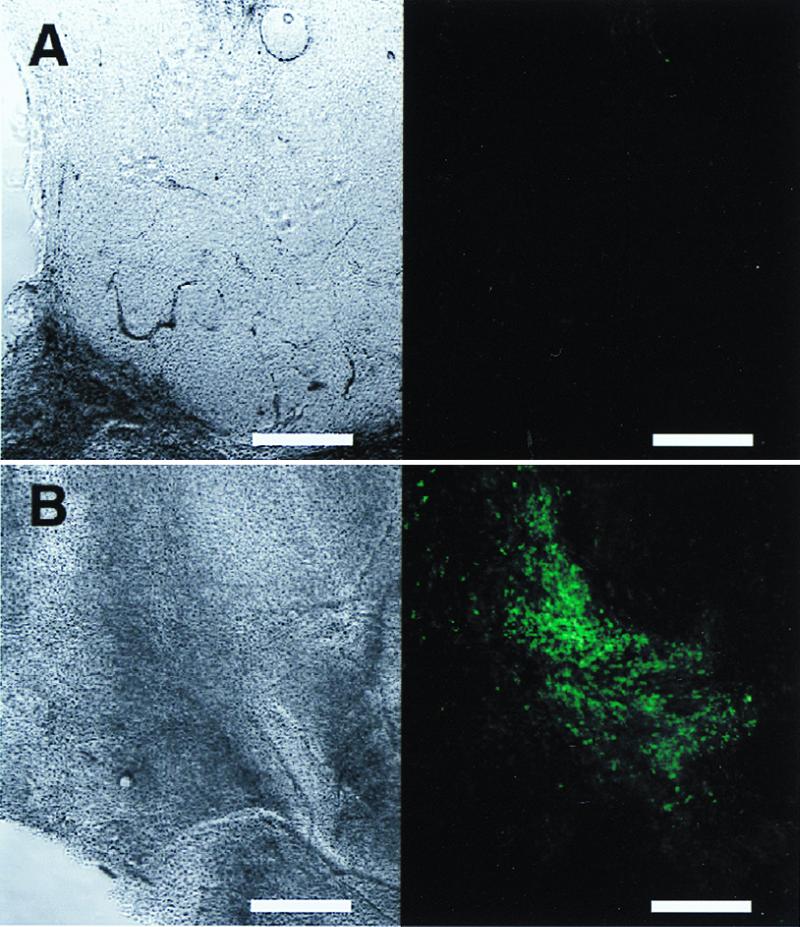
Figure 1.

GFP fluorescence images in mice tumors after 50 μg of plasmid injection without (A) or with (B) in vivo EP. Each image consists of the phase-contrast images (Left) and GFP fluorescence images (Right) of the same slices. Each fluorescence image was captured and processed under the same conditions. (Bar = 500 μm.)
