

Abstract
Purpose
We sough to investigate the effect of serum uric acid (SUA) levels on risk of cancer incidence in men and to flexibly determine the shape of this association by using a novel analytical approach.
Methods
A population-based cohort of 78,850 Austrian men who received 264,347 serial SUA measurements was prospectively followed-up for a median of 12.4 years. Data were collected between 1985 and 2003. Penalized splines (P-splines) in extended Cox-type additive hazard regression were used to flexibly model the association between SUA, as a time-dependent covariate, and risk of overall and site-specific cancer incidence and to calculate adjusted hazard ratios with their 95% confidence intervals.
Results
During follow-up 5189 incident cancers were observed. Restricted maximum-likelihood optimizing P-spline models revealed a moderately J-shaped effect of SUA on risk of overall cancer incidence, with statistically significantly increased hazard ratios in the upper third of the SUA distribution. Increased SUA (≥8.00 mg/dL) further significantly increased risk for several site-specific malignancies, with P-spline analyses providing detailed insight about the shape of the association with these outcomes.
Conclusions
Our study is the first to demonstrate a dose–response association between SUA and cancer incidence in men, simultaneously reporting on the usefulness of a novel methodological framework in epidemiologic research.
Keywords: Cancer incidence, Epidemiology, Extended Cox-type additive hazard regression, Men, Penalized splines, Risk factor, Serum uric acid
Introduction
Serum uric acid (SUA) is a breakdown product of ingested and endogenously synthesized purines, excreted by the kidneys and intestinal tract. In the kidneys, it is filtered and subsequently reabsorbed or further secreted in the proximal tubule, predominantly under the action of a urate transporter (1). Although the majority of cases of increased SUA result from impaired renal excretion, production can be increased by several mechanisms, including rare enzymatic defects and states of high cell turnover (2).
Numerous epidemiologic studies have reported an association of elevated SUA and prevalent health conditions, including obesity, insulin resistance, the metabolic syndrome, diabetes, hypertension, and renal disease (3–5). Moreover, hyperuricemia was found to be independently related to incidence of and mortality from cardiovascular disease (6–11), although a causal link remains controversial (12). The association of SUA with cancer, however, remains largely unexplored to date. It has been hypothesized that antioxidant properties of SUA may play a role in cancer etiology by preventing the formation of oxygen radicals, thereby protecting against carcinogenesis (13, 14). However, the authors of recent large-scale population-based studies concluded that increased SUA significantly increases the risk of overall and site-specific cancer mortality in both men and women (15, 16). Conversely, in the only two epidemiologic investigations, focusing on cancer incidence as the primary end point, no significant association with SUA could be detected after controlling for confounding factors (17, 18).
Because previous investigations related to the topic either assumed a linear effect or exclusively relied upon categorical analyses, knowledge on the dose–response association of SUA with cancer incidence/mortality is widely limited. On the one hand, parametric analyses of SUA imposed a strong a priori assumption about the functional form of the relationship that might have critically affected the internal validity of the findings. On the other hand, step function analyses are known to provide a rather crude approximation of the true relationship by not using the full range of exposure data available to estimate associations; this, in turn, leads to a reduction of statistical power and less precise regression estimates (19, 20). It has been widely discussed in the epidemiologic and statistical literature that categorization of continuous exposures/covariates may lead to insufficient flexibility, clinically implausible results, and possible cut-point bias, especially when data are sparse (21–25).
Spline regression has long been proposed as a powerful alternative to conventional regression approaches because no underlying assumptions of linearity have to be fulfilled. In contrast to categorical models, spline models use the full range of exposure data to estimate the shape of the association and can fit complex distributions as well as linear relationships (26–28). In the present work, we use penalized splines (P-splines) in extended Cox-type additive hazard regression, to flexibly model the relationship between SUA, as a time-dependent covariate, and risk of overall and site-specific cancer incidence in a prospective, population-based cohort of 78,850 Austrian men. We further introduce the use of P-splines in extended Cox-type additive hazard regression as a novel and powerful methodological framework to flexibly model the association between continuous exposures/covariates and the risk of a time-to-event outcome that does not require 1) a-priori knowledge of spline knot location, 2) categorization, or 3) an assumption of a linear effect.
Methods
Study Population
The Vorarlberg Health Monitoring and Promotion Program (VHM&PP) (6, 7, 15, 16, 29, 30), started in 1985 and conducted by the Agency for Social and Preventive Medicine in Vorarlberg, the westernmost province of Austria, is one of the world's largest ongoing population-based risk factor surveillance programs. All adults of the region are invited to participate by a combination of different measures, including written invitations, television, radio, and newspaper reports. Active follow-up of study participants is performed through a recall system of written biennial reinvitation letters. Sociodemographic data are recorded, and a voluntary physical examination is conducted regularly in a standardized manner by trained local physicians and internists. During the examination, a fasting blood sample is taken. Costs are covered by the participant's (compulsory) health insurance. A more detailed description of the program methodology has been reported elsewhere (29).
Between 1985 and 2003, 80,224 male Vorarlberg residents (ages > 18 years) were enrolled in the VHM&PP cohort. Approximately 75% of participants had two or more routine health examinations. After excluding 1350 participants (1.7%) with missing data on SUA at baseline, the current investigation was restricted to 78,874 male participants. To eliminate possible effects of severe preclinical disease, before enrolment we further excluded participants with a history of malignancies and participants with baseline SUA concentrations > 12.0 mg/dl (n = 24), resulting in a total of 78,850 apparently healthy men with 264,347 serial SUA measurements eligible for analyses. All participants signed informed consents to have personal data stored and processed, and for this study, institutional review board approval was obtained by the Ethics Committee of the province of Vorarlberg.
Data Collection
Measurements of height, weight, smoking status (current, former, never), and SUA are routinely obtained for each study participant. Participants in the study had between 1 and 19 SUA measurements available for analysis. Individuals who reported smoking of at least one cigarette per day during the year before examination were classified as current smokers. Occupational status (blue collar, white collar, or self-employed) was determined by the insurance number of participants and used as a surrogate measure of socioeconomic status. Participants who were retired at baseline were classified according to their former occupation.
Cancer Ascertainment
Cancers were identified with the Vorarlberg cancer registry, which has been accepted for IARC publication since 1993 (31) and has high completeness of recording (32). Nearly all cancers (96.7%) were histologically confirmed. Cohort data were linked with the Vorarlberg Death Index to identify deaths and to calculate person-years at risk. For statistical analyses, cancers were grouped into the following subgroups according to the International Classification of Diseases, 9th and 10th Revisions (ICD-9, ICD-10) (33): Malignant neoplasms of digestive organs (ICD-9 150-157; ICD-10 C15-C26), malignant neoplasms of respiratory system and intrathoracic organs (ICD-9 160-165; ICD-10 C30-C39), malignant neoplasms of bone, connective tissue, soft tissue and skin (ICD-9 170-173; ICD-10 C40-C49), malignant neoplasms of male genital organs (ICD-9 185-187; ICD-10 C60-C63), malignant neoplasms of urinary organs (ICD-9 188-189; ICD-10 C64-68), and malignant neoplasms of lymphoid, hematopoietic and related tissue (ICD-9 200-208; ICD-10 C81-C96).
Laboratory Measurements
Two central laboratories undergoing regular internal and external quality-control procedures performed SUA measurements on fasting blood samples. Blood samples were centrifuged for 15 min at 3309 g within 60–240 min of venipuncture. Subsequently, uric acid concentrations of all samples were measured enzymatically on an RXL Chemistry Analyzer (Dade Behring, Newark, DE) by monitoring the loss of absorbance at 293 nm after treatment with uricase (34). To check calibration, three daily control samples were included. If the mean values for the control samples of each run were not within 3% of the expected value, the run was repeated. Day-to-day variation (CV) was 5%.
Statistical Analyses
To gain sufficient flexibility in modeling, the dose–response association between SUA, as a time-dependent covariate, and risk of overall and site-specific cancer incidence, we used penalized splines (P-splines) in extended, restricted maximum-likelihood (REML-) optimal Cox-type additive hazard regression (35). In the classical Cox proportional hazards model, the hazard rate is related to covariates x by model (1),
| (1) |
where λ0(t) denotes the baseline hazard rate common to all individuals and β contains the regression coefficients. The most distinct feature of the Cox model is the clear separation between time variation captured in the baseline hazard rate and individual covariate influences captured in the linear predictor x′β. Moreover, all effects are assumed to be linear, making the direct application of model (1) rather restrictive. Inferential conclusions on the regression coefficients in the Cox model typically are based on the partial likelihood whereas estimation of the baseline hazard rate is postponed to a second step based on Breslow's estimate. Although the classical Cox model serves as a very useful and popular survival analysis tool to model joint covariate effects on the risk of a time-to-event outcome and extensions of the Cox model for the inclusion of time-varying covariates have previously been well-established (36) and implemented in standard statistical software, the limitation of linear effects remains.
To overcome this restriction, in our analyses, we considered additive extensions of the Cox model (35, 37). A version of a more general model equation that is sufficient for our purposes is given by model 2,
| (2) |
where g0(t) = log(λ0(t))denotes the log-baseline hazard rate and g1(u(t)) represents a smooth, non-linear effect of a time-varying covariate u(t). A similar class of models has been considered in the context of discrete-time survival modeling (38). The major feature making model (2) more suitable in our application than model (1) is that it allows for nonlinear, smooth effects of a covariate, leading to a considerable amount of additional flexibility. In particular, the model allows for more general shapes of the relative risk as a function of u(t). This flexibility might greatly help further scientific understanding about the association structure between covariates and time-to-event response. Additionally, model (2) contains the log-baseline hazard rate as a further smooth function of time allowing for inference based on the full instead of the partial likelihood. It thereby makes use of the complete data likelihood in estimating the regression coefficients and combines the classical two-step approach into a joint estimation procedure.
Both, the log-baseline hazard rate and the nonparametric effect can efficiently be modeled by penalized splines (P-splines) (39). The general idea is to approximate the functions by linear combinations of B-spline basis functions, i.e.,
Although it is conceptually related to a polynomial extension of a covariate effect, a representation in terms of B-splines is much more flexible and allows for more general functional forms. To obtain a data-driven amount of smoothness, the regression coefficients γ0 = (γ0j)′ and γ = (γ1j)′ are not simply estimated by maximizing a likelihood but are based on the penalized (log-)likelihood criterion in model 3,
| (3) |
Although the first two terms of the penalized likelihood criterion provide a measure of fidelity to the data, i.e., a model fit criterion, the last two terms define roughness penalties for the coefficients of the smooth functions. Defining suitable penalty matrices (40) leads to penalties that essentially reflect smoothness of first or second order derivatives of the smooth functions. The essential quantity in (3) is now given by the smoothing parameters κ0 and κ1 that govern the impact of the smoothness penalty. Choosing small values for the smoothing parameters leads to an almost unpenalized fit and therefore to a very flexible estimate. In the other extreme, choosing large values for the smoothing parameters leads to an overwhelming impact of the penalty and, as a consequence, to very smooth estimates. Determining the smoothing parameters in a data-driven way results in an adaptive choice that reflects the requirements of the data at hand. Such an automated estimation routine that provides both estimates of the regression coefficients and the smoothing parameters can be derived based on a mixed model representation of (2); see Kneib and Fahrmeir (35) for details.
Considering the choice of polynomial splines, there are two important quantities: The degree of the spline and the number of knots to use. The former is relatively simple to choose according to one's knowledge of subject matter. Cubic splines have proven to be a suitable default choice, leading to twice continuous differentiable, i.e., visually smooth functions. The choice of knots has been an issue of major concern for a long time in polynomial spline smoothing. Note, however, that in combination with penalization, the choice of the knots becomes much less important. As long as a sufficiently large number of knots is employed, the exact number and placement of knots have only negligible effect on the resulting estimates, since the penalty avoids over-fitting. We therefore use a moderate number (with 20 as a default choice) of equidistant knots in our analyses.
When considering relative risks with respect to a reference value x0 in the Cox model, the linear combination of covariate effects leads to the rather restrictive form
In contrast, in the nonparametric model relative risks with respect to a reference value u0(t) are given by the following:
i.e., the relative risks are also of nonlinear form (41). Relying on asymptotic normality of the estimated coefficients γ1, we constructed pointwise confidence bands for the nonlinear relative risk curve.
Because SUA measurements were not generally available at all observed event times for all subjects in our cohort, in our analyses we assumed piecewise constant time-varying covariates, i.e., the covariate values remain constant in between the measurement periods. Each of our regression runs included as potential confounders age, body-mass index (BMI), smoking status (current, former, never), occupational status (blue collar, white collar, self-employed) and year of enrolment into the cohort. To gain sufficient flexibility also in modeling of continuous confounders, simultaneously controlling for computational effort, age and BMI were modeled as cubic polynomials. A SUA concentration of 4.50 mg/dL, as the mid-point of the laboratory reference range (2.0–7.0 mg/dL in men), was used as reference value for all calculations of hazard ratios.
To check sensitivity of our REML estimates, we additionally fitted 1) Akaike Information Criterion (AIC) (42) and 2) Bayesian Information Criterion (BIC) (43) optimal P-spline models and 3) modeled SUA as a cubic polynomial. To assess the impact of categorization and linearization on our results, we further modeled SUA as categorical and linear covariate. To eliminate possible confounding of our findings by severe preclinical disease (i.e., undiagnosed cancers at time of enrolment), we repeated all analyses and excluded participants diagnosed with malignancies within the first 2 years after enrollment. By using stratified analyses, we evaluated whether the SUA–cancer relationship was modified by BMI and smoking. All statistical analyses were conducted with BayesX statistical software (44) that is available free from http://www.stat.uni-muenchen.de/∼bayesx/.
Results
Characteristics of the Study Population
Demographic and clinical characteristics of the study population are shown in Table 1. Median follow-up time was 12.4 years with a total of 888,280 person-years. Most participants (92.1%) were followed for at least 2 years after baseline SUA measurement, and 61.3% had follow-up times of 10 or even more years. Mean age at study entry was 41.7 years. During follow-up, 5189 (6.6%) incident cancers were observed. On average, 3.4 SUA measurements were obtained for each participant (range, 1–19). SUA concentrations ranged from 1.1 to 12.0 mg/dl, with a mean (SD) of 5.7 (1.3) mg/dL.
TABLE 1.
Characteristics of study population, VHM&PP 1985–2003
| All male VHM&PP participants, 1985–2003 | 80,224 |
| Participants with complete and valid data on SUA at enrolment | 78,874 |
| Eligible participants for analysesa | 78,850 |
| Total number of routine health examinations | 264,347 |
| Number of SUA measurements, mean ± SD (range) | 3.4 ± 2.9 (1–19) |
| Age, years, mean ± SD (range) | 41.7 ± 14.6 (18–96) |
| BMI, kg/m2, mean ± SD (median) | 25.3 ± 3.6 (24.9) |
| SUA, mg/dl mean ± SD (median)b | 5.7 ± 1.3 (5.6) |
| Current or former smoker, % | 30.1 |
| Occupational status, % | |
| Blue collar | 37.7 |
| White collar | 51.8 |
| Self-employed | 10.5 |
| Follow-up, years, mean ± SD (median) | 11.3 ± 5.7 (12.4) |
| Total person-years at risk | 888,280 |
| Incident cancers, no. (%) | 5189 (6.6) |
| Age at cancer diagnosis, years, mean ± SD (range) | 57.0 ± 12.2 (19–93) |
BMI = body mass index; SUA = serum uric acid; VHM&PP = Vorarlberg Health Monitoring and Promotion Program.
Participants with baseline SUA concentrations > 12.0 mg/dL or with a history of malignancies before enrollment were excluded.
SUA values are shown as averages of each participant during individual follow-up and before eventual cancer diagnoses. All other characteristics pertain to baseline values (i.e., measurements at first visit).
Association of SUA With Overall and Site-Specific Cancer Incidence From REML-Optimal P-Spline Models
The dose–response association of time-varying SUA, modeled as P-Spline, with risk of overall cancer incidence, from REML-optimal extended Cox-type additive hazard regression, adjusted for age and BMI (modeled as cubic polynomials), smoking status, occupational status, and year of entry into the cohort is shown in Table 2 and Figure 1. We found evidence for a moderately J-shaped effect of SUA on risk of overall cancer incidence, with statistically significantly increased hazard ratios in the upper third of the SUA distribution and moderately increased hazard ratios in the lowest part of the SUA distribution; however, the latter estimates did not exhibit statistical significance. Exclusion of participants diagnosed with malignancies within the first 2 years after enrolment did not change our findings. Stratification by BMI or smoking status did not indicate interactions of SUA by those variables. A likelihood ratio test revealed a statistically significant departure from linearity (p = 0.026), indicating that the assumption of a linear relationship for the effect of SUA on the adjusted logit of the predicted probability of cancer incidence is not appropriate.
TABLE 2.
Estimated adjusted hazard ratios with 95% confidence intervals for the association of SUA with overall and site-specific cancer incidence from restricted maximum-likelihood (REML)-optimal extended Cox-type additive hazard regression using a penalized spline expansion of time-varying SUAa
| Site-specific cancers | |||||||
|---|---|---|---|---|---|---|---|
| All cancers | Digestive organs | Respiratory system and intrathoracic organs | Bone, connective tissue, soft tissue and skin | Genital organs | Urinary organs | Lymphoid, hematopoietic, and related tissue | |
| SUA | (n = 5189) | (n = 1243) | (n = 883) | (n = 446) | (n = 1850) | (n = 447) | (n = 320) |
| 2.0 mg/dL | 1.06 (0.91–1.24) | 1.23 (0.87–1.74) | 0.86 (0.71–1.05) | 0.89 (0.66–1.20) | 1.00 (0.90–1.12) | 1.10 (0.74–1.63) | 1.21 (0.77–1.92) |
| 3.0 mg/dL | 1.03 (0.95–1.11) | 1.09 (0.92–1.30) | 0.91 (0.82–1.02) | 0.93 (0.80–1.09) | 1.00 (0.94–1.07) | 1.04 (0.85–1.27) | 1.09 (0.86–1.37) |
| 4.5mg/dL | 1.00 (Ref) | 1.00 (Ref) | 1.00 (Ref) | 1.00 (Ref) | 1.00 (Ref) | 1.00 (Ref) | 1.00 (Ref) |
| 6.0 mg/dL | 1.02 (0.97–1.06) | 1.03 (0.94–1.13) | 1.11 (1.03–1.20) | 1.07 (0.96–1.18) | 1.00 (0.95–1.06) | 1.08 (0.97–1.22) | 1.07 (0.94–1.22) |
| 7.0 mg/dL | 1.05 (0.99–1.19) | 1.09 (0.96–1.23) | 1.21 (1.08–1.35) | 1.13 (0.97–1.31) | 1.00 (0.93–1.09) | 1.20 (1.03–1.41) | 1.20 (1.00–1.44) |
| 8.0 mg/dL | 1.11 (1.03–1.20) | 1.22 (1.06–1.41) | 1.32 (1.14–1.54) | 1.22 (1.00–1.48) | 1.01 (0.90–1.13) | 1.36 (1.12–1.65) | 1.40 (1.12–1.74) |
| 9.0 mg/dL | 1.18 (1.07–1.31) | 1.44 (1.20–1.74) | 1.46 (1.20–1.78) | 1.34 (1.03–1.74) | 1.02 (0.88–1.18) | 1.54 (1.19–1.99) | 1.65 (1.24–2.20) |
| 10.0 mg/dL | 1.25 (1.08–1.46) | 1.71 (1.29–2.25) | 1.61 (1.24–2.10) | 1.49 (1.04–2.12) | 1.02 (0.85–1.24) | 1.73 (1.19–2.51) | 1.94 (1.28–2.94) |
| 11.0 mg/dL | 1.31 (1.05–1.66) | 1.97 (1.27–3.07) | 1.78 (1.26–2.51) | 1.65 (1.02–2.67) | 1.03 (0.81–1.31) | 1.92 (1.11–3.33) | 2.24 (1.20–4.19) |
SUA = serum uric acid.
All models are adjusted for age and body mass index (modeled as cubic polynomials), smoking status (current, former, never), occupational status (blue collar, white collar, self-employed), and year of entry into the cohort. SUA was modeled as a time-varying covariate. Participants with SUA values > 12.0 mg/dL at baseline or with a history of malignant cancers before enrollment were excluded.
FIGURE 1.
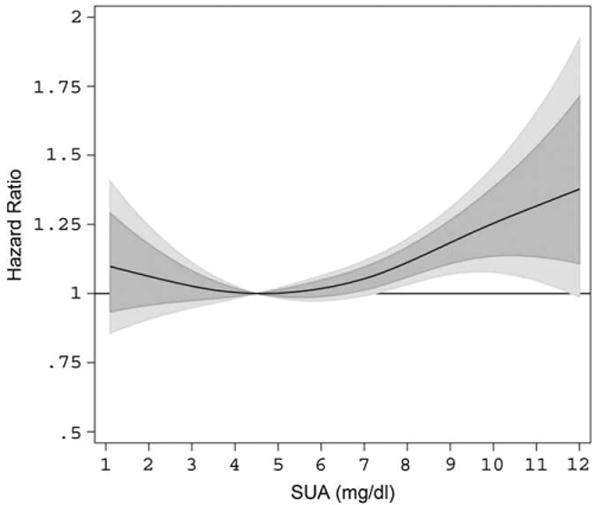
Estimated adjusted hazard ratios (solid line) with 80% (dark grey) and 95% (light grey) confidence intervals for the association of SUA (in mg/dL) and overall cancer incidence (n = 5189) in 78,850 male VHM&PP participants from REML-optimal, extended Cox-type additive hazard regression, adjusted for age, BMI, smoking status, occupational status, and year of examination. The nonlinear effect of SUA on risk of overall cancer incidence was modeled with the use of a penalized spline expansion, with SUA as a time-varying covariate. A SUA concentration of 4.5 mg/dL, as the mid-point of the laboratory reference range, was used as reference value for the calculation of hazard ratios. BMI = body mass index; REML = restricted maximum-likelihood; SUA = serum uric acid; VHM&PP = Vorarlberg Health Monitoring and Promotion Program.
In cancer site-specific REML-optimal P-spline models, elevated SUA concentrations (≥8.00 mg/dL) statistically significantly increased risk for malignant neoplasms of digestive organs, the respiratory system, bone, connective tissue, soft tissue and skin, urinary organs, and hematopoietic cancers, with non-monotonic associations to be observable for several site-specific malignancies. For these outcomes, P-spline analyses provided detailed insight about the shape of the relationship, especially at the upper and lower end of the SUA distribution (Fig. 2). Although sparse data, leading to relatively large confidence intervals, necessitate a conservative interpretation, men in the upper end of the SUA distribution appear to have a more than 2-fold risk for developing malignant neoplasms of digestive and urinary organs and hematopoietic cancers in comparison with men with SUA concentrations within the laboratory reference range. In contrast, P-splines revealed no association of elevated SUA with cancers of genital organs, despite being the most frequently observed malignancy in our population (Table 2).
FIGURE 2.
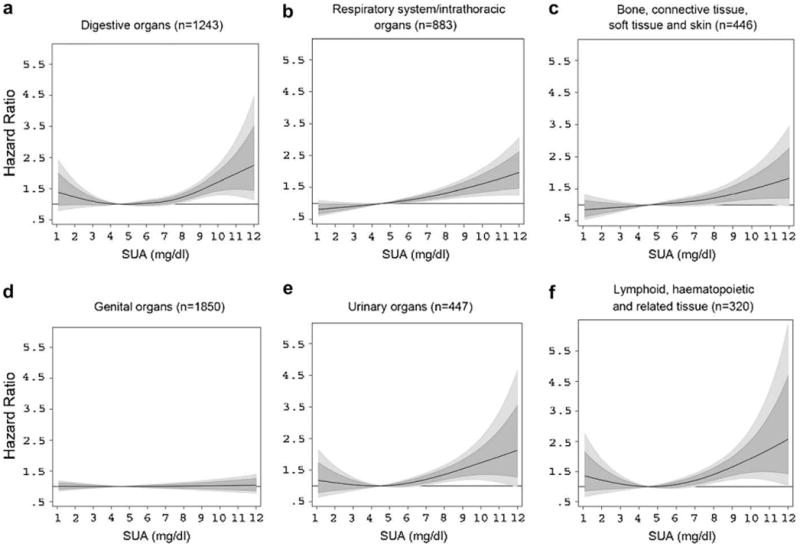
Estimated adjusted hazard ratios (solid lines) with 80% (dark grey) and 95% (light grey) confidence intervals for the association of SUA (in mg/dL) with malignant neoplasms of (a) digestive organs; (b) respiratory system/intrathoracic organs; (c) bone, connective tissue, soft tissue, and skin; (d) genital organs; (e) urinary organs; and (f) lymphoid, hematopoietic and related tissue in 78,850 male VHM&PP participants from REML-optimal extended Cox-type additive hazard regression adjusted for age, BMI, smoking status, occupational status, and year of examination. The effects of SUA on risk of site-specific malignancies were modeled with a penalized spline expansion, with SUA as a time-varying covariate. A SUA concentration of 4.5 mg/dL, as the mid-point of the laboratory reference range, was used as reference value for the calculation of hazard ratios. For abbreviations, see legend to Figure 1.
Sensitivity Analysis
To investigate sensitivity of our REML-optimal P-spline estimates, we additionally calculated extended Cox-type additive hazard models, with SUA as a P-Spline, by minimizing AIC and BIC. We further modeled SUA as cubic polynomial, linear function, and categorized covariate (by using quintiles of the SUA distribution). A good agreement, with very similar risk patterns and estimated logits of the predicted probability of cancer incidence covered by the 95% confidence interval of the REML procedure, emerged for the AIC-optimal and BIC-optimal P-Spline model. However, in the upper end of the SUA distribution, where data were sparse, the AIC-minimizing model showed implausible behavior, with a marked decrease in the estimated adjusted logit starting at 10 mg/dL (Fig. 3a). In line with this result, it previously has been shown that AIC may perform poor for small numbers of observations or in the presence of too many parameters in relation to the size of the sample (45, 46). Similarly, modeling SUA as cubic polynomial revealed adjusted logits within those of the 95% confidence interval of the REML-optimal P-Spline, indicating a stable magnitude of effect, also under several modeling strategies (Fig. 3a).
FIGURE 3.
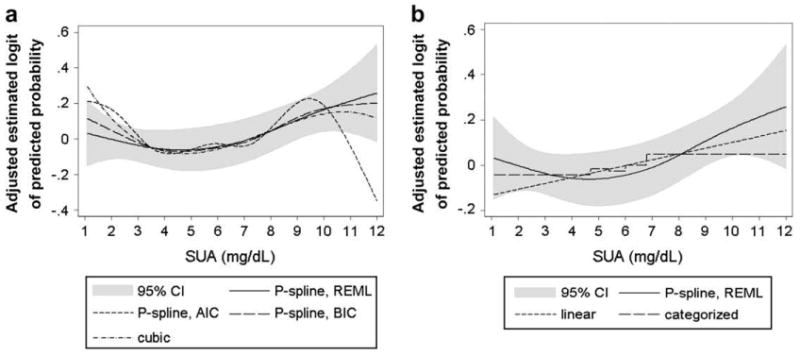
Comparison of estimated adjusted logits of the predicted probability of cancer incidence according to SUA concentrations (in mg/dL) in 78,850 male VHM&PP participants from different extended Cox-type additive hazard regression models. (a) REML-optimal, AIC-optimal, and BIC-optimal model with time-varying SUA modeled as penalized spline and time-varying SUA modelled as cubic polynomial. (b) Time-varying SUA modeled as linear function and categorized variable (using quintiles) in comparison with the REML-optimal P-spline model. 95% CIs are shown for the REML-optimal P-spline model. All models are adjusted for age, BMI, smoking status, occupational status, and year of entry into the cohort. For abbreviations, see legend to Figure 1.
Although linear and categorical analyses of SUA, when quintiles of the SUA distribution were used, likewise widely overlapped our P-spline curves, these estimates tended to undervalue risk in the upper and lower end of the SUA distribution, whereas the risk was slightly overestimated for SUA concentrations within the normal range (Fig. 3b). Additionally, AIC, BIC, and REML indicated a worse fit of linear and categorical analyses of SUA in comparison to all P-spline models (data not shown).
Discussion
The aim of the present study was to flexibly investigate the dose–response association of SUA with risk of overall and site-specific cancer incidence in a large, prospective population-based cohort of 78,850 apparently healthy men and to introduce the use of P-splines in an extended Cox-type additive hazard regression as a novel and powerful tool in analyzing the effects of continuous exposures/covariates on time-to-event outcomes.
Although semiparametric regression models, based on polynomial splines, have long been proposed for epidemiologic studies (22), they are still rarely used. The main reason may have been the lack of automated estimation routines, because most of the earlier approaches required manual tuning either with respect to the number and placement of knots or with respect to the choice of some smoothing parameter. In the Cox-type additive hazard regression models considered in this article, these difficulties are overcome by combining penalization of the spline coefficients with automatic choice of the smoothing parameter by REML estimation (35). As a consequence, the choice of knot locations becomes an issue of minor importance. AIC- and BIC-optimal smoothing parameters can supplement the results of the REML-optimal model to check the sensitivity of the estimates. However, REML-based estimation seems to be the recommended standard choice because AIC often tends to select too wiggly functions whereas BIC leads to very smooth functions (45, 46). Moreover, estimating the smoothing parameter with REML leaves the possibility to compare different model specifications based on the model choice criteria AIC or BIC.
Compared with the classical, semi-parametric Cox model, our spline-based model is somewhat more restrictive, considering the form of the baseline hazard rate, which remains completely unspecified in the Cox model. From a practical point of view, however, the assumption of a polynomial spline for the baseline hazard does not seem to be very restrictive since most hazard rates observed in practice can very accurately be approximated by polynomial splines with a sufficiently large number of knots. Moreover, direct modeling of the baseline hazard may have the advantage that an estimate for the hazard itself instead of the cumulative hazard becomes available. Finally, in concordance with biological knowledge in most applications, this estimate is a smooth instead of a step function. One drawback of our approach is, however, the increased numerical complexity resulting in longer computing times as compared to conventional analyses based on the Cox model. Still, this price should not be too high if additional and more realistic insights into the subject matter can be gained.
Previous studies on the association of SUA and cancer incidence/mortality (15–18) either assumed a linear association or exclusively relied upon categorical analyses of SUA, with both analytic strategies imposing strong a-priori assumptions about the functional form of the relationship. Concerning these methodological limitations, previous knowledge on the dose–response association of SUA and cancer is widely limited. Although step-functions have been the common statistical methods for risk estimation, major concerns regarding potential sources of bias have been raised (19–22). Step functions are based on the assumption that risks are constant within each interval, with discontinuities in risks at category cut points not being biologically plausible and violating the assumption of actual risks varying smoothly with the data. Additionally the choice of reference categories and interval cut-points can greatly influence the results (19–22).
Although recent investigations on cancer mortality, in line with our results, reported on an independent effect of elevated SUA (15, 16), we are aware of only two previous studies (17, 18) in which the authors focused on cancer incidence as the primary study end point, with both failing to detect an independent association with elevated SUA. Conversely, in the present study, we found clear evidence for a non-monotonic and moderately J-shaped dose–response association of SUA and risk of overall cancer incidence, with statistically significantly increased hazard ratios in the upper third of the SUA distribution and moderately increased hazard ratios in the lowest part of the SUA distribution. Given this non-monotonic pattern, conventional analyses of the effects of SUA on cancer risk may have resulted in invalid findings, with undervalued risk estimates in the upper and lower end of the SUA distribution possibly accounting for the lack of association.
Additionally, the authors of previous studies assessed SUA concentrations at one time-point, obtaining only one measure of exposure, rather than incorporating multiple SUA measurements as a time-varying covariate, as in the present study. Since one single SUA measurement is greatly influenced by metabolic, physiologic, and environmental factors, this approach might have resulted in additional bias.
Given the observational nature of our investigation, the underlying biological mechanisms causing elevated SUA to significantly increase cancer risk overall and for several anatomic sites, cannot be sufficiently answered in the present study. We recently showed, however, that the predictive power of SUA levels on subsequent total cancer mortality increased with the implementation of considerable long time intervals (lags) between screening and subsequent death (15), possibly suggesting increased SUA to be a valuable long-term surrogate marker which is indicative of a lifestyle at increased risk for the development and progression of cancer, rather than acting as an independent risk factor or even carcinogenic substance by itself. In any case, considering the lack of any explanation from in vitro or animal studies, the underlying biological mechanisms causing elevated SUA to increase cancer risk need further study.
The present investigation has several strengths and potential limitations that should be considered. A major strength is that our analytical approach does not require a-priori knowledge of spline knot location, categorization or an assumption of a linear effect, enabling us to flexibly investigate the dose–response association of SUA and cancer incidence. Further strengths are the prospective study design, large sample size, length of follow-up, and the standardized protocol. In addition, examinations were performed by experienced physicians only. Even though information on major risk factors was collected, our study was unable to account for additional factors that further might have residually confounded the relationship between SUA and cancer incidence. Uric acid is the main end product of metabolism of purines, which in turn are derived mostly from diet, and increases especially with the greater intake of red meat. Reasons for a secondary hyperuricemia caused by increased purine biosynthesis and/or urate production are multiple and include obesity, excessive dietary purine ingestion, diabetic ketoacidosis, Vitamin B12 deficiency, ethanol, and chronic renal insufficiency (47). Data from National Health and Nutrition Examination Survey suggested that greater levels of meat and seafood consumption were associated with hyperuricemia and that dairy consumption was inversely correlated with higher levels of uric acid (48). In our cohort, diet was not routinely recorded and thus, could possibly explain differences in SUA levels among the study population. Additionally, alcohol consumption, use of diuretics and other causes of high SUA, including increased endogenous production of urate, decreased excretion of monosodium urate by the kidneys, or decreasing renal function were not directly adjusted for in our P-spline models. Although our cohort consisted of an apparently healthy population, rather than a sick hospital sample, impaired renal function is common in CVD patients and is a co-determining factor of SUA. Because creatinine or other measures of renal function were not routinely determined in all participants of this study, we were unable to directly adjust for these parameters in the main analyses. However, we checked cross-sectional correlation of SUA with serum creatinine in a subgroup of 838 participants that underwent more detailed examination (49) and only found a weak age-adjusted correlation coefficient of SUA with creatinine of r = 0.13 that was further diminished to 0.11, after additional adjustment for confounding factors. Finally, despite the size of our cohort, due to infrequent events, we were unable to estimate site-specific hazard ratios for the subgroup of malignant neoplasms of the nervous system and unspecified sites (ICD-9 190–199; ICD-10 C69–C72).
In summary, in this present study we prospectively investigated the association of SUA and cancer incidence in a population-based cohort of more than 78,000 apparently healthy men, by using penalized splines in extended Cox-type additive hazard regression. Our results, for the first time, indicate a clear dose–response association between increased SUA and risk of cancer incidence in men and provide detailed insight about the shape of this relationship, simultaneously demonstrating the usefulness of fairly novel analytical methods in epidemiologic research.
Acknowledgments
We would like to thank all the participants and physicians of the VHM&PP. We are grateful to the Government of the State of Vorarlberg, Austria, for funding the program and thank Elmar Bechter MD and Hans-Peter Bischof MD at the Health Department of the Vorarlberg State Government.
Supported by Austrian National Bank Grant OENB-12737 (to H.U.). Dr. Brant was supported by funds from the intramural research program of the National Institute on Aging.
Selected Abbreviations and Acronyms
- SUA
serum uric acid
- P-splines
Penalized splines
- VHM&PP
Vorarlberg Health Monitoring and Promotion Program
- ICD
International Classification of Diseases
- REML
Restricted maximum-likelihood
- BMI
Body-mass index
- AIC
Akaike Information Criterion
- BIC
Bayesian Information Criterion
References
- 1.Holmes EW, Kelley WN, Wyngaarden JB. The kidney and uric acid excretion in man. Kidney Int. 1972;2:115–118. doi: 10.1038/ki.1972.81. [DOI] [PubMed] [Google Scholar]
- 2.Nath SD, Voruganti VS, Arar NH, Thameem F, Lopez-Alvarenga JC, Bauer R, et al. Genome scan for determinants of serum uric acid variability. J Am Soc Nephrol. 2007;18:3156–3163. doi: 10.1681/ASN.2007040426. [DOI] [PubMed] [Google Scholar]
- 3.Yoo TW, Sung KC, Shin HS, Kim BJ, Kim BS, Kang JH, et al. Relationship between serum uric acid concentration and insulin resistance and metabolic syndrome. Circ J. 2006;69:928–933. doi: 10.1253/circj.69.928. [DOI] [PubMed] [Google Scholar]
- 4.Johnson RJ, Feig DI, Herrera-Acosta J, Kang DH. Resurrection of uric acid as a causal risk factor in essential hypertension. Hypertension. 2005;45:18–20. doi: 10.1161/01.HYP.0000150785.39055.e8. [DOI] [PubMed] [Google Scholar]
- 5.Tuomilehto J, Zimmet P, Wolf E, Taylor R, Ram P, King H. Plasma uric acid level and its association with diabetes mellitus and some biologic parameters in a biracial population of Fiji. Am J Epidemiol. 1988;127:321–336. doi: 10.1093/oxfordjournals.aje.a114807. [DOI] [PubMed] [Google Scholar]
- 6.Strasak AM, Ruttmann E, Brant L, Kelleher C, Klenk J, Concin H, et al. Serum uric acid and risk of cardiovascular mortality: a prospective long-term study of 83,683 Austrian men. Clin Chem. 2008;54:273–284. doi: 10.1373/clinchem.2007.094425. [DOI] [PubMed] [Google Scholar]
- 7.Strasak AM, Kelleher C, Brant LJ, Rapp K, Ruttmann E, Concin H, et al. Serum uric acid is an independent predictor for all major forms of cardiovascular death in 28613 elderly women: a prospective 21-year follow-up study. Int J Cardiol. 2008;125:232–239. doi: 10.1016/j.ijcard.2007.11.094. [DOI] [PubMed] [Google Scholar]
- 8.Freedman DS, Williamson DF, Gunter EW, Beyers T. Relation of serum uric acid to mortality and ischemic heart disease. The NHANES I epidemiologic follow-up study. Am J Epidemiol. 1995;141:637–644. doi: 10.1093/oxfordjournals.aje.a117479. [DOI] [PubMed] [Google Scholar]
- 9.Liese AD, Hense HW, Lowel H, Döring A, Tietze M, Keil U. Association of serum uric acid with all-cause and cardiovascular disease mortality and incident myocardial infarction in the MONICA Augsburg cohort. Epidemiology. 1999;10:391–397. doi: 10.1097/00001648-199907000-00006. [DOI] [PubMed] [Google Scholar]
- 10.Fang J, Alderman MH. Serum uric acid and cardiovascular mortality: the NHANES I epidemiologic follow up study. JAMA. 2000;283:2404–2410. doi: 10.1001/jama.283.18.2404. [DOI] [PubMed] [Google Scholar]
- 11.Mazza A, Pessina AC, Pavei A, Scarpa R, Tikhonoff V, Casiglia E. Predictors of stroke mortality in elderly people from the general population. The cardiovascular study in elderly. Eur J Epidemiol. 2001;17:1097–1104. doi: 10.1023/a:1021216713504. [DOI] [PubMed] [Google Scholar]
- 12.Baker JF, Krishnan E, Chen L, Schumacher HR. Serum uric acid and cardiovascular disease: recent developments, and where do they leave us? Am J Med. 2005;118:816–826. doi: 10.1016/j.amjmed.2005.03.043. [DOI] [PubMed] [Google Scholar]
- 13.Ames BN, Cathcart R, Schweirs E, Hochstein P. Uric acid provides an antioxidant defense in humans against oxidant- and radical-caused aging and cancer: a hypothesis. Proc Natl Acad Sci USA. 1981;78:6858–6862. doi: 10.1073/pnas.78.11.6858. [DOI] [PMC free article] [PubMed] [Google Scholar]
- 14.Peden DB, Hohman R, Brown ME, Mason RT, Berkebile C, Fales HM, et al. Uric acid is a major antioxidant in human nasal airway secretions. Proc Natl Acad Sci USA. 1990;87:7638–7642. doi: 10.1073/pnas.87.19.7638. [DOI] [PMC free article] [PubMed] [Google Scholar]
- 15.Strasak AM, Rapp K, Hilbe W, Oberaigner W, Ruttmann E, Concin H, et al. Serum uric acid and risk of cancer mortality in a large prospective male cohort. Cancer Causes Control. 2007;18:1021–1029. doi: 10.1007/s10552-007-9043-3. [DOI] [PubMed] [Google Scholar]
- 16.Strasak AM, Rapp K, Hilbe W, Oberaigner W, Ruttmann E, Concin H, et al. The role of serum uric acid as an antioxidant protecting against cancer: prospective study in more than 28,000 older Austrian women. Ann Oncol. 2007;18:1893–1897. doi: 10.1093/annonc/mdm338. [DOI] [PubMed] [Google Scholar]
- 17.Kolonel LN, Yoshizawa C, Nomura AMY, Stemmermann GN. Relationship of serum uric acid to cancer occurrence in a prospective male cohort. Cancer Epidemiol Biomarkers Prev. 1994;3:225–228. [PubMed] [Google Scholar]
- 18.Hiatt RA, Fireman BH. Serum uric acid unrelated to cancer incidence in humans. Cancer Res. 1988;48:2916–2918. [PubMed] [Google Scholar]
- 19.Zhao LP, Kolonel LN. Efficiency loss from categorizing quantitative exposures into qualitative exposures in case-control studies. Am J Epidemiol. 1992;136:464–474. doi: 10.1093/oxfordjournals.aje.a116520. [DOI] [PubMed] [Google Scholar]
- 20.Greenland S. Avoiding power loss associated with categorization and ordinal scores in dose-response and trend analysis. Epidemiology. 1995;6:450–454. doi: 10.1097/00001648-199507000-00025. [DOI] [PubMed] [Google Scholar]
- 21.Weinberg C. How bad is categorization? Epidemiology. 1995;6:345–347. [PubMed] [Google Scholar]
- 22.Greenland S. Dose-response and trend analysis in epidemiology: alternatives to categorical analysis. Epidemiology. 1995;6:356–365. doi: 10.1097/00001648-199507000-00005. [DOI] [PubMed] [Google Scholar]
- 23.Filardo G, Hamilton C, Hamman B, Ng HK, Grayburn P. Categorizing BMI may lead to biased results in studies investigating in-hospital mortality after isolated CABG. J Clin Epidemiol. 2007;60:1132–1139. doi: 10.1016/j.jclinepi.2007.01.008. [DOI] [PubMed] [Google Scholar]
- 24.Rachet B, Siemiatycki J, Abrahamowicz M, Leffondré K. A flexible modeling approach to estimating the component effects of smoking behaviour on lung cancer. J Clin Epidemiol. 2004;57:1076–1085. doi: 10.1016/j.jclinepi.2004.02.014. [DOI] [PubMed] [Google Scholar]
- 25.Gilboa SM, Correa A, Alverson CJ. Use of spline regression in an analysis of maternal prepregnancy body mass index and adverse birth outcomes: does it tell us more than we already know? Ann Epidemiol. 2008;18:196–205. doi: 10.1016/j.annepidem.2007.09.005. [DOI] [PubMed] [Google Scholar]
- 26.Wegman EJ, Whright IW. Splines in statistics. J Am Stat Assoc. 1983;78:351–365. [Google Scholar]
- 27.Eubank RL. Spline Smoothing and Nonparametric Regression. Berlin: Marcel Dekker; 1988. [Google Scholar]
- 28.Rothman KJ, Greenland S. Modern Epidemiology. 2nd. Philadelphia: Lippincott-Raven Publishers; 1988. [Google Scholar]
- 29.Ulmer H, Kelleher C, Diem G, Concin H. Long-term tracking of cardiovascular risk factors among men and women in a large population-based health system: the Vorarlberg Health Monitoring & Promotion Programme. Eur Heart J. 2003;24:1004–1013. doi: 10.1016/s0195-668x(03)00170-2. [DOI] [PubMed] [Google Scholar]
- 30.Strasak AM, Rapp K, Brant LJ, Hilbe W, Gregory M, Oberaigner W, et al. Association of gamma-glutamyltransferase and risk of cancer incidence in men: a prospective study. Cancer Res. 2008;68:3970–3977. doi: 10.1158/0008-5472.CAN-07-6686. [DOI] [PMC free article] [PubMed] [Google Scholar]
- 31.Parkin DM, Whelan SL, Ferlay J, Teppo L, Thomas DB, International Agency for Research on Cancer, Lyon, France . Cancer incidence in five continents. VIII. 2003. [Google Scholar]
- 32.Oberaigner W, Vittadello F. Cancer mapping in alpine regions 1996-2000 pro literature Verlag. 2006 Mammendorf. [Google Scholar]
- 33.World Health Organization. International Classification of Diseases (ICD) [September 4, 2008]; http://www.who.int/classifications/icd/en.
- 34.Burtis CA, Ashwood ER, Tietz NW, editors. Tietz Textbook of Clinical Chemistry. 3rd. Philadelphia: WB Saunders; 1999. [Google Scholar]
- 35.Kneib T, Fahrmeir L. A mixed model approach for geoadditive hazard regression. Scand J Statist. 2007;34:207–228. [Google Scholar]
- 36.Andersen PK, Gill RD. Cox's regression model for counting processes: a large sample study. Ann Stat. 1982;10:1100–1120. [Google Scholar]
- 37.Cai T, Hyndman RJ, Wand MP. Mixed model-based hazard estimation. J Comput Graph Stat. 2002;11:784–798. [Google Scholar]
- 38.Fahrmeir L, Wagenpfeil S. Smoothing hazard functions and time-varying effects in discrete duration and competing risks models. J Am Stat Assoc. 1996;91:1584–1594. [Google Scholar]
- 39.Eilers PH, Marx BD. Flexible smoothing using B-splines and penalties. Stat Sci. 1996;11:89–121. [Google Scholar]
- 40.Brezger A, Lang S. Generalized additive regression based on Bayesian P-splines. Comp Stat Data Anal. 2006;50:967–991. [Google Scholar]
- 41.Cao J, Valois MF, Goldberg MS. An S-Plus function to calculate relative risks and adjusted means for regression models using natural splines. Comput Methods Programs Biomed. 2006;84:58–62. doi: 10.1016/j.cmpb.2006.08.004. [DOI] [PubMed] [Google Scholar]
- 42.Akaike H. Information theory and an extension of the maximum likelihood principle. Second International Symposiumon Information Theory, Budapest: Second International Symposium of Information Theory; 1973. pp. 267–281. [Google Scholar]
- 43.Li W, Nyholt DR. Marker selection by Akaike information criterion and Bayesian information criterion. Genet Epidemiol. 2001;(Suppl 1):S272–277. doi: 10.1002/gepi.2001.21.s1.s272. [DOI] [PubMed] [Google Scholar]
- 44.Brezger A, Kneib T, Lang S. Bayes X: Analyzing Bayesian structural additive regression models. J Stat Soft. 2005;14:i11. [Google Scholar]
- 45.Sugiura N. Further analysis of the data by Akaike's information criterion and the finite corrections. Commun Statist Theory Meth. 1978;7:13–26. [Google Scholar]
- 46.Polesel J, Dal Maso L, Bagnardi V, Zucchetto A, Zambon A, Levi F, et al. Estimating dose-response relationship between ethanol and risk of cancer using regression spline models. Int J Cancer. 2005;114:836–841. doi: 10.1002/ijc.20756. [DOI] [PubMed] [Google Scholar]
- 47.Choi HK, Atkinson K, Karlson EW, Curhan G. Obesity, weight change, hypertension, diuretic use, and risk of gout in men: the health professionals follow-up study. Arch Intern Med. 2005;165:742–748. doi: 10.1001/archinte.165.7.742. [DOI] [PubMed] [Google Scholar]
- 48.Choi HK, Liu S, Curhan G. Intake of purine-rich foods, protein, and dairy products and relationship to serum levels of uric acid: the Third National Health and Nutrition Examination Survey. Arthritis Rheum. 2005;52:283–289. doi: 10.1002/art.20761. [DOI] [PubMed] [Google Scholar]
- 49.Ulmer H, Diem G, Bischof HP, Ruttmann E, Concin H. Recent trends and sociodemographic distribution of cardiovascular risk factors: results from two population surveys in the Austrian WHO CINDI demonstration area. Wien Klin Wochenschr. 2001;113:573–579. [PubMed] [Google Scholar]