

Abstract
We report characterization of aqueous solutions of dilute Lambda phage DNA containing the redox-active surfactant (11-ferrocenylundecyl)trimethylammonium bromide (FTMA) as a function of the oxidation state of the FTMA. FTMA undergoes a reversible one-electron oxidation from a reduced state that forms micelles in aqueous solution to an oxidized state (containing the ferrocenium cation) that does not selfassociate in solution. This investigation sought to test the hypothesis that FTMA can be used to achieve reversible control over the conformation of DNA-surfactant complexes in solution. Whereas DNA adopts extended coil conformations in aqueous solutions, our measurements revealed that addition of reduced FTMA (2–5μM) to aqueous solutions of DNA (5 μM in nucleotide units) resulted in coexistence of extended coils and compact globules in solution. At higher concentrations of reduced FTMA (up to 30μM), the DNA was present as compact globules only. In contrast, oxidized FTMA had no measurable effect on the conformation of DNA, allowing DNA to maintain an extended coil state up to a concentration of 75μM oxidized FTMA. We further demonstrate that it is possible to chemically or electrochemically transform the oxidation state of FTMA in preformed complexes of FTMA and DNA, thus achieving in situ control over the conformations of the DNA in solution. These results provide guidance for the design of surfactant systems that permit active control of DNA-surfactant interactions.
Introduction
The strong cooperative interactions that occur between cationic surfactants and DNA have been described and exploited in a variety of contexts, including DNA purification, separation, extraction, counting, and cell transfection.1–6 In this paper, we report the results of a study that sought to understand the interactions between DNA and a redox-active surfactant and to demonstrate control of DNA-surfactant interactions by using electrochemical and chemical methods that can be used to manipulate the oxidation state of the redox-active surfactants.
The study reported in this paper is based on the redox-active surfactant (11-ferrocenylundecyl)trimethylammonium bromide (FTMA, Figure 1).7–24 This surfactant self-associates into micelles at concentrations above 0.1mM in aqueous solutions containing 0.1M Li2SO4 at 25°C.12,19 These micelles can be disassembled by oxidation of the ferrocene group within the surfactant to a ferrocenium ion, producing a surfactant with two charged head groups. Past studies have established the oxidation of FTMA and disassembly of micelles of FTMA to be reversible.12,18 In a previous publication, we reported that the oxidation state of FTMA can be exploited to control the interactions of FTMA with the non-ionic polymer ethyl(hydroxyethyl)cellulose (EHEC).25 Interactions between FTMA and EHEC were found to be “cooperative”,25 meaning that multiple FTMA molecules act in concert to alter the state of aggregation of the polymer. In this paper, we report that FTMA can be used to reversibly control cooperative interactions between surfactants and DNA, a negatively charged and biologically-relevant polyelectrolyte.
Figure 1.

Molecular structure of FTMA, a redox-active surfactant.
DNA adopts extended conformations in aqueous solution. However, DNA can be compacted by addition of multivalent cations, cationic particles or by contact with cationic surfaces.26,27 The association of DNA and surfactants is entropically driven by the release of counterions and is often described as an interaction that occurs with “double cooperativity” (as described below).26–32 At concentrations of surfactant lower than the critical aggregation concentration (CAC, see Figure 2a), DNA adopts extended conformations similar to those observed in the absence of surfactant. The term “double cooperativity” is used to describe a phenomenon where the association of surfactant with the DNA above the CAC occurs non-uniformly across the population of DNA molecules in solution. That is, surfactant preferentially associates with a sub-population of DNA molecules in solution through both electrostatic interactions with the DNA and hydrophobic self-association. This phenomenon yields a population of DNA-surfactant complexes in equilibrium with DNA molecules, and to the coexistence of DNA globules and coils (Figure 2b). The DNA coils are uncondensed DNA; the DNA globules are DNA molecules condensed by surfactant. The fraction of DNA present as coils in solution decreases with increasing concentration of surfactant, ultimately resulting in a solution of DNA in the globule conformation (Figure 2c). Finally, at higher concentrations of surfactant, it is generally observed that the globules aggregate, leading to precipitation of the DNA-surfactant aggregates. This has been interpreted as the beginning of an associative phase separation.27,29,33
Figure 2.

Schematic illustration of the sizes and structures of complexes formed by interactions between DNA and cationic surfactants. Figures (a) to (c) depict changes in the sizes and structures of DNA-surfactant complexes that occur with increasing surfactant concentration.
Past studies have investigated compaction of DNA by using dynamic light scattering (DLS)29,32,34–36 and fluorescence microscopy.29–31,36 Dias et al., investigated the interactions of Coliphage T2 DNA (167kbp) and cetyltrimethylammonium bromide (CTAB) using DLS to demonstrate the coexistence of extended DNA coils and compact DNA globules at concentrations of CTAB between 2–10μM.29 Higher concentrations of CTAB (>30μM) fully compacted the DNA into globules and lead to precipitation. In the study reported in this paper, we have used DLS to characterize the interactions between FTMA and DNA. We hypothesized that reduced FTMA, which forms micelles in the absence of DNA, would undergo cooperative associations with DNA to form globules. In contrast, we predicted that oxidized FTMA, which does not self-associate in solution, would not condense DNA. We note that non-self-associating molecules that contain multiple positive charges (e.g., spermidine with three charges, Co(NH3)63+, and spermine with four charges) do condense DNA.37–40 However, divalent cations such as Mg2+ do not condense DNA or are reported to condense DNA at concentrations two orders of magnitude higher than those required for trivalent or tetravalent cations.38,40
In summary, the rationale presented above led us to predict that control of the oxidation state of FTMA could be used to control the conformations of DNA in solution. To test this prediction, we conducted a study with two parts. First, we used dynamic light scattering measurements to characterize the interactions of DNA with FTMA. Second, we used chemical and electrochemical methods to determine whether it was possible to achieve in situ control over the oxidation state of FTMA in preformed DNA-FTMA complexes, thus transforming the DNA between extended coil and globular states. We note that one past study has used DLS to report photoreversible DNA condensation using a light-responsive surfactant,36 and we have reported recently that the oxidation state of ferrocene-containing cationic lipids can be used to influence cell transfection.41,42
Experimental Section
Materials
FTMA was purchased from Dojindo Corporation (Gaithersburg, MD) and was used without further purification. Lithium sulfate and L-ascorbic acid (Aldrich) were used as received. Lambda phage DNA (Mw = 3.15 × 10⁷ Daltons, 48.5kbp) was purchased from MBI Fermentas (Hanover, MD).
Methods
Sample Preparation
All measurements were performed in 1mM Li2SO4 (pH 5) because electrolyte was required for electrochemical control of the oxidation state of the FTMA. Although past studies involving FTMA have used high salt concentrations (e.g. 100mM Li2SO4), we did not use a concentration of salt higher than 1mM in the current study because high concentrations of salt (i.e. 100mM NaBr) have been reported to reverse the compaction of DNA by CTAB.29 Aqueous electrolyte solutions (1mM Li2SO4, pH 5) and water (Milli-Q of Millipore, Bedford, MA) used for light scattering measurements were filtered through a series of two 0.22μm GV Millipore filters and then bubbled with argon for approximately 20 minutes prior to addition of FTMA or DNA. Aqueous solutions of 1mM FTMA were prepared using the 1mM Li2SO4 solution described above. Dilutions of 1mM FTMA were made using 1mM Li2SO4. To prepare complexes of FTMA and DNA, 250μL of 10μM DNA was added to 250μL of a solution of FTMA at a concentration sufficient to yield the final concentrations of FTMA described in the text. Solutions were allowed to sit for at least 30 minutes prior to measurements at 25°C. All experiments in this study involving the use of DNA were conducted at concentrations of DNA of 5μM (with respect to DNA nucleotide units).
Electrochemical Methods
A solution of 1mM reduced FTMA was oxidized at room temperature by using a bipotentiostat (Pine Instruments, Grove City, PA) to apply 400mV to a working electrode relative to a silver|silver chloride reference electrode. The working and counter electrodes were each one square inch platinum mesh. Complete oxidation was confirmed by observation of a final current that was less than 5% of the initial current and by using UV-visible spectrophotometry.7 The optical absorbance spectrum of FTMA was characterized using a Cary 1E UV-visible spectrophotometer (Varian, Walnut Creek, CA). Complexes of reduced FTMA and DNA were oxidized using similar procedures. These samples were prepared by addition of 3mL of a solution of 10μM DNA to 3mL of 60μM reduced FTMA. The solution was allowed to sit for at least 30 minutes prior to oxidation.
Dynamic Light Scattering Measurements
A 100mW, 532nm laser (Coherent Compass 315M-100) illuminated a temperature-controlled glass cell at 25°C filled with a refractive-index matching fluid (decahydronaphthalene, Fisher Scientific, Pittsburgh, PA). The scattering of light was measured at angles of 105°, 90° and 75°. The autocorrelation functions were obtained by using a BI-9000AT digital autocorrelator (Brookhaven Instruments Corporation, Holtsville, NY). We used the ACFs at multiple angles to confirm that the ACFs were largely due to center-of-mass diffusion (see below for details).43,44
Analysis of autocorrelation functions
The autocorrelation functions (ACFs) were analyzed using an intensity-based CONTIN45,46 analysis to yield a distribution of relaxation times. For center-of-mass (CM) diffusion of aggregates in solution, the CM diffusion coefficient, D, is related to the relaxation time, τ, by
| (1) |
where q is the magnitude of the scattering vector
| (2) |
In Equation 2, n is the refractive index of the solvent, λ is the wavelength and θ is the scattering angle. The hydrodynamic radius, Rh, is given by the Stokes-Einstein relationship as
| (3) |
where T is temperature and η is the viscosity of the solution. All size distributions reported in this paper were obtained using CONTIN. As shown in Supplemental Materials, we confirmed that analysis of the ACFs using a NNLS algorithm yielded similar size distributions.
Results and Discussion
Dynamic Light Scattering of Complexes Formed by Mixing FTMA and DNA
Figure 3a shows the ACFs obtained from dynamic light scattering measurements of solutions prepared by mixing DNA and reduced FTMA. Inspection of Figure 3a reveals that the ACF of DNA in the absence of FTMA is composed of a broad distribution of relaxation times. In the presence of 5μM reduced FTMA, new relaxation processes are evident in the ACF at around 700μs. DNA in the presence of 10μM reduced FTMA resulted in an ACF with faster relaxation times as well as a more narrow distribution of relaxation times. At 50μM reduced FTMA, the ACF was shifted to substantially longer relaxation times as compared to solutions containing lower concentrations of FTMA. Figure 3b shows the ACFs obtained using DNA solutions to which oxidized FTMA was added. In contrast to reduced FTMA, solutions of 1μM to 50μM oxidized FTMA did not change the ACF of the DNA from that measured using DNA only. This result suggests that oxidized FTMA does not interact with DNA at these concentrations in a manner that affects the relaxation processes involving the DNA in solution.
Figure 3.

Autocorrelation functions obtained at a scattering angle of 90° and temperature of 25°C. Figure (a) corresponds to solutions of reduced FTMA and 5μM DNA (in 1mM Li2SO4). Figure (b) corresponds to solutions of oxidized FTMA and 5μM DNA (in 1mM Li2SO4). The symbols correspond to samples prepared at concentrations of FTMA of 0μM (*), 5μM (○), 10μM (Δ), and 50μM (◇).
Before it is possible to interpret the ACFs shown in Figure 3 in terms of size, it is necessary to determine whether the ACFs arise solely from center-of-mass (CM) diffusion of DNA or DNA-FTMA aggregates. Previous light scattering studies reported that for relatively short DNA fragments (<2500bp) both internal motions of the DNA chains and translational diffusion contributed to multiple relaxation modes for scattering angles higher than 57°.47,48 In contrast, studies using longer DNA strands (48.5 and 167kbp, including the same Lambda phage DNA used in this study) found CM diffusion to be the sole contributor to the ACF for scattering angles of 105°–60°.29 We performed measurements of ACFs of solutions of FTMA and DNA at the concentrations reported in Figure 3 over multiple scattering angles (105°, 90°, and 75°) to determine whether the ACFs in Figure 3 contained contributions due to relaxation processes other than center-of-mass diffusion. In cases where center-of-mass diffusion is the only contributor to the ACF, the delay time is inversely proportional to the magnitude of the scattering vector squared, as shown in Equation (1), and the same rescaled ACF will be observed for all angles. Figure 4 shows the ACFs of solutions of DNA and 10μM reduced FTMA as a function of the delay time multiplied by the magnitude of the scattering vector squared. Inspection of Figure 4 reveals that the ACFs measured at multiple angles, when rescaled, do superimpose each other. We therefore concluded that internal motions of the DNA and FTMA complexes do not contribute to the ACFs reported in Figure 3.
Figure 4.

Autocorrelation functions of complexes formed between 5μM DNA and 10μM reduced FTMA (in 1mM Li2SO4) at a temperature of 25°C and scattering angles of 75° (Δ), 90° (○), and 105° (□).
Because the ACFs in Figure 3 arise solely from CM diffusion, we used an intensity-based CONTIN analysis to calculate the hydrodynamic sizes of aggregates in the FTMA-DNA solutions (Figure 5). Figure 5a shows the CONTIN analysis of a solution of DNA alone. The range of sizes shown in Figure 5a is broad with an average value of 234nm (Table 1). We interpret this diameter to represent an average hydrodynamic size of DNA coils in extended (non-condensed) conformations. The average size of the DNA coils shown in Figure 5a is approximately the same as that reported previously for Lambda phage DNA.29
Figure 5.
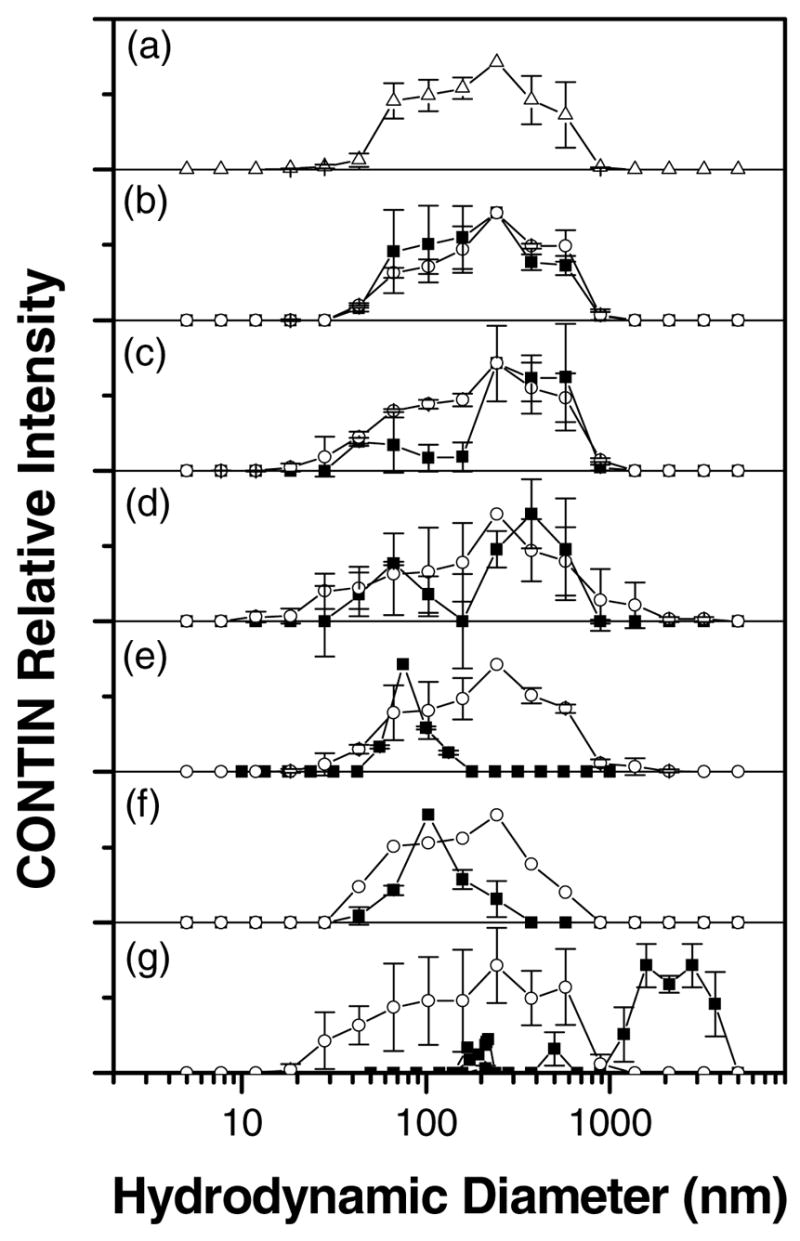
Distribution of hydrodynamic diameters of complexes formed between 5μM DNA and FTMA (in 1mM Li2SO4) calculated using an intensity-based CONTIN analysis at a scattering angle of 90° and temperature of 25°C: (a) no surfactant, (b) 1μM FTMA, (c) 2μM FTMA, (d) 5μM FTMA, (e) 10μM FTMA, (f) 30μM FTMA, (g) 50μM FTMA. For graphs (b) - (g), the filled squares correspond to samples prepared using reduced FTMA (■) and the open circles correspond to samples prepared using oxidized FTMA (○). The error bars were calculated as the standard deviation of 2–5 different samples, with 5 measurements per sample.
Table 1.
Average hydrodynamic diameters of complexes formed between 5μM DNA and FTMA (in 1mM Li2SO4) calculated using intensity-based CONTIN analysis at a temperature of 25°C.
| Reduced FTMA | Oxidized FTMA | |||
|---|---|---|---|---|
| Concentration of FTMA (μM) | Diameter of Globule (nm) | Diameter of Coil (nm) | Diameter of Globule (nm) | Diameter of Coil (nm) |
| 0 | NA | 234 ± 30 | Not Applicable (NA) | 234 ± 30 |
| 1 | NA | 239 ± 50 | NA | 277 ± 41 |
| 2 | 55 ± 13 | 364 ± 73 | NA | 254 ± 44 |
| 5 | 66 ± 6 | 348 ± 50 | NA | 291 ± 66 |
| 10 | 85 ± 5 | NA | NA | 265 ± 45 |
| 30 | 121 ± 9 | NA | NA | 215 ± 27 |
| 50 | 2200 ± 440 | NA | NA | 265 ± 92 |
Figure 5b–g show the results of CONTIN analyses of the ACFs of solutions of DNA containing either reduced or oxidized FTMA. The CONTIN analysis of a solution of DNA and 1μM reduced FTMA (Figure 5b) shows a single broad distribution of hydrodynamic sizes, similar to that of DNA in the absence of FTMA (Figure 5a), with an average diameter of approximately 240nm (Table 1). In the presence of 2μM reduced FTMA (Figure 5c), a second peak appears in the CONTIN analysis at a size (55nm) that is smaller than free DNA coils. This second peak increases in intensity when reduced FTMA is present at a concentration of 5μM in the DNA solution (Figure 5d). The presence of these two peaks is consistent with the coexistence of extended DNA coils and compacted DNA globules, as shown in past studies of non-redox-active cationic surfactants.26–32 We observed the coexisting populations of compacted and extended DNA coils to be stable over 2hrs, an observation that is also consistent with past reports of the behavior of non-redox-active cationic surfactants and DNA.26–32
When DNA was added to a solution of reduced FTMA at a final concentration of 10μM reduced FTMA (Figure 5e), the peak corresponding to extended DNA coils (at around 250nm) disappeared and only the peak corresponding to compact DNA globules was observed (85nm). We interpret this result to indicate that all DNA in solution had been transformed by the 10 μM reduced FTMA into compact conformations in solution (see Supplemental Materials). The sizes of DNA-FTMA complexes increased slightly when the concentration of reduced FTMA increased from 10 to 30μM (Figure 5f), which may represent aggregation of condensed DNA. Finally, when DNA was combined with reduced FTMA at a concentration of 50μM, large aggregates (>1μm) were observed to form in solution. We also observed these large aggregates at concentrations of 60μM and 75μM reduced FTMA (data not shown). We interpret this behavior to be aggregation of DNA globules at the beginning of an associative phase separation, as described in past studies.27,29,33 We did not investigate the long-term stability of these aggregates, although it is likely that they are kinetic structures. In contrast to reduced FTMA, addition of oxidized FTMA (2μM to 75μM) to the DNA solution did not significantly change the hydrodynamic size of the DNA (Figure 5).
The DLS measurements described above lead us to conclude that the conformations of DNA (in 1mM Li2SO4) are different in the presence of reduced FTMA as compared to oxidized FTMA. Reduced FTMA behaves in a manner similar to CTAB29, leading to the coexistence of DNA coils and DNA globules at intermediate concentrations (2–5μM), solely DNA globules at higher concentrations (10–30μM), and aggregated globules at very high concentrations (≥ 50μM, shown in Figure 5). In contrast, oxidized FTMA does not change the conformation of DNA in aqueous solutions at any of the concentrations investigated in this study. Our measurements of dynamic light scattering also support the idea that cooperative interactions are necessary for a surfactant to interact with DNA because reduced FTMA, which self-associates in solution, altered the conformation of DNA whereas oxidized FTMA, which does not self-associate, does not appear to change the conformation of DNA over the concentration range studied here (2–75μM oxidized FTMA).
Electrochemical Transformations of DNA/FTMA Complexes
The experiments reported above demonstrate that the conformations of DNA in complexes formed upon addition of DNA to solutions of FTMA depend upon the oxidation state of FTMA. We next sought to determine if in situ changes in the oxidation state of FTMA within preformed complexes of FTMA and DNA would lead to reversible changes in the conformational state of the DNA (and thus whether these complexes can be regarded as equilibrium structures). Here we report on the use of electrochemical methods to achieve in situ oxidation of FTMA within preformed complexes of DNA and FTMA in solution. We performed an electrochemical oxidation of a solution containing DNA and 30μM reduced FTMA (conditions which result in the condensation of DNA into globules, see Figure 5f), by applying a potential of 400mV to a working platinum mesh electrode relative to a silver|silver chloride reference electrode. Measurements of the current passed at the working electrode as well as UV-visible absorption spectra confirmed oxidation of the FTMA within the preformed complexes of FTMA and DNA (see Supplemental Materials).
Figure 6 shows the ACFs of solutions of FTMA and DNA after in situ oxidation of FTMA. As controls, Figure 6 also shows the ACFs of solutions of DNA alone, DNA in the presence of 30μM reduced FTMA, and a sample prepared by mixing DNA and oxidized FTMA. Prior to oxidation, the solution of DNA and 30μM reduced FTMA exhibited an ACF with fast relaxation times as compared to the ACF of DNA alone, consistent with condensation of DNA by FTMA. When the solution of DNA and 30μM reduced FTMA was oxidized in situ as described above, the ACF measured was similar to the ACF of DNA only. This result suggests that in situ transformations of the conformational state of DNA are possible by oxidizing FTMA. Close inspection of Figure 6, however, reveals the presence of slightly longer relaxation times when FTMA was oxidized in situ as compared to when DNA was added to oxidized FTMA. We performed the in situ oxidation of FTMA in triplicate and consistently observed this difference between the samples. One possible explanation for this difference in size is incomplete oxidation of the FTMA within the complex. However, measurements of the current passed during the oxidation as well as UV-visible spectrophotometry (see Supplemental Materials) suggest that complete oxidation of FTMA was achieved (see below for additional discussion). We also note that control experiments performed by addition of FTMA to solutions of DNA pre-exposed to oxidizing potentials of 400mV for 1–1.5 hours were indistinguishable from experiments performed using DNA not exposed to oxidizing potentials (see Supplemental Materials). These results and others49–51 suggest that the oxidizing potential used in the in situ transformation of the FTMA in preformed complexes does not damage the DNA (see below for additional comment).
Figure 6.

Autocorrelation functions of 5μM DNA and 30μM FTMA (in 1mM Li2SO4) at a scattering angle of 90° and temperature of 25°C. The symbols correspond to solutions of DNA without FTMA (*), DNA mixed with reduced FTMA (○), DNA mixed with oxidized FTMA (◇), complexes prepared by in situ oxidation of DNA and reduced FTMA (Δ), and complexes prepared by in situ oxidation of DNA and reduced FTMA followed by addition of L-ascorbic acid to a final concentration of 30μM ( ▲ ).
Distributions of hydrodynamic sizes calculated from the ACFs in Figure 6 using an intensity-based CONTIN analysis are shown in Figure 7. Prior to oxidation, the solution of DNA and 30μM reduced FTMA contained solely condensed DNA globules (see Figure 5f). When the reduced FTMA + DNA solution was oxidized in situ, the hydrodynamic sizes of aggregates increased from 120nm to 270nm (Figure 7a, Table 2). We interpret this change in hydrodynamic size to reflect a change in the conformations of DNA from compact globules to extended coils. The sizes of the aggregates formed from the FTMA-DNA solution oxidized in situ were slightly larger than the sizes in a solution prepared by mixing DNA with oxidized FTMA at a final concentration of 30μM oxidized FTMA (215nm, Table 2). Additionally, the distribution of hydrodynamic sizes was narrower for the solution of DNA and FTMA oxidized in situ (Figure 7a) as compared to the solution prepared by mixing DNA with oxidized FTMA (Figure 5f). These results suggest that the complexes characterized may not correspond to fully equilibrated structures. Our results do, however, demonstrate that it is possible to affect substantial changes in the conformation of DNA by in situ changes in the oxidation state of FTMA within preformed FTMA-DNA complexes.
Figure 7.

Distribution of hydrodynamic diameters of complexes formed between 5μM DNA and 30μM FTMA (in 1mM Li2SO4) calculated using an intensity-based CONTIN analysis at a scattering angle of 90° and temperature of 25°C. Figure (a) corresponds to complexes prepared by in situ oxidation of DNA and reduced FTMA, and Figure (b) corresponds to complexes prepared by in situ oxidation of DNA and reduced FTMA followed by addition of L-ascorbic acid to a final concentration of 30μM. Error bars were calculated using 2–3 different samples, with 5 measurements per sample.
Table 2.
Average hydrodynamic sizes of DNA-FTMA complexes prepared by in situ electrochemical oxidation and subsequent chemical reduction by ascorbic acid. For purposes of comparison, sizes of complexes prepared by mixing DNA with reduced FTMA (row 2), oxidized FTMA (row 3), and DNA without FTMA (row 1) are also shown.
| Sample | Hydrodynamic Diameter (nm) |
|---|---|
| DNA | 234 ± 30 |
| DNA + 30μM reduced FTMA | 121 ± 9 |
| DNA + 30μM oxidized FTMA | 215 ± 27 |
| DNA + 30μM FTMA oxidized in situ | 271 ± 45 |
| DNA + 30μM ascorbic acid | 183 ± 33 |
| DNA + 30μM oxidized FTMA + 30μM ascorbic acid | 119 ± 15 |
| DNA + 30μM reduced FTMA + 30μM ascorbic acid | 102 ± 6 |
| DNA + 30μM FTMA oxidized in situ + 30μM ascorbic acid | 118 ± 9 |
Chemical Transformation of DNA/FTMA Complexes
We previously reported that addition of equimolar ascorbic acid to a solution of oxidized FTMA results in complete reduction of the FTMA.22 Building from these past results, we sought to determine whether it was possible to achieve in situ transformation of the oxidation state of FTMA within preformed complexes of DNA and FTMA by using ascorbic acid as a reducing agent. We first established that addition of equimolar ascorbic acid led to reduction of 30μM oxidized FTMA within complexes with DNA by using UV-visible spectrophotometry (see Supplemental Materials). Next, we used dynamic light scattering to obtain the ACFs of these solutions (Figure 6), and CONTIN to obtain hydrodynamic sizes of the complexes (Figure 7 and Table 2). Inspection of Figure 6 reveals that addition of ascorbic acid to a solution containing DNA and oxidized FTMA resulted in a decrease in the relaxation times of the ACF as compared to the ACF of the solution prior to addition of ascorbic acid. The ACF after addition of ascorbic acid was nearly identical to the ACF of a solution prepared by mixing reduced FTMA and DNA (Figure 6). When the ACF was interpreted using an intensity-based CONTIN analysis (Figure 7b), the calculated hydrodynamic diameter was substantially smaller than the diameter prior to addition of ascorbic acid (Figure 7a). Table 2 shows that the hydrodynamic sizes of these aggregates were very similar to the aggregates formed in a solution of DNA and 30μM reduced FTMA. We interpret this result to indicate that the extended DNA coils that were present in the oxidized FTMA-DNA solution were condensed into DNA globules when ascorbic acid was added. Inspection of Table 2 also reveals that when 30μM ascorbic acid was present in solutions of either DNA alone, or in solutions of reduced FTMA-DNA complexes, there was no change in the hydrodynamic size of the DNA in solution. In summary, these results demonstrate that ascorbic acid can be used to achieve in situ changes in the conformational state of DNA in the presence of FTMA.
Conclusions
We have shown by measurements of dynamic light scattering that control of the oxidation state of a redox-active surfactant (FTMA) can be used to tune DNA-surfactant interactions. Reduced FTMA at a concentration of 2μM to 5μM is shown to behave in a manner similar to other micelle-forming cationic surfactants, leading to the coexistence of DNA in extended coil and compact globule states. As the concentration of reduced FTMA was increased to 30μM, the fraction of DNA in the globular state increased, and at higher concentrations (>50μM), large aggregates were observed. In contrast, oxidized FTMA does not measurably interact with DNA over the same range of concentrations to cause a conformational state of the DNA that is different from DNA alone (extended coils). We further demonstrate that it is possible to chemically or electrochemically transform the oxidation state of FTMA in preformed complexes of FTMA and DNA, thus achieving in situ control over the conformations of DNA in solution. These results provide guidance for the design of surfactant systems that permit active control of DNA-surfactant interactions.
Supplementary Material
Details of the electrochemistry, UV-visible spectrophotometry, and other control experiments. This information is available free of charge via the Internet at http://pubs.acs.org.
Acknowledgments
Financial support was provided by the NSF (CTS-0553760), the NIH (EB-002746), and the Arnold and Mabel Beckman Foundation.
References
- 1.Goddard ED. Interactions of Surfactants with Polymers and Proteins. 1993 [Google Scholar]
- 2.Felgner PL, Gadek TR, Holm M, Roman R, Chan HW, Wenz M, Northrop JP, Ringold GM, Danielsen M. Proceedings of the National Academy of Sciences of the United States of America. 1987;84:7413–7417. doi: 10.1073/pnas.84.21.7413. [DOI] [PMC free article] [PubMed] [Google Scholar]
- 3.Trewavas A. Anal Biochem. 1967;21:324–329. doi: 10.1016/0003-2697(67)90198-4. [DOI] [PubMed] [Google Scholar]
- 4.Sibatani A. Anal Biochem. 1970;33:279–285. doi: 10.1016/0003-2697(70)90298-8. [DOI] [PubMed] [Google Scholar]
- 5.Geck P, Nasz I. Anal Biochem. 1983;135:264–268. doi: 10.1016/0003-2697(83)90681-4. [DOI] [PubMed] [Google Scholar]
- 6.Lasic DD, Templeton NS. Advanced Drug Delivery Reviews. 1996;20:221–266. [Google Scholar]
- 7.Saji T, Hoshino K, Aoyagui S. J Chem Soc, Chem Commun. 1985:865–866. [Google Scholar]
- 8.Hoshino K, Suga K, Saji T. Chem Lett. 1986:979–982. [Google Scholar]
- 9.Hoshino K, Saji T. Chem Lett. 1987:1439–1442. [Google Scholar]
- 10.Hoshino K, Saji TJ. Am Chem Soc. 1987;109:5881–5883. [Google Scholar]
- 11.Saji T, Hoshino K, Ishii Y, Goto MJ. Am Chem Soc. 1991;113:450–456. [Google Scholar]
- 12.Gallardo BS, Hwa MJ, Abbott NL. Langmuir. 1995;11:4209–4212. [Google Scholar]
- 13.Bennett DE, Gallardo BS, Abbott NL. J Am Chem Soc. 1996;118:6499–6505. [Google Scholar]
- 14.Gallardo BS, Metcalfe KL, Abbott NL. Langmuir. 1996;12:4116–4124. [Google Scholar]
- 15.Gallardo BS, Abbott NL. Langmuir. 1997;13:203–208. [Google Scholar]
- 16.Aydogan N, Gallardo BS, Abbott NL. Langmuir. 1999;15:722–730. [Google Scholar]
- 17.Gallardo BS, Gupta VK, Eagerton FD, Jong LI, Craig TVS, Shah RR, Abbott NL. Science (Washington, D C) 1999;283:57–61. doi: 10.1126/science.283.5398.57. [DOI] [PubMed] [Google Scholar]
- 18.Aydogan N, Abbott NL. Langmuir. 2001;17:5703–5706. [Google Scholar]
- 19.Rosslee CA, Abbott NL. Anal Chem. 2001;73:4808–4814. doi: 10.1021/ac010273s. [DOI] [PubMed] [Google Scholar]
- 20.Aydogan N, Abbott NL. Langmuir. 2002;18:7826–7830. [Google Scholar]
- 21.Tsuchiya K, Sakai H, Saji T, Abe M. Langmuir. 2003;19:9343–9350. [Google Scholar]
- 22.Rosslee CA, Khripin C, Foley TMD, Abbott NL. AIChE J. 2004;50:708–714. [Google Scholar]
- 23.Tsuchiya K, Orihara Y, Kondo Y, Yoshino N, Ohkubo T, Sakai H, Abe MJ. Am Chem Soc. 2004;126:12282–12283. doi: 10.1021/ja0467162. [DOI] [PubMed] [Google Scholar]
- 24.Bai G, Graham MD, Abbott NL. Langmuir. 2005;21:2235–2241. doi: 10.1021/la048238e. [DOI] [PubMed] [Google Scholar]
- 25.Hays ME, Abbott NL. Langmuir. 2005;21:12007–12015. doi: 10.1021/la051640o. [DOI] [PubMed] [Google Scholar]
- 26.Dias RS, Antunes F, Miguel MG, Lindman S, Lindman B. Brazilian Journal of Medical and Biological Research. 2002;35:509–522. doi: 10.1590/s0100-879x2002000500002. [DOI] [PubMed] [Google Scholar]
- 27.Lindman B, Mel’nikov SM, Mel’nikova Y, Nylander T, Eskilsson K, Miguel MG, Dias RS, Leal C. Progr Colloid Polym Sci. 2002;120:53–63. [Google Scholar]
- 28.Miguel MG, Pais AACC, Dias RS, Leal C, Rosa M, Lindman B. Colloids Surf, A. 2003;228:43–55. [Google Scholar]
- 29.Dias RS, Innerlohinger J, Glatter O, Miguel MG, Lindman B. J Phys Chem B. 2005;109:10458–10463. doi: 10.1021/jp0444464. [DOI] [PubMed] [Google Scholar]
- 30.Mel’nikov SM, Sergeyev VG, Yoshikawa K. J Am Chem Soc. 1995;117:2401–2408. [Google Scholar]
- 31.Mel’nikov SM, Sergeyev VG, Yoshikawa K. J Am Chem Soc. 1995;117:9951–9956. [Google Scholar]
- 32.Marchetti S, Onori G. J Phys Chem B. 2005;109:3676–3680. doi: 10.1021/jp044867l. [DOI] [PubMed] [Google Scholar]
- 33.Dias RS, Mel’nikov SM, Lindman B, Miguel MG. Langmuir. 2000;16:9577–9583. [Google Scholar]
- 34.Zhu DM, Evans RK. Langmuir. 2006;22:3735–3743. doi: 10.1021/la052161s. [DOI] [PubMed] [Google Scholar]
- 35.Cardenas M, Schillen K, Pebalk D, Nylander T, Lindman B. Biomacromolecules. 2005;6:832–837. doi: 10.1021/bm049422h. [DOI] [PubMed] [Google Scholar]
- 36.Ny A-LMLC, Ted Lee J. J Am Chem Soc. 2006;128:6400–6408. doi: 10.1021/ja0576738. [DOI] [PubMed] [Google Scholar]
- 37.Arscott PG, Ma C, Wenner JR, Bloomfield VA. Biopolymers. 1995;36:345–365. doi: 10.1002/bip.360360309. [DOI] [PubMed] [Google Scholar]
- 38.Widom J, Baldwin RL. J Mol Biol. 1980;144:431–453. doi: 10.1016/0022-2836(80)90330-7. [DOI] [PubMed] [Google Scholar]
- 39.Sen D, Crothers DM. Biochemistry. 1986;25:1495–1503. doi: 10.1021/bi00355a004. [DOI] [PubMed] [Google Scholar]
- 40.Khan MO, Jonsson B. Biopolymers. 1999;49:121–125. [Google Scholar]
- 41.Abbott NL, Jewell CM, Hays ME, Kondo Y, Lynn DM. J Am Chem Soc. 2005;127:11576–11577. doi: 10.1021/ja054038t. [DOI] [PubMed] [Google Scholar]
- 42.Jewell C, Hays ME, Kondo Y, Abbott NL, Lynn DM. J Controlled Release. 2006;112:129–138. doi: 10.1016/j.jconrel.2006.01.014. [DOI] [PubMed] [Google Scholar]
- 43.Kjoniksen AL, Nystrom B, Lindman B. Langmuir. 1998;14:5039–5045. [Google Scholar]
- 44.Pecora R. Dynamic Light Scattering: Applications of Photon Correlation Spectroscopy. Plenum Press; New York, NY: 1985. [Google Scholar]
- 45.Provencher SW. Comput Phys Commun. 1982;27:213–227. [Google Scholar]
- 46.Provencher SW. Comput Phys Commun. 1982;27:229–242. [Google Scholar]
- 47.Sorlie SS, Pecora R. Macromolecules. 1988;21:1437–1449. [Google Scholar]
- 48.Sorlie SS, Pecora R. Macromolecules. 1990;23:487–497. [Google Scholar]
- 49.Ye Y, Ju H. Sensors. 2003;3:128–145. [Google Scholar]
- 50.Teijeiro C, Nejedly K, Palecek E. J Biomol Struct Dyn. 1993;11:313–331. doi: 10.1080/07391102.1993.10508729. [DOI] [PubMed] [Google Scholar]
- 51.Palecek E, Jelen F, Trnkova L. General Physiology and Biophysics. 1986;5:315–329. [PubMed] [Google Scholar]
Associated Data
This section collects any data citations, data availability statements, or supplementary materials included in this article.
Supplementary Materials
Details of the electrochemistry, UV-visible spectrophotometry, and other control experiments. This information is available free of charge via the Internet at http://pubs.acs.org.