

Abstract
Purpose:
To quantitatively assess bone marrow edema-like lesion (BMEL) and the overlying cartilage in osteoarthritis (OA) or anterior cruciate ligament (ACL)-injured knees using magnetic resonance imaging (MRI) and spectroscopic imaging (MRSI).
Materials and Methods:
Eight healthy controls and 30 patients with OA and other injuries who showed BMEL were scanned at 3.0T. A regression model was constructed to automatically calculate the volume of BMEL. Normalized T1ρ z-scores were calculated within BMEL-overlying cartilage. Three-dimensional (3D) MRSI was acquired in the BMEL and surrounding bone marrow.
Results:
The mean T1ρ z-score was significantly higher in BMEL-overlying cartilage than that in surrounding cartilage in the lateral tibia of patients with ACL tears (P < 0.001). Significantly elevated water and unsaturated lipids, and decreased saturated lipids were observed in BMEL. The volume of elevated water correlated with the volume of BMEL. Water content was significantly higher within BMEL than that outside BMEL. The unsaturation index outside BMEL was significantly higher in patients with ACL tears than that in OA.
Conclusion:
3D MRSI and T1ρ mapping provide tools to quantitatively evaluate BMEL in OA and knee injury. This may allow us to better understand pathophysiology and evolution of injuries and degenerative conditions of the knee.
Keywords: bone marrow edema-like lesion, MR spectroscopic imaging, T1ρ, knee, osteoarthritis, anterior cruciate ligament tear
BONE MARROW EDEMA PATTERN is defined as an area of high signal intensity in T2-weighted, fat-saturated magnetic resonance (MR) images or in short inversion time inversion-recovery (STIR) images. These lesions are present in knee osteoarthritis (OA) (1-3) and acute knee injuries, frequently associated with anterior cruciate ligament (ACL) tear (4-6). Although termed as “edema,” these lesions have shown surprisingly little edema based on histopathologic examination (7). Instead, this increase in signal has been attributed to a number of other factors, including abnormal trabeculae, bone marrow necrosis, swelling of fat cells, and marrow bleeding. Therefore, in this study, we term these lesions as bone marrow edema-like lesion (BMEL).
While MR findings of BMEL are common, our knowledge concerning their natural history and significance is limited. In ACL tears, BMEL indicates a so-called bone bruise or impression fracture due to translational injury, where the anterolateral femur impacts the posterolateral tibia (kissing contusions) when the ACL is ruptured. A number of studies have proposed that the overlying cartilage has sustained irreversible injury during impact, and thus, cartilage degeneration can continue to occur despite the fact that functional stability of the knee is restored following ACL reconstruction (8,9). In OA, BMEL has been associated with the severity and progression of OA (2,10), and pain in OA (10,11). However, the causal relationship between these lesions and the disease progression is unclear. Better understanding of the interrelation of cartilage and the bone immediately under it is also necessary.
Recent advances in MRI allow quantitative measures of volumetric and biochemical changes of cartilage prior to macroadaptive changes seen on traditional radiographs. In particular, T1ρ has been proposed as an attractive candidate to probe the early changes in cartilage extracellular matrix (ECM) during early stages of cartilage degeneration (12-15). T1ρ describes the spin-lattice relaxation in the rotating frame. It provides low-frequency information and probes changes in macromolecules. T1ρ relaxation rate (1/T1ρ) has been shown to decrease linearly with decreasing proteoglycan (PG) content in ex vivo bovine patellae (16). In vivo studies have also shown increased cartilage T1ρ values for patients with OA (17-19).
One difficulty in studying BMEL lies in quantification of these lesions due to its ill-defined shape in MR images. Most previous imaging studies used qualitative (presence of high signal or not) (4,6,11), or semiquantitative evaluations (scoring the size of bone bruise volume) (1,10). Recent studies on measuring volume of BMEL manually or semiautomatically using MR images provide potential for quantitative evaluation of such lesions (5,20-22). Such quantification of BMEL may allow better classification of these lesions and potentially a better prediction to their prognosis.
Furthermore, proton MR spectroscopy (MRS) provides a noninvasive method for quantifying biochemical or metabolic changes in tissues. 3D MR spectroscopic imaging (MRSI) will further allow examining the spatial distribution of the metabolic levels. In the case of bone marrow, the water and lipids contents are of interest (23-26). Different compartments of lipids can be also investigated using MRS. Of particular interest are indices that provide measures of the unsaturation levels among the triglycerides, which may have potential medical applications (27,28). MRS has been used widely in cerebral imaging and other tissues/organs such as prostate, breast, and muscle. However, few studies have investigated MRS in knee bone marrow (29).
The objective of this study was to apply quantitative MRI and 3D MRSI methods to assess BMEL in patients with OA and ACL tears. Specifically, the goals were: 1) to establish an automatic method to calculate the volume of BMEL; 2) to quantify water and lipids changes in BMEL using 3D MRSI; and 3) to assess composition changes in cartilage overlying areas of BMEL using measurements of T1ρ relaxation time.
MATERIALS AND METHODS
Subjects
Eight healthy volunteers (three female and five male, mean age = 28.5 years, age range = 20–34 years), 30 patients with knee OA or knee injuries (seven female and 23 male, mean age = 37.4 years, age range = 20–66 years) who showed BMEL were recruited for this study. A total of 13 patients have been diagnosed with knee OA based on clinical symptoms and typical radiographic signs of OA (i.e., osteophytes, subchondral sclerosis, and joint space narrowing). A total of 15 patients had ACL tears, one had osteochondrosis dissecans (OCD) and one had a posterior cruciate ligament (PCL) tear. Among these patients, 10 patients with OA (five female and five male; mean age = 38.5 years, age range = 20–66 years) and 14 patients with ACL injuries (four female and 10 male; mean age = 31.4 years, age range = 20–46 years) were examined with T1ρ imaging and 3D MRSI as detailed below. The patients with ACL injuries were scanned within two months of the injury (the acute stage of injury). The study was approved by the Committee for Human Research at our institution. Informed consent was obtained from all of the subjects.
MRI and Spectroscopic Imaging Protocol
MR data were acquired on a 3T GE Excite Signa MR scanner (General Electric, Milwaukee, WI, USA) using a transmit/receive quadrature knee coil (Clinical MR Solutions, Brookfield, WI, USA). The protocol consisted of morphologic imaging sequences, T1ρ quantitation sequence, and 3D spectroscopic imaging sequence. High-order shimming (HOS) from the GE scanner was applied to improve shimming in the regions of interest.
Morphologic Imaging
The imaging protocol included sagittal T2-weighted fat-saturated fast spin-echo (FSE) images (TR/TE = 4300 msec/51 msec, field of view [FOV] = 14 cm, matrix size = 512 × 256, slice thickness = 2.5 mm, gap = 0.5 mm, echo train length [ETL] = 9, bandwidth [BW] = 31.25 kHz, number of excitations [NEX] = 2) and sagittal 3D water excitation high-resolution spoiled gradient-echo (SPGR) images (TR/TE = 15 msec/6.7 msec, flip angle = 12, FOV = 14 cm, matrix size = 512 × 512, slice thickness = 1 mm, BW = 31.25 kHz, NEX = 0.75). The T2-weighted fat-saturated FSE images were used to evaluate and quantify BMEL, as well as to evaluate cartilage morphology. The high-resolution SPGR images were used to segment cartilage.
T1ρ Quantitation Sequences
The sagittal 3D T1ρ-weighted imaging sequence was composed of two parts: magnetization preparation based on spin-lock techniques, as previously developed (19) for the imparting of T1ρ contrast, and an elliptical-centered segmented 3D SPGR acquisition immediately after T1ρ preparation during transient signal evolution. The duration of the spin-lock pulse was defined as time of spin-lock (TSL), and the strength of the spin-lock pulse was defined as spin-lock frequency (FSL). The number of α pulses after each T1ρ magnetization preparation was defined as views per segment (VPS). There was a relatively long delay (time of recovery, Trec) between each magnetization preparation to allow enough and equal recovery of the magnetization before each T1ρ preparation. The imaging parameters are: TR/TE = 9.3 msec/3.7 msec, FOV = 14 cm, matrix size = 256 × 192, slice thickness = 3 mm, BW = 31.25 kHz, VPS = 48, Trec = 1.5 seconds, TSL = 0, 10, 40, and 80 msec, FSL = 500 Hz.
3D MRSI Sequence
3D MRSI data were obtained using a point-resolved spectral-selection (PRESS) volume selection technique. The region of interest (ROI), or the PRESS box, was prescribed on sagittal T2-weighted fat-saturated images to cover the BMEL as much as possible, and to include some normal-appearing bone marrow as internal references for postprocessing and analysis. Very selective suppression (VSS) pulses developed in our laboratory (30) were used to suppress signals from outside tissues, to minimize the contamination to water and lipid signals of interest. The 3D data were phase-encoded with 8 × 8 × 8 matrices, providing a nominal voxel size of 5 × 5 × 5 mm3. The TR of two seconds and TE of 35 msec (as short as the sequence allowed) were used to minimize T1 and T2 weight in spectral data. Each free induction decay (FID) signal was sampled with 1024 points, a dwell time of 0.5 msec, and a sweep width of 2000 Hz. The spectral data were transferred to a Sun workstation (Sun Microsystems, Palo Alto, CA, USA) for offline postprocessing.
MR Data Postprocessing
BMEL Volume Calculation
An autoregression model was generated for BMEL volume calculation. First, BMEL was identified by two radiologists in T2-weighted fat-saturated FSE images. A threshold-based 3D contour of BMEL was generated using an in-house developed software based on IDL software (Boulder, CO, USA). The threshold was adjusted until both radiologists were satisfied with the BMEL definition. This threshold was used in the following studies as the “gold standard” threshold. After the threshold was determined, the volume of these lesions was calculated automatically using the generated 3D contours.
Second, a ROI was defined manually in normal-appearing bone marrow in the same compartment as the BMEL (Fig. 1a). Mean and standard deviation (SD) of the signal intensity were calculated within this ROI and were denoted as NBM.mean and NBM.SD.
Figure 1.
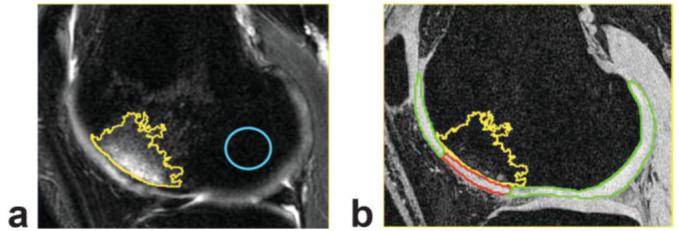
Definition of BMEL and overlying cartilage vs. surrounding cartilage. a: The T2-weighted fat-saturated FSE image. Yellow contour: BMEL; blue contour: normal-appearing bone marrow in the same compartment. Mean and SD of signal intensity within normal-appearing bone marrow were measured and used to calculate threshold for BMEL segmentation. The T2-weighted image is aligned to SPGR image. b: The SPGR image with cartilage segmented and defined as BMEL-overlying cartilage (red) and surrounding cartilage (green).
Finally, a regression model was established using NBM.mean and NBM.SD as independent variables x1 and x2, and “gold standard” thresholds determined by radiologists as dependent variable “y.” Using the fitted threshold, a fitted volume of BMEL was calculated automatically using the same software mentioned above. This fitted threshold and the resulting fitted volume were compared with the “gold standard” threshold and volume as below:
| [1] |
| [2] |
where TGS, Tfitted, VGS, and Vfitted were gold standard threshold, fitted threshold, gold standard volume, and fitted volume, respectively.
“Leave-one-out” cross-validation was used to estimate the fitting error of the model. In addition, the lesions were randomly divided into training (N = 30) and testing (N = 8) data sets. A regression model was established using the training data only. This model was then applied to the testing data. A third radiologist was asked to manually determine the threshold for segmenting the BMEL. The difference between the resulting BMEL volume and the “gold standard” volume was used to define the interobserver differences. This difference was compared with the fitting errors from the regression model.
T1ρ Relaxation Quantification
The T1ρ map was reconstructed by fitting the image intensity pixel-by-pixel to the equation below using a Levenberg-Marquardt mono-exponential fitting algorithm developed in-house with C language:
| [3] |
T1ρ-weighted images with the shortest TSL (therefore with highest SNR) were rigidly registered to high-resolution T1-weighted SPGR images acquired in the same exam using the VTK CISG Registration Toolkit (31). The transformation matrix was applied to the reconstructed T1ρ map.
Cartilage was segmented semiautomatically in SPGR images using an in-house–developed program with MATLAB, based on edge detection and Bezier splines (32). The segmentation was corrected manually to avoid synovial fluid or other surrounding tissue, and 3D cartilage contours were generated. Five compartments were defined: lateral and medial femur condyle (LFC and MFC), lateral and medial tibia (LT and MT), and patella. The LFC and MFC were then further divided into weight-bearing, non-weight-bearing anterior, and non-weight-bearing posterior subcompartments. The weight-bearing portions of the cartilage were defined as those sections in which the degree between the normal vectors of the splines and the longitudinal axis of the femur was smaller than 30°. Mean and SD of T1ρ values were calculated in each of these compartments in controls. T1ρ z-score maps were generated pixel by pixel for all the patients as:
| [4] |
where Voxell is the T1ρ in the voxel of interest, and Meancomparment and SDcomparment are the mean and SD of T1ρ values in each compartment derived from controls.
To determine the BMEL-overlying and surrounding cartilage, the T2-weighted fat-saturated FSE images were also aligned to the high-resolution SPGR images. The 3D cartilage contour generated from SPGR images were overlaid on the aligned FSE images from which BMEL was identified. Then the BMEL overlying and surrounding cartilage was determined manually, as shown in Fig. 1b. These contours of the BMEL overlying and surrounding cartilage were overlaid to T1ρ z-score maps. The mean and SD of T1ρ z-scores within these contours were calculated and compared.
3D MRSI Postprocessing
The spectral data were reconstructed, and corrected for phase, baseline, and frequency shift using an in-house–developed program (33). Spectral assignments were made based on previous studies (27,28): olefinic protons (–CH = CH–) around 5.35 ppm, water around 4.65 ppm, methylene protons (–CH = CHCH2–) around 2.06 ppm, bulk methylene protons (–(CH2)n–) around 1.3 ppm, and terminal methyl protons (–CH3) around 0.9 ppm. Voigt functions were used to fit the peaks in the frequency domain using a previously developed program (34). Signal amplitudes were quantified for each pixel resulting in a 3D metabolic images for each peak.
The 3D metabolic images were resampled with sinc interpolation, resulting in a resolution of 0.6 × 0.6 × 0.6 mm3. 3D contours for regions with significantly elevated water and unsaturated lipids (olefinic at 5.35 ppm), defined as metabolic levels more than 20 times the SD of noise, were generated. The volumes of these abnormalities were calculated for each patient. Water contents and lipids unsaturation index, as defined below, were calculated for each voxel:
| [5] |
| [6] |
where Iwater, Iolefinic, and Imethylene are signal amplitudes of water, olefinic (unsaturated lipids), and methylene (dominating saturated lipids), respectively. The 3D metabolic images of these two parameters were also resampled with sinc interpolation and the mean values were compared within and outside BMEL contours for each patient.
In this study, only one BMEL lesion per knee was studied with 3D MRSI due to the long acquisition time of this sequence (17 minutes). For patients with multiple BMELs, the most significant lesion was covered during 3D MRSI acquisition.
Statistical Analysis
The mean T1ρ of BMEL overlying cartilage was compared with that of surrounding cartilage using a paired t-test. The correlation between volumes of BMEL and significantly elevated water and unsaturated-lipids were calculated using a standard Pearson correlation. A Student's t-test was used to compare the volumes of BMEL, elevated water, and elevated unsaturated lipids between patients with OA and ACL tears. A t-test was also used to compare the water content and unsaturation index within and outside BMEL for both groups of patients.
RESULTS
Bone Marrow Volume Calculation
The generated model was:
| [7] |
where NBM.mean and NBM.SD are mean and SD of signal intensity within normal-appearing bone marrow in the same compartment. Using “leave-one-out” method, the fitting error of the regression model was 12.8% ± 5.6% for thresholds and 18.4% ± 12.0% for volumes. When the data was divided into the training group and testing groups, the fitting error of the regression model was 15.1% ± 5.8% for thresholds and 26.0% ± 13.8% for volumes. The difference in threshold and volume from the third observer (or the interobserver difference) for manual definition was 21.4% ± 12.0% for threshold and 40.8% ± 30.1% for volume. The fitting error from the regression model was much lower than the interobserver differences based on manual definition, showing the robustness of the model.
T1ρ in BMEL Overlying Cartilage
The T1ρ values in non-weight-bearing portions are significantly higher than those in weight-bearing portions (P < 0.05) in controls (Table 1). Among patients with ACL tears, six had BMEL in LT only, two in LFC only, and six had in both LT and LFC compartments. Four patients also showed BMEL in MT. The mean T1ρ z-scores of BMEL-overlying cartilage in LT of patients with ACL tears was significantly higher than that in surrounding cartilage (2.2 ± 3.1 vs. 0.3 ± 2.3, P < 0.001) (Table 2). However, no significant difference was observed in the LFC compartment of patients with ACL tears. Among OA patients, six had BMEL in MFC only, two in both MFC and MT, one in LFC only, and one in both LFC and LT. No significant difference was found in the mean T1ρ z-score between BMEL-overlying cartilage and surrounding cartilage in patients with OA (1.9 ± 3.1 vs. 1.0 ± 2.1, P = 0.37). Figure 2 shows a patient with ACL injuries who had BMEL in both LT and LFC (Fig. 2a), and a patient with OA who showed BMEL in MFC (Fig. 2b). T1ρ values were increased in BMEL-over-lying cartilage in LT (Fig. 2a, white arrow) but not in BMEL-overlying cartilage in LFC (Fig. 2a, yellow arrow) in the ACL-injured knee. No significant elevation of T1ρ values was observed in the OA patient.
Table 1.
Mean and SD of T1ρ Values (msec) in the Nine Compartments in Controls
| LFC-nwb-ant | LFC-nwb-post | LFC-wb | MFC-nwb-ant | MFC-nwb-post | MFC-wb | LT | MT | |
|---|---|---|---|---|---|---|---|---|
| Mean | 47.0* | 42.7* | 38.4 | 41.2* | 40.3* | 36.9 | 36.0 | 34.9 |
| SD | 6.14 | 4.3 | 2.0 | 4.6 | 3.5 | 2.8 | 2.9 | 3.1 |
P < 0.05 between nwb and wb regions.
nwb = non-weight-bearing, wb = weight-bearing, ant = anterior, post = posterior.
Table 2.
Mean and SD of T1ρ Z-Scores in BMEL Overlying and Surrounding Cartilage in Patients With OA and With ACL Tears
| OA (n = 10) | ACL |
||
|---|---|---|---|
| LT (N = 12) | LFC (N = 8) | ||
| Overlying | 1.9 ± 3.1 | 2.2 ± 3.1 | −0.8 ± 2.7 |
| Surrounding | 1.0 ± 2.1 | 0.3 ± 2.3 | −0.3 ±1.1 |
| P values | 0.37 | <0.001 | 0.63 |
Figure 2.

T1ρ Z-score maps for an ACL tear patient who showed BMEL in both LFC and LT (a) and for an OA patient who showed BMEL in MFC (b). Significant elevated T1ρ values were found in BMEL-overlying cartilage in LT (a: white arrow) but not in BMEL-overlying cartilage in LFC (a: yellow arrow) in the ACL-injured knee. No significant difference in T1ρ values was found between BMEL-overlying vs. surrounding cartilage in the OA patient.
3D MRSI
Figure 3 presents the typical spectra for a healthy volunteer (Fig. 3a), a patient with OA (Fig. 3b), and a patient with ACL tear (Fig. 3c). In healthy controls, saturated lipids at 1.3 ppm dominated the signal. All of the patients who had OA or ACL tears showed significantly elevated water in BMEL. Eight of 10 patients with OA, and 13 of 14 patients with ACL tears showed significantly elevated unsaturated lipids. Significant decrease of saturated lipids was observed within BMEL.
Figure 3.

MR spectral data in bone marrow in a healthy volunteer (a), a patient with OA (b), and a patient with ACL tear (c). In healthy controls, saturated lipids at 1.3 ppm dominated the signal. Significantly elevated unsaturated lipids peaks at 5.35 ppm and water peaks at 4.65 ppm were observed in patients with OA and ACL tear. Significantly elevated water peaks were more focused within BMEL, while significantly elevated unsaturated lipid peaks extended outside the BMEL. Saturated lipids decreased within BMEL.
The volume of elevated water correlated significantly with the volume of BMEL (R = 75.5%, P < 0.001) (Fig. 4). No correlation was found between the volume of elevated unsaturated lipids and the volume of BMEL. Patients with ACL tears had larger volumes of BMEL, elevated water and elevated unsaturated lipids, but these differences were not significant (P > 0.05), Table 3.
Figure 4.

Scatter plot of volumes of significantly elevated water vs. BMEL volumes.
Table 3.
Volumes of BMEL, Elevated Water, and Elevated Unsaturated Lipids for Patients With OA (N = 10) and With ACL Tears (N = 14)
| BMEL (cm3) | Water (cm3) |
Unsaturated lipids (cm3) | |
|---|---|---|---|
| OA | 9.48 ± 2.69 | 5.93 ± 2.53 | 2.50 ± 1.66 |
| ACL tear | 10.83 ± 3.44 | 7.55 ± 2.89 | 3.87 ± 1.77 |
| P values | 0.29 | 0.16 | 0.07 |
The water content was significantly higher within BMEL than that outside BMEL (21.8 ± 9.9% vs. 14.3 ± 5.9%, P = 0.002). The unsaturation index was also higher within BMEL than that outside BMEL, but with an edge significance (3.7 ± 3.5% vs. 2.3 ± 1.2%, P = 0.088). When the patients with OA and ACL were examined separately, the same trend was observed comparing the water content and unsaturation index between within and outside BMEL. This difference, however, was significant only for water content of patients with ACL tears (21.4 ± 9.1% vs. 13.0 ± 5.2%, P = 0.001), Figure 5a. The unsaturation index outside BMEL in patients with ACL tears was significantly higher than that outside BMEL in patients with OA (2.7 ± 1.3% vs. 1.7 ± 0.8%, P = 0.04), Fig. 5b.
Figure 5.

Water content (%) and unsaturation index (%) within and outside BMEL for patient with OA and ACL tears. Bright: within BMEL; dark: outside BMEL. (a) Water content for patients with OA and ACL tears, (b) unsaturation index for patients with OA and ACL tears, (c) water content for patients with ACL tears, and (d) unsaturation index for patients with ACL tears; with BMEL located in LT and LFC, respectively. Stars indicate where the difference is significant (P < 0.05).
Among the 14 BMELs within ACL-injured knees that had 3D MRSI data, seven were from LT and seven were from LFC. Both water content and unsaturation index within BMEL were significantly higher than those outside BMEL for lesions within LT (26.5 ± 6.2% vs. 13.2 ± 6.7%, P = 0.0004 for water content; 5.8 ± 3.3% vs. 2.7 ± 1.4% P = 0.03 for unsaturation index). No significant difference was found in these two parameters between within and outside BMEL for lesions within LFC. The water content and unsaturation index within BMEL in LT were significantly higher than those in LFC (26.5 ± 6.2% vs. 16.3 ± 9.0%, P = 0.03 for water content; 5.8 ± 3.3% vs. 2.1 ± 1.8%, P = 0.03). The results are summarized in Fig. 5c and d.
DISCUSSION
In this study, we developed a comprehensive protocol to quantitatively assess BMEL in knee OA and acute knee injuries. Specifically, the BMEL volume was calculated automatically using a regression model; the water and lipids contents were quantified using 3D MRSI; and finally the BMEL overlying cartilage was assessed with T1ρ relaxation mapping technique.
In a previous study, the BMEL at the foot and ankle was manually delineated in each slice, then the lesion volume was calculated by multiplication of the cross-sectional areas and the section thickness plus intersection gap (20). This method is time-consuming and subjective because the lesion is manually determined in each slice. A simplified and faster method was to manually measure the maximal diameters of the lesion in all three dimensions using coronal and sagittal images, then the lesion volume was calculated by multiplying the three diameters (5). This method, however, introduced large inaccuracy into volume calculation due to the fuzzy shape (rather than a cubic shape) of BMEL. More recently, threshold-based methods to segment and quantify BMEL have been proposed (21). The key point is how to determine the threshold accurately.
In this study, a regression model was established to calculate the threshold automatically based on the mean and SD of signal intensity in normal-appearing bone marrow in the same compartment. The only manual interference in our method is to draw an ROI within the normal-appearing bone marrow within the same compartment as BMEL. The same compartment's bone marrow is used because it has been observed in our study that the signal intensity in T2-weighted fat-saturated FSE images can be significantly different from compartment to compartment, mainly due to varying performance of fat suppression. The model was validated with a “reference” threshold based on consensus analysis by two radiologists since no true gold standards for BMEL definition are available. The automatic calculation of the threshold helps to reduce the subjective interference in selecting a threshold for BMEL definition, thus to reduce intra- and interobserver variability.
MRS provides a noninvasive method to probe biochemical changes within bone marrow, in particular the water and lipid changes. Both the water content and unsaturation index were higher within BMEL than those in the surrounding bone marrow. The increase of water content is consistent with previous histological findings that edema was observed in BMEL, although with a small portion of 4% to 5% (7). The absolute number of the edema percentage from histology is not comparable with the water content defined with MR signals in this study. In histology, the percentage is the ratio of bone marrow edema to all other tissues, including fat, trabeculae, blood vessels, and necrosis; while in MR, the water content is defined as water to fat (mainly mobile fat as measurable by in vivo MRSI). The results from this study suggest that MR is a very sensitive technology in detecting water, or edema, in BMEL in the knee. The origin of the unsaturated lipids remains unclear.
The significance of higher water content in BMEL is driven mainly by lesions within ACL-injured knees. When we divided patients into two groups with ACL tears and OA, the difference in water content between within BMEL and surrounding bone marrow is only significant in patients with ACL tears, but not in OA patients, suggesting that the water increase is more focused within BMEL in ACL-injured knees compared to OA knees. This nonsignificance in OA knees is consistent with a previous histological study that found no significant difference in the prevalence of edema between the BMEL zone and the zone of surrounding bone marrow with a normal MRI appearance (7). The unsaturation index is lower in OA knees than that in ACL-injured knees both within and outside BMEL (significant only outside BMEL). These different properties of increased water and unsaturated lipids imply that there may be different biochemical changes taking place in BMEL between OA knees with “chronic” bone marrow lesions, and ACL-injured knees with “acute” bone marrow lesions.
We further examined BMEL within LT and LFC compartments separately in ACL-injured knees. There is no significant difference regarding volumes of BMEL in MR images between these two sites (13.1 ± 11.8 cm3 in LFC vs. 9.7 ± 6.0 cm3 in LT, P > 0.05). However, the water and lipids changes are more significant in lesions within LT, as shown in Fig. 5. These results suggest that the impact of the initial trauma during ACL injuries may be different in these two sites, resulting in different biochemical changes in bone marrow.
It has been documented that patients with ACL tears have a high risk of developing OA even after ACL reconstruction (35). Long-term follow-up studies reported that there was a high prevalence of radiographic OA, pain, and functional limitations in ACL-injured patients 10 to 20 years after injuries (36,37). ACL-injured patients with posttraumatic OA are also reported to be 15 to 20 years younger than patients with primary OA (38). The mechanism, both mechanically and biochemically, responsible for cartilage degeneration in ACL-injured knees remains elusive. One speculation is that the initial ligament injury resulted in irreversible changes to the overlying cartilage and subchondral bone (9). Two studies reported that histological samples of the occult bone bruises and overlying cartilage in ACL-injured knees revealed necrosis of osteocytes, degeneration of overlying chondrocytes, and loss of the proteoglycan component in cartilage matrix (8,39).
In this study, significantly elevated T1ρ was found in BMEL-overlying cartilage in the lateral tibia of patients with ACL tear. These increased T1ρ values may be indicator of decreased PG contents in cartilage in that region. Two patients have been confirmed to have cartilage damage in regions with elevated T1ρ values using arthroscopic images, as documented in a previously published case report (40). Figure 6 shows one patient's data (reprinted with permission). T1ρ values are not significantly elevated, however, in the overlying cartilage at the lateral femoral condyles of the eight ACL-injured patients who had BMEL in this compartment. As suggested by 3D MRSI, these different T1ρ values in LFC vs. LT imply that the impact of the initial trauma to these two compartments and corresponding overlying cartilage may be different. Longitudinal follow-up examinations are warranted to further investigate this potential difference.
Figure 6.

A patient with ACL tear showed BMEL in lateral tibia. a: Color coded T1ρ relaxation time maps. T1ρ values were significantly elevated in BMEL-overlying cartilage in posterolateral tibia plateau (white arrow) vs. surrounding cartilage in the same compartment (60.2 ± 13.7 msec vs. 37.5 ± 14.3 msec). b: Arthroscopic picture demonstrating grade I softening of the posterolateral tibial plateau with linear partial fissures along the articular cartilage overlying the region of the BMEL (black arrow). Regenerated from Ref 40 with permission.
BMEL is also commonly seen in OA and has been well documented in previous studies for patients with mild to severe osteoarthritic knees (1-3). However, the findings on correlation between the presence of BMEL and clinical OA symptoms such as pain and stiffness are not consistent in the literature (10,11). Regarding the association between BMEL and disease severity, Link et al (1) reported a significant increase of presence of BMEL with an increased Kellgren-Lawrence (K-L) score. Felson et al (10) found a correlation between BMEL and structure deterioration in knee OA, and between BMEL and frontal plane malalignment. The data in their study showed that much of the relationship of BMEL to radiographic progression was actually explained by its association with malalignment, although there was still a substantial residual association of BMEL with radiographic progression after adjustment of malalignment. The authors concluded that OA disease progression in patients with BMEL may be the consequence of the lesions themselves, or malalignment may produce both the traumatic bone lesions and the wearing away of local cartilage.
In this study, the mean T1ρ z-score in BMEL-overlying cartilage was not significantly higher than that in surrounding cartilage in patients with OA. This result suggests that the lesions in bone marrow in osteoarthritic knees may be different compared with those found in knees with ACL tears. In the acute knee injuries, the impact of trauma on cartilage and underlying bone is more local; while in OA, the damage cartilage and underlying bone can be more global. The causal relationship is not clear between cartilage degeneration and underlying bone injuries in OA and needs further investigation.
There are several limitations of the present study. The defined regions of BMEL were compared with manual identification but not validated with histologic analysis as was done by Zanetti et al (7). The mean age of the control group is 28.5 years, which is younger than the ACL-injured and OA patient groups (mean age = 31.5 years and 38.5 years, respectively). Other quantitative measurements, in particular T2 quantification, were not reported because they were only performed in a subgroup of the patients in this study and the sample size was too small.
In conclusion, 3D MRSI in bone marrow and T1ρ quantification in cartilage provide quantitative assessment of cartilage and bone in acute and chronic knee injuries. Significantly elevated water and unsaturation lipids were observed in BMEL. Significantly elevated T1ρ values were found in BMEL-overlying cartilage, suggesting injury and degeneration in these regions. We are currently following these patients longitudinally. This technology may allow us to critically evaluate and quantify longitudinal evolution as well as medical and surgical treatments in traumatic and degenerative conditions of the knee.
ACKNOWLEDGEMENT
We thank Dr. Jan Bauer for his help with reviewing the MR images.
Contract grant sponsor: Aircast Foundation; Contract grant sponsor: National Institutes of Health (NIH); Contract grant numbers: K25 AR053633, RO1 AR46905.
REFERENCES
- 1.Link TM, Steinbach LS, Ghosh S, et al. Osteoarthritis: MR imaging findings in different stages of disease and correlation with clinical findings. Radiology. 2003;226:373–381. doi: 10.1148/radiol.2262012190. [DOI] [PubMed] [Google Scholar]
- 2.Felson DT, McLaughlin S, Goggins J, et al. Bone marrow edema and its relation to progression of knee osteoarthritis. Ann Intern Med. 2003;139(Pt 1):330–336. doi: 10.7326/0003-4819-139-5_part_1-200309020-00008. [DOI] [PubMed] [Google Scholar]
- 3.Kornaat P, Bloem J, Ceulemans R, et al. Osteoarthritis of the knee: association between clinical features and MR imaging findings. Radiology. 2006;239:811–817. doi: 10.1148/radiol.2393050253. [DOI] [PubMed] [Google Scholar]
- 4.Bretlau T, Tuxoe J, Larsen L, Jorgensen U, Thomsen HS, Lausten GS. Bone bruise in the acutely injured knee. Knee Surg Sports Traumatol Arthrosc. 2002;10:96–101. doi: 10.1007/s00167-001-0272-9. [DOI] [PubMed] [Google Scholar]
- 5.Roemer FW, Bohndorf K. Long-term osseous sequelae after acute trauma of the knee joint evaluated by MRI. Skeletal Radiol. 2002;31:615–623. doi: 10.1007/s00256-002-0575-z. [DOI] [PubMed] [Google Scholar]
- 6.Costa-Paz M, Muscolo DL, Ayerza M, Makino A, Aponte-Tinao L. Magnetic resonance imaging follow-up study of bone bruises associated with anterior cruciate ligament ruptures. Arthroscopy. 2001;17:445–449. doi: 10.1053/jars.2001.23581. [DOI] [PubMed] [Google Scholar]
- 7.Zanetti M, Bruder E, Romero J, Hodler J. Bone marrow edema pattern in osteoarthritic knees: correlation between MR imaging and histologic findings. Radiology. 2000;215:835–840. doi: 10.1148/radiology.215.3.r00jn05835. [DOI] [PubMed] [Google Scholar]
- 8.Johnson DL, Urban WP, Jr, Caborn DN, Vanarthos WJ, Carlson CS. Articular cartilage changes seen with magnetic resonance imaging-detected bone bruises associated with acute anterior cruciate ligament rupture. Am J Sports Med. 1998;26:409–414. doi: 10.1177/03635465980260031101. [DOI] [PubMed] [Google Scholar]
- 9.Faber KJ, Dill JR, Amendola A, Thain L, Spouge A, Fowler PJ. Occult osteochondral lesions after anterior cruciate ligament rupture. Six-year magnetic resonance imaging follow-up study. Am J Sports Med. 1999;27:489–494. doi: 10.1177/03635465990270041301. [DOI] [PubMed] [Google Scholar]
- 10.Felson DT, Chaisson CE, Hill CL, et al. The association of bone marrow lesions with pain in knee osteoarthritis. Ann Intern Med. 2001;134:541–549. doi: 10.7326/0003-4819-134-7-200104030-00007. [DOI] [PubMed] [Google Scholar]
- 11.Sowers MF, Hayes C, Jamadar D, et al. Magnetic resonance-detected subchondral bone marrow and cartilage defect characteristics associated with pain and X-ray-defined knee osteoarthritis. Osteoarthritis Cartilage. 2003;11:387–393. doi: 10.1016/s1063-4584(03)00080-3. [DOI] [PubMed] [Google Scholar]
- 12.Duvvuri U, Reddy R, Patel SD, Kaufman JH, Kneeland JB, Leigh JS. T1rho-relaxation in articular cartilage: effects of enzymatic degradation. Magn Reson Med. 1997;38:863–867. doi: 10.1002/mrm.1910380602. [DOI] [PubMed] [Google Scholar]
- 13.Nugent AC, Johnson GA. T1rho imaging using magnetization-prepared projection encoding (MaPPE) Magn Reson Med. 2000;43:421–428. doi: 10.1002/(sici)1522-2594(200003)43:3<421::aid-mrm14>3.0.co;2-x. [DOI] [PubMed] [Google Scholar]
- 14.Akella SV, Regatte RR, Gougoutas AJ, et al. Proteoglycan-induced changes in T1rho-relaxation of articular cartilage at 4T. Magn Reson Med. 2001;46:419–423. doi: 10.1002/mrm.1208. [DOI] [PubMed] [Google Scholar]
- 15.Mlynarik V, Szomolanyi P, Toffanin R, Vittur F, Trattnig S. Transverse relaxation mechanisms in articular cartilage. J Magn Reson. 2004;169:300–307. doi: 10.1016/j.jmr.2004.05.003. [DOI] [PubMed] [Google Scholar]
- 16.Regatte RR, Akella SV, Borthakur A, Kneeland JB, Reddy R. Proteoglycan depletion-induced changes in transverse relaxation maps of cartilage: comparison of T2 and T1rho. Acad Radiol. 2002;9:1388–1394. doi: 10.1016/s1076-6332(03)80666-9. [DOI] [PubMed] [Google Scholar]
- 17.Duvvuri U, Charagundla SR, Kudchodkar SB, et al. Human knee: in vivo T1(rho)-weighted MR imaging at 1.5 T—preliminary experience. Radiology. 2001;220:822–826. doi: 10.1148/radiol.2203001662. [DOI] [PubMed] [Google Scholar]
- 18.Regatte RR, Akella SV, Wheaton AJ, et al. 3D-T1rho-relaxation mapping of articular cartilage: in vivo assessment of early degenerative changes in symptomatic osteoarthritic subjects. Acad Radiol. 2004;11:741–749. doi: 10.1016/j.acra.2004.03.051. [DOI] [PubMed] [Google Scholar]
- 19.Li X, Han E, Ma C, Link T, Newitt D, Majumdar S. In vivo 3T spiral imaging based multi-slice T(1rho) mapping of knee cartilage in osteoarthritis. Magn Reson Med. 2005;54:929–936. doi: 10.1002/mrm.20609. [DOI] [PubMed] [Google Scholar]
- 20.Schmid MR, Hodler J, Vienne P, Binkert CA, Zanetti M. Bone marrow abnormalities of foot and ankle: STIR versus T1-weighted contrast-enhanced fat-suppressed spin-echo MR imaging. Radiology. 2002;224:463–469. doi: 10.1148/radiol.2242011252. [DOI] [PubMed] [Google Scholar]
- 21.Mayerhoefer ME, Breitenseher M, Hofmann S, et al. Computer-assisted quantitative analysis of bone marrow edema of the knee: initial experience with a new method. AJR Am J Roentgenol. 2004;182:1399–1403. doi: 10.2214/ajr.182.6.1821399. [DOI] [PubMed] [Google Scholar]
- 22.Davies NH, Niall D, King LJ, Lavelle J, Healy JC. Magnetic resonance imaging of bone bruising in the acutely injured knee—short-term outcome. Clin Radiol. 2004;59:439–445. doi: 10.1016/j.crad.2003.11.012. [DOI] [PubMed] [Google Scholar]
- 23.Bao S, Guttmann CR, Mugler JP, 3rd, et al. Spin-echo planar spectroscopic imaging for fast lipid characterization in bone marrow. Magn Reson Imaging. 1999;17:1203–1210. doi: 10.1016/s0730-725x(99)00056-9. [DOI] [PubMed] [Google Scholar]
- 24.Jensen KE. Magnetic resonance imaging and spectroscopy of the bone marrow in vivo—with special attention to the possibilities for tissue characterization in patients with leukemia. Dan Med Bull. 1992;39:369–390. [PubMed] [Google Scholar]
- 25.Amano Y, Kumazaki T. Proton MR imaging and spectroscopy evaluation of aplastic anemia: three bone marrow patterns. J Comput Assist Tomogr. 1997;21:286–292. doi: 10.1097/00004728-199703000-00023. [DOI] [PubMed] [Google Scholar]
- 26.Griffith J, Yeung D, Antonio G, et al. Vertebral bone mineral density, marrow perfusion, and fat content in healthy men and men with osteoporosis: dynamic contrast-enhanced MR imaging and MR spectroscopy. Radiology. 2005;236:945–951. doi: 10.1148/radiol.2363041425. [DOI] [PubMed] [Google Scholar]
- 27.Mulkern R, Meng J, Bowers J, et al. In vivo bone marrow lipid characterization with line scan Carr-Purcell-Meiboom-Gill proton spectroscopic imaging. Magn Reson Imaging. 1997;15:823–837. doi: 10.1016/s0730-725x(97)00134-3. [DOI] [PubMed] [Google Scholar]
- 28.Yeung D, Griffith J, Antonio G, Lee F, Woo J, Leung P. Osteoporosis is associated with increased marrow fat content and decreased marrow fat unsaturation: a proton MR spectroscopy study. J Magn Reson Imaging. 2005;22:279–285. doi: 10.1002/jmri.20367. [DOI] [PubMed] [Google Scholar]
- 29.Mulkern R, Meng J, Oshio K, et al. Spectroscopic imaging of the knee with line scan CPMG sequences. J Comput Assist Tomogr. 1995;19:247–255. doi: 10.1097/00004728-199503000-00016. [DOI] [PubMed] [Google Scholar]
- 30.Tran TK, Vigneron DB, Sailasuta N, et al. Very selective suppression pulses for clinical MRSI studies of brain and prostate cancer. Magn Reson Imaging. 2000;43:23–33. doi: 10.1002/(sici)1522-2594(200001)43:1<23::aid-mrm4>3.0.co;2-e. [DOI] [PubMed] [Google Scholar]
- 31.Rueckert D, Sonoda LI, Hayes C, Hill DL, Leach MO, Hawkes DJ. Nonrigid registration using free-form deformations: application to breast MR images. IEEE Trans Med Imaging. 1999;18:712–721. doi: 10.1109/42.796284. [DOI] [PubMed] [Google Scholar]
- 32.Carballido-Gamio J, Bauer JS, Lee KY, Krause S, Majumdar S. Combined image processing techniques for characterization of MRI cartilage of the knee. Conf Proc IEEE Eng Med Biol Soc. 2005;3:3043–3046. doi: 10.1109/IEMBS.2005.1617116. [DOI] [PubMed] [Google Scholar]
- 33.Nelson SJ. Analysis of volume MRI and MR spectroscopic imaging data for the evaluation of patients with brain tumors. Magn Reson Med. 2001;46:228–239. doi: 10.1002/mrm.1183. [DOI] [PubMed] [Google Scholar]
- 34.Li X, Nelson SJ. Reliable in vivo lactate and lipid estimation in glioma patients. Proc Ann Int Conf IEEE Eng Med Biol Soc (EMBS) 2003;25:482–485. [Google Scholar]
- 35.Fithian DC, Paxton EW, Stone ML, et al. Prospective trial of a treatment algorithm for the management of the anterior cruciate ligament-injured knee. Am J Sports Med. 2005;33:335–346. doi: 10.1177/0363546504269590. [DOI] [PubMed] [Google Scholar]
- 36.Lohmander LS, Ostenberg A, Englund M, Roos H. High prevalence of knee osteoarthritis, pain, and functional limitations in female soccer players twelve years after anterior cruciate ligament injury. Arthritis Rheum. 2004;50:3145–3152. doi: 10.1002/art.20589. [DOI] [PubMed] [Google Scholar]
- 37.von Porat A, Roos E, Roos H. High prevalence of osteoarthritis 14 years after an anterior cruciate ligament tear in male soccer players: a study of radiographic and patient relevant outcomes. Ann Rheum Dis. 2004;63:269–273. doi: 10.1136/ard.2003.008136. [DOI] [PMC free article] [PubMed] [Google Scholar]
- 38.Roos H, Adalberth T, Dahlberg L, Lohmander LS. Osteoarthritis of the knee after injury to the anterior cruciate ligament or meniscus: the influence of time and age. Osteoarthritis Cartilage. 1995;3:261–267. doi: 10.1016/s1063-4584(05)80017-2. [DOI] [PubMed] [Google Scholar]
- 39.Fang C, Johnson D, Leslie MP, Carlson CS, Robbins M, Di Cesare PE. Tissue distribution and measurement of cartilage oligomeric matrix protein in patients with magnetic resonance imaging-detected bone bruises after acute anterior cruciate ligament tears. J Orthop Res. 2001;19:634–641. doi: 10.1016/S0736-0266(00)00039-5. [DOI] [PubMed] [Google Scholar]
- 40.Lozano J, Li X, Link T, Safran M, Majumdar S, CB Ma. Detection of posttraumatic cartilage injury using quantitative T1rho magnetic resonance imaging. A report of two cases with arthroscopic findings. J Bone Joint Surg Am. 2006;88:1349–1352. doi: 10.2106/JBJS.E.01051. [DOI] [PubMed] [Google Scholar]