

Abstract
Background
In this work we explored the association of height and overweight with change in socioeconomic position between birth and 19 years of age.
Methods
A birth cohort has been followed-up in Pelotas, Brazil, since 1982. All 5914 hospital births were enrolled in the study just after delivery. In 2001, 27% of the cohort subjects were sought, and 1031 (69% of the survivors) were interviewed. Weight and height were obtained for women; men had been examined 6 months earlier. Information on family income in 1982 and 2001 was used to classify the sample into tertiles, the lowest classified as ‘poor’ and the other two as ‘non-poor’. Four trajectories resulted: always poor, never poor, poor at birth/non-poor at 19, and non-poor at birth/poor at 19—which were compared in terms of mean height and prevalence of overweight.
Results
Height showed a similar behaviour for men and women, with the never poor presenting the highest mean, followed by those who were non-poor at birth and later became poor. Those who were poor at birth, regardless of later status, were shortest. Overweight was approximately twice as common among men who were never poor in relation to the others. Among women, those who were always poor presented the highest prevalence of overweight. In this case, social determination seems to be complex and may involve aspects of lifestyle and behaviour acting differently for each gender.
Conclusion
Socioeconomic trajectories affected both height and overweight, the effect on the latter being different for each gender.
Keywords: body height, overweight, socioeconomic status, life course epidemiology, social determinant of health
The social determination of health outcomes is well established in literature. These studies usually show how health outcomes vary on the basis of current socioeconomic position (SEP) However, recent evidence suggests that current health out-comes depend on SEP in different periods in the life course.1 Also, past SEP may modify the effect of the individual’s current socioeconomic situation on health.
Several studies have shown that adverse socioeconomic conditions in childhood determine adult mortality rates, even when present socioeconomic situation is controlled for. Mortality rates from stroke and stomach cancer were 1.87 and 2.03 times higher in men whose fathers were manual workers compared with those whose fathers were not manual workers, while the all-cause mortality rate ratio was 1.22, in a Scottish cohort study of working men.2 In a census-based Finnish study, manual social class in childhood increased all-cause mortality by 20% among non-manual workers in adulthood, while having no effect among manual workers, whose mortality rate was three times higher than for subjects who always belonged to non-manual class. For cardiovascular mortality, childhood manual class was associated with increased rates for both manual and non-manual adult workers.3
Height has been shown to be related to childhood social class and financial hardship in infancy,4 and despite the increase in mean population height, differences between the richest and the poorest have not changed significantly.5 Nutrition and diseases in childhood are believed to be the main environmental factors determining height, and, thus, the effect of childhood social class is probably more important then adulthood social class. However, a study from the UK showed that upward social class mobility (from the age of 7–33 years) was associated with increased height for children originally from lower classes. On the other hand, children from the upper classes who moved down the social ladder were not different from those who remained wealthy.6 This study did not try to establish the causal direction—it could be either the improvement of social position leading to taller young adults or selective social mobility of taller individuals.
Obesity and overweight are increasing in most parts of the world,7 and their relation with SEP has been the focus of many studies. In Brazil, overweight and obesity have shown, overall, a steep increase. From 1975–97, obesity increased from 2.4 to 6.9% among men and from 7 to 12.5% among women.8 This change, however, was not consistent for all socioeconomic groups. Among men, all groups showed an increase in obesity over time, but poorer men present less obesity than the richer. Among women, the poorer show an increase of obesity more than 2-fold. The richer, on the other hand, peak in 1989 (12.8%) and then show a decrease to 9.2%. A similar trend was found, analysing the same surveys, comparing the trends in the poorer North-east of the country with the richer South-east.9 A recent review showed that in developing countries obesity tends to either increase or not to vary with wealth in men, while among women the association tends to be inverse.10
In the present study we explore how past and current SEP affects the height and weight of 19-year-old adults in a Brazilian birth cohort. This analysis may bring new light to the understanding of how these characteristics depend on SEP, not only at one point in time, as most studies have approached, but in terms of SEP change over time.
Methods
In 1982 a birth cohort study was started in Pelotas, Southern Brazil. At that time Pelotas had ~214 000 inhabitants. All 5914 hospital births (over 99% of all deliveries) that happened in 1982 were studied prospectively. The first interview with the mothers took place at the hospital, shortly after the birth. The next main stages of the study took place in 1983, 1984, 1986, 1995, 1997, 2000, and 2001. More than 2000 variables are available for each subject who participated in all stages of the study. In 2000, 2250 male participants were interviewed when presenting for the compulsory army recruitment exam. In 2001 a sample of 27% of men and women was sought at home, through systematic sampling of 70 of the 265 census tracts of the town. Follow-up rates in these recent stages of the cohort were 78.9% for the army examination and 69.0% for the household visits. Further information on the cohort is available elsewhere.11 In this analysis, the 27% subsample sought in 2001 was studied, including 558 men and 473 women.
Family income was collected at birth in the perinatal interview and categorized according to ‘minimum wage’ units in five categories: ≤1, 1.1–3, 3.1–6, 6.1–10, and >10, with respective frequencies of 21.9, 47.4, 18.5, 6.5, and 5.7% (for the whole cohort). Unfortunately, information on income as a continuous variable was not collected. Because of the unequal numbers of subjects in each category, it was desirable to classify individuals into tertiles to allow the study of change in income levels since childhood. A principal components analysis was carried out using four variables—delivery payment mode (out-of-pocket, public free, or private health insurance) and mother’s schooling, height, and skin colour. The first component was used to derive a score that was then used to rank individuals within family income groups. Cut-off points were then found within each category so that three nearly equal sized groups were formed. To build the tertile-equivalent groups, the 1288 individuals in the lowest family income category were added to the 675 poorest individuals in the second category. The next 1979 subjects in this second category formed the second tertile, while all the remaining individuals formed the last tertile. The three groups did not have exactly the same number of individuals owing to ties in the derived score.
Family income was collected in the 2001 home visit for both men and women, when they were 19 years old. The income of each family member was recorded. Tertiles were then generated from the sum of the reported values.
Nine groups were then created, representing all possible combinations of the tertiles at birth and at 19 years of age. Because this led to reduced statistical power for some of the analysis, with small numbers of subjects in some groups, the middle and higher tertiles of family income were merged in a group referred to as ‘non-poor’, whereas lowest tertile is referred to as ‘poor’. This classification resulted in four possible trajectories: those who were always poor, those who were never poor, and those who were poor at birth and non-poor later on, and those who were non-poor and then became poor.
Height and weight measurements were made by trained interviewers who passed a standardization procedure as proposed by Habicht et al.12 Women were measured at home in the 2001 visit. Men’s height and weight were assessed on average 6 months earlier, in the 2000 army’s follow-up. These measures were not repeated in 2001 given the short time interval. Body mass index (BMI) was calculated as weight in kilograms divided by height in metres squared. Individuals with BMI ≥ 25 kg/m2 were classified as overweight, according to WHO recommendations.7
Mean height and overweight prevalence for each group was calculated by standard methods. Linear regression was used for testing differences of mean height between SEP groups. Similarly, logistic regression was used for comparing groups in relation to overweight prevalence. Linear trends were tested by including the variable indicating change of SEP as a numeric variable, instead of as dummy variables, in either model. The specific groups compared differed in each situation, but they were defined before any test results was available and limited to three comparisons, the number of degrees of freedom available.
Results
Table 1 shows selected characteristics of the cohort sample included in the analyses: birth weight, weight, BMI, education attainment, skin colour, and prevalence of overweight and obesity, all by sex. Education attainment was significantly lower in men (P < 0.001). Approximately 3/4 of the population was white, the remaining quarter including equal proportions of blacks and mixed. At 19 years of age, 16.4% were overweight and 4.5% obese, with no difference by sex.
Table 1.
Selected characteristics of the cohort sample included in the analyses, by sex
| Variable | Male N = 558 | Female N = 473 |
|---|---|---|
| Mean (SD) | Mean (SD) | |
| Birth weight (g) | 3294 (532) | 3166 (525) |
| Current weight (kg) | 67.0 (12.1) | 59.1 (13.8) |
| Current height (cm) | 173.6 (6.8) | 161.2 (6.2) |
| Body mass index (kg/m2) | 22.2 (3.6) | 22.5 (4.9) |
| Education attainment (years) | 8.5 (2.6) | 9.3 (2.7) |
| % | % | |
| Skin colour | ||
| White | 76.7 | 77.9 |
| Black | 11.8 | 11.6 |
| Mixed and other | 11.5 | 10.5 |
| Overweight (BMI > 25) | 15.9 | 17.0 |
| Obesity (BMI > 30) | 3.4 | 5.8 |
Low birth weight was strongly associated with SEP at birth (P < 0.001): children in the highest tertile weighed, on average, 172 g more than those in the lowest tertile (data not shown). Gestational age was not associated with SEP at birth.
Table 2 shows that in 1982, 17.8% of the cohort sample had a total family income equal to or less than one minimum wage, while most of the sample fell in the next category of 1.1–3 minimum wages (47.1%). During the next 19 years Brazil went through a period of hyperinflation, with five different currencies, until inflation was finally controlled in 1994. In 2001, an important shift to the right in the family income distribution in minimum wages was observed. However, according to the Brazilian Central Bank, the minimum wage in 2000 had lost 24% of its real value compared with that in 1982.13 We thus corrected the 2001 values in order to improve comparability, which resulted in a less dramatic, but still important, increase in family income, shown in Table 2 (P < 0.001).
Table 2.
Family income distribution in minimum wages at birth and in 2001 (nominal value and de-inflated value)
| Family income in minimum wagesa |
1982 | 2001 | 2001 deinflatedb |
|||
|---|---|---|---|---|---|---|
|
| ||||||
| N | % | N | % | N | % | |
| Up to 1 | 183 | 17.8 | 87 | 8.4 | 116 | 11.3 |
| 1.1 to 3 | 485 | 47.1 | 280 | 27.2 | 365 | 35.4 |
| 3.1 to 6 | 222 | 21.6 | 310 | 30.1 | 284 | 27.6 |
| 6.1 to 10 | 68 | 6.6 | 165 | 16.0 | 117 | 11.4 |
| more than 10 | 72 | 7.0 | 189 | 18.3 | 149 | 14.5 |
The mid-year value of the minimum wage in 1982 was 16 608 cruzeiros, and in 2001 it was 18 000 reais.
The 2001 minimum wage was de-inflated by 24%, according to the Brazilian Central Bank estimate of the loss or the real value of the 2000 minimum wage compared with that of 1982. P-value < 0.001 compared with the 1982 distribution.
Our analyses of socioeconomic change were based on relative position, according to tertiles of family income at birth (1982) and at 19 years of age (2001). Figure 1 shows the distribution of family income at 19, by tertiles of family income at birth. The middle-income group at birth experienced the highest degree of mobility, with only 40% remaining in the same group at 19 years of age. A quarter moved to the highest tertile, while just over one-third moved down. The richest group at birth, on the other hand, had the lowest mobility, with 60% of them remaining in the highest tertile. In between, the poorest group at birth had 55% remaining in the same tertile. From the richest group at birth, 13% fell to the lowest tertile at present, while 10% from the poorest at birth managed to move to the richest group.
Figure 1.
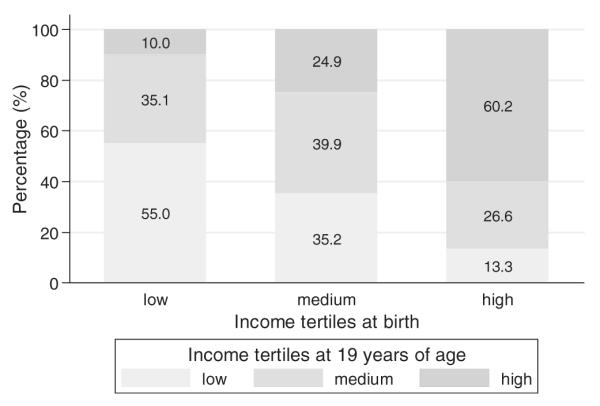
Distribution of tertiles of family income at 19 years of age (2001), by groups of family income at birth (1982)
Using the four-trajectory classification described in the Methods section, 55.0% of the sample was never poor, 15.5% were always poor, 16.8% were not poor at birth and poor at 19 (hence described as non-poor/poor), and 12.7% were poor at birth and non-poor at 19 (poor/non-poor).
Mean current height and prevalence of overweight are presented by sex and by tertiles of family income at birth and at 19 years in Table 3. Height was strongly associated, for both sexes, with income at the two time points. Men from the highest tertile of income at birth were, on average, 4.0 cm taller than those who were in the lowest tertile. For women, this difference was 3.6 cm. The effects of current income on height were slightly lower than that of past income (differences of 2.7 and 3.5 cm for men and women, respectively). On the other hand, overweight was associated with income only among men and only with current income. Men from the highest income tertile at 19 were 2.7 times more likely to be overweight than those from the lowest tertile.
Table 3.
Mean current height, and prevalence of overweight (BMI > 25), by sex and family income (at birth and at 19 years of age)
| Family income tertiles | N |
Mean height (cm) |
Overweight (%) |
|||
|---|---|---|---|---|---|---|
| Male | Female | Male | Female | Male | Female | |
| 1982 | P < 0.001 | P < 0.001 | P = 0.073 | P = 0.783 | ||
| Low | 149 | 142 | 171.2 | 159.4 | 10.8 | 16.4 |
| Middle | 201 | 140 | 173.6 | 160.6 | 17.0 | 16.7 |
| High | 208 | 191 | 175.2 | 163.0 | 18.3 | 17.6 |
| 2001 | P < 0.001 | P < 0.001 | P < 0.001 | P = 0.231 | ||
| Low | 184 | 149 | 172.3 | 159.4 | 9.1 | 19.3 |
| Middle | 203 | 141 | 173.6 | 160.9 | 14.9 | 17.9 |
| High | 171 | 183 | 175.0 | 162.9 | 24.4 | 14.4 |
| All | 558 | 473 | 173.6 | 161.2 | 15.9 | 17.0 |
All P-values for linear trend tests.
Figure 2 shows the mean current height for the four groups of socioeconomic change, by sex. Men who were never poor were 1.8 cm taller than the non-poor/poor (P = 0.028), who were in turn 2.1 cm taller than the poor/non-poor (P = 0.052). There was no difference between this last group and those who were always poor (P = 0.799). Among women, those who were never poor were 2.5 cm taller than the non-poor/poor (P = 0.002). This group was not different from the poor/non-poor (P = 0.932). As with men, no difference was found between the latter group and those who were always poor (P = 0.182).
Figure 2.

Mean current height according to socioeconomic trajectory* from birth (1982) to 19 years of age (2001), by sex.
The effects of socioeconomic trajectory on overweight differed by sex. Men who were never poor presented significantly higher prevalence of overweight compared with all the other groups (P = 0.003, Figure 3). The poor/non-poor had a similar prevalence to all those who were poor at 19, regardless of previous SEP (P = 0.557). Among women, those who were always poor presented the highest overweight prevalence (24.6%). Those who had never been poor had an overweight prevalence of 18.0% but were not significantly different from the former group (P = 0.219). Non-poor/poor women came next, followed by the poor/non-poor birth (P-values 0.125 and 0.013 compared with the always poor group).
Figure 3.

Prevalence of overweight (BMI > 25) according to socioeconomic trajectory* from birth (1982) to 19 years of age (2001), by sex.
Discussion
Our study has the advantage of a prospective follow-up of a population-based birth cohort with measures of SEP in infancy and early adulthood. Approximately 30% of the cohort could not be located in the 2001 follow-up; the lowest follow-up rate (61%) was observed for the group with a monthly income below one minimum wage in 1982.11 The profound economic changes experienced during the follow-up in the country, allied with the problems related to collecting income data, make absolute changes in income very difficult to study. Using relative position is a way of minimizing these difficulties. Also, sample size was limited for analyses involving more than the four subgroups used here (e.g. the nine original groups formed by cross-tabulating the tertiles at birth and at 19 years).
So far, studies of the role of changes in family SEP on adult health outcomes have been limited to developed countries.1-6 Social stratification in Brazil is much more marked than that in high-income countries,14 so that the change in SEP can potentially have a much greater impact than in more equitable countries.
Height has been long known to be associated with SEP. A 10-country European study found differences of up to 3.0 and 2.2 cm for men and women, respectively, between extremes of education level.15 In Norway, larger differences were found: 3.5 cm for men and 4.2 cm for women between the highest and lowest income groups. Differences between extreme educational levels were smaller (3.3 and 3.2 cm).16 In Australia, differences of up to 2.5 cm were described between the extremes of the wealth distribution.17 In most cases, the differences were substantially smaller than those reported here, 4.0 cm for men and 3.6 cm for women. Had we classified the population into more subgroups, such as quintiles, the difference could be even greater, due to the sharper social stratification and stage of economic development of Brazil compared with that of high-income countries mentioned above.18
Our results also confirm that SEP at birth is a more important determinant of height than SEP at age 19. But a worsening in SEP between birth and adolescence seems to also limit height, as individuals who were not poor at birth, but became poor, presented a mean height that was intermediate between those who were never poor and those who were poor at birth. This may be related to slower growth during the adolescent spurt.19 Differences in birth weight by SEP indicate that poorer children are born at a disadvantage (birth length is not available in this cohort). It seems that this disadvantage, measured in terms of height, is maintained until adulthood. Impoverishment during childhood or adolescence also seems to contribute to this disadvantage.
Power et al.6 interpreted a similar finding as the result of men moving into the upper classes being taller than those remaining in lower classes, as adult SEP was measured at 33 years and there was time for social change after full height was attained. Unlike the Power et al. 6 study, in our cohort current SEP reflects family conditions because virtually all subjects were still living with their parents. Thus, upward social mobility of tall subjects cannot explain this association.
The pattern observed for overweight was more complex than that for height. In a recent review of obesity in developing countries, Monteiro et al.20 described a general trend towards positive association between SEP and obesity for men. In our study, SEP at 19 years was more strongly related to overweight than SEP at birth, contrary to our findings for height. But the study of the trajectories showed that men who were never poor presented a prevalence of overweight that was roughly twice the prevalence of the other groups. That is, those men who moved up in the social scale had less overweight than those who were always at the top. Further research is needed to clarify the mechanisms behind this association.
Most countries studied by Monteiro et al.20 showed an inverse association between socioeconomic status and obesity among women. In our study, women who were always poor presented the highest prevalence of overweight. However, the second highest prevalence was found among those who were never poor, followed by those who moved between levels. Again, change in SEP played an important role, albeit in a different direction compared with men. It is difficult to explain this result without information on gendered habits relating to diet and physical activity. Further investigation would be necessary to understand the underlying factors for the association observed.
A potential explanation for the higher levels of BMI among always poor women is the greater frequency of adolescent pregnancies in this group,21 leading to higher parity, in turn potentially associated with higher BMI. Our findings, however, did not change when parity was adjusted for (results not shown).
In summary, we observed an important effect of SEP trajectories for height and overweight. There were no gender differences in the effects on height but for overweight gender played an important role. Studies of the role of change in SEP on adult health and nutrition outcomes should be promoted. They may contribute to assessing how much of the damage caused by a poor childhood can be reverted in later life, and make important contributions to preventive policies and programmes. It is also important to understand these socioeconomic effects in terms of the economic development and culture of the particular environment.
KEY MESSAGES
• Men and women who had a high SEP at birth presented the highest average heights, but those who experienced a worsening situation until adulthood had their growth impaired, probably due to slower growth during the adolescent spurt. On the other hand, overweight showed different patterns between genders. Men who were never poor had the highest prevalence of overweight. For women, it peaked among those always poor and those never poor, suggesting a complex role of economic and lifestyle variables.
Acknowledgements
This analysis was supported by the Wellcome Trusts initiative entitled Major Awards for Latin America on Health Consequences of Population Change. Earlier phases of the 1982 cohort study were funded by the International Development Research Center (IDRC, Canada), the World Health Organization (Department of Child and Adolescent Health and Development, and Human Reproduction Programme, CAH), the Overseas Development Administration (ODA, United Kingdom), the United Nations Development Fund for Women, the National Program for Centers of Excellence (Pronex/CNPq, Brazil), the National Council for Scientific and Technologic Development (CNPq, Brazil) and the Ministry of Health (Brazil). A.J.D.B., C.G.V. and B.L.H. were partially supported by research productivity grants from the National Council for Scientific and Technologic Development (CNPq, Brazil).
References
- 1.Galobardes B, Lynch JW, Smith G Davey. Childhood socioeconomic circumstances and cause-specific mortality in adulthood: systematic review and interpretation. Epidemiol Rev. 2004;26:7–21. doi: 10.1093/epirev/mxh008. [DOI] [PubMed] [Google Scholar]
- 2.Smith GD, Hart C, Blane D, Hole D. Adverse socioeconomic conditions in childhood and cause specific adult mortality: prospective observational study. BMJ. 1998;316:1631–35. doi: 10.1136/bmj.316.7145.1631. [DOI] [PMC free article] [PubMed] [Google Scholar]
- 3.Pensola TH, Martikainen P. Cumulative social class and mortality from various causes of adult men. J Epidemiol Community Health. 2003;57:745–51. doi: 10.1136/jech.57.9.745. [DOI] [PMC free article] [PubMed] [Google Scholar]
- 4.Peck MN, Lundberg O. Short stature as an effect of economic and social conditions in childhood. Soc Sci Med. 1995;41:733–38. doi: 10.1016/0277-9536(94)00379-8. [DOI] [PubMed] [Google Scholar]
- 5.Wright CM, Parker L. Forty years on: the effect of deprivation on growth in two Newcastle birth cohorts. Int J Epidemiol. 2004;33:147–52. doi: 10.1093/ije/dyg187. [DOI] [PubMed] [Google Scholar]
- 6.Power C, Manor O, Li L. Are inequalities in height underestimated by adult social position? Effects of changing social structure and height selection in a cohort study. BMJ. 2002;325:131–34. doi: 10.1136/bmj.325.7356.131. [DOI] [PMC free article] [PubMed] [Google Scholar]
- 7.WHO . Obesity: Preventing and Managing the Global Epidemic. Geneva: World Health Organization; 2000. Report No.: WHO Technical Report Series no. 894. [PubMed] [Google Scholar]
- 8.Monteiro C, Benicio MH, Conde WL, Popkin BM. Shifting obesity trends in Brazil. Eur J Clin Nutr. 2000;54:342–46. doi: 10.1038/sj.ejcn.1600960. [DOI] [PubMed] [Google Scholar]
- 9.Filho M Batista, Rissin A. A transição nutricional no Brasil: tendências regionais e temporais. Cad Saúde Pública. 2003;19(Suppl 1):S181–91. doi: 10.1590/s0102-311x2003000700019. [DOI] [PubMed] [Google Scholar]
- 10.Monteiro CA, Moura EC, Conde WL, Popkin BM. Socioeconomic status and obesity in adult populations of developing countries: a review. Bull World Health Organ. 2004;82:940–46. [PMC free article] [PubMed] [Google Scholar]
- 11.Victora CG, Barros FC, Lima RC, et al. The Pelotas birth cohort study, Rio Grande do Sul, Brazil, 1982–2001. Cad Saúde Pública. 2003;19:1241–56. doi: 10.1590/s0102-311x2003000500003. [DOI] [PMC free article] [PubMed] [Google Scholar]
- 12.Habicht JP. Estandarización de métodos epidemiológicos cuantitativos sobre el terreno. Bol Oficina Sanit Panam. 1974;76:375–84. [PubMed] [Google Scholar]
- 13. Brazilian Central Bank Informações econômico-financeiras—salário mínimo 2002. [Internet] Available at: http://www4.bcb.gov.br/pec/series/port/metadados/mg659Ap.htm ( accessed May 2, 2005)
- 14.UNDP . Human Development Report 2004. Cultural Liberty in Today’s Diverse World. United Nations Development Programme (UNDP); 2004. [Google Scholar]
- 15.Cavelaars AE, Kunst AE, Geurts JJ, et al. Persistent variations in average height between countries and between socio-economic groups: an overview of 10 European countries. Ann Hum Biol. 2000;27:407–21. doi: 10.1080/03014460050044883. [DOI] [PubMed] [Google Scholar]
- 16.Meyer HE, Selmer R. Income, educational level and body height. Ann Hum Biol. 1999;26:219–27. doi: 10.1080/030144699282723. [DOI] [PubMed] [Google Scholar]
- 17.Turrell G. Socio-economic position and height in early adulthood. Aust N Z J Public Health. 2002;26:468–72. doi: 10.1111/j.1467-842x.2002.tb00349.x. [DOI] [PubMed] [Google Scholar]
- 18.de Ferranti D, Perry GE, Ferreira FHG, et al. Inequality in Latin America and the Caribbean: Breaking with History? Washington, DC: The International Bank for Reconstruction and Development/The World Bank; 2003. [Google Scholar]
- 19.Sinclair D. Human Growth After Birth. 3rd edn London: Oxford University Press; 1978. [Google Scholar]
- 20.Monteiro CA, Conde WL, Lu B, Popkin BM. Obesity and inequities in health in the developing world. Int J Obes Relat Metab Disord. 2004;28:1181–86. doi: 10.1038/sj.ijo.0802716. [DOI] [PubMed] [Google Scholar]
- 21.Gigante DP, Rasmussen KM, Victora CG. Pregnancy increases BMI in adolescents of a population-based birth cohort. J Nutr. 2005;135:74–80. doi: 10.1093/jn/135.1.74. [DOI] [PubMed] [Google Scholar]