

Abstract
The objective of this study was to examine the neural correlates of phonological inconsistency (relationship of spelling to sound) and orthographic inconsistency (relationship of sound to spelling) in visual word processing using functional magnetic resonance imaging (fMRI). Children (9‐ to 15‐year‐old) performed a rhyming and spelling task in which two words were presented sequentially in the visual modality. Consistent with previous studies in adults, higher phonological inconsistency was associated with greater activation in several regions including left inferior frontal gyrus and medial frontal gyrus/anterior cingulate cortex. We additionally demonstrated an effect of orthographic inconsistency in these same areas, suggesting that these regions are involved in the integration of orthographic and phonological information and, with respect to the medial frontal/anterior cingulate, greater demands on executive function. Higher phonological and orthographic consistency was associated with greater activation in precuneus/posterior cingulate cortex, the putative steady state system active during resting, suggesting lower demands on cognitive resources for consistent items. Both consistency effects were larger for the rhyming compared with the spelling task suggesting greater demands of integrating spelling and sound in the former task. Finally, accuracy on the rhyming task was negatively correlated with the consistency effect in left fusiform gyrus. In particular, this region showed insensitivity to consistency in low performers, sensitivity to inconsistency (higher activity) in moderate performers, and sensitivity to inconsistency (high activation) and to consistency (deactivation). In general, these results show that the influence of spelling–sound (and sound–spelling) correspondences on processing in fusiform gyrus develops as a function of skill. Hum Brain Mapp, 2008. © 2007 Wiley‐Liss, Inc.
Keywords: reading, fMRI, children, development, word form, fusiform
INTRODUCTION
When learning to read, children must be able to map letters onto their corresponding speech sounds, converting orthographic representations to phonological representations. Some languages, such as English, have an irregular mapping between orthography and phonology, which can be described as inconsistency. Numerous studies have shown that phonological inconsistency, which occurs when the same spelling has different pronunciations (e.g. seat vs. sweat), slows reaction time of adults during lexical decision, naming, and reading tasks in the visual modality [Fiez et al., 1999; Jared et al., 1990; Lacruz and Folk, 2004; Stone et al., 1997; Ziegler et al., 1997]. Recent work has also focused on the effects of orthographic inconsistency, which occurs when a sound can be spelled in multiple ways (e.g. grade and laid). Orthographically, inconsistent words also slows reaction time in adults during lexical decision and naming tasks in the visual modality [Kessler et al., 2007; Lacruz and Folk, 2004; Massaro and Jesse, 2005; Stone et al., 1997; Ziegler et al., 1997]. However, others have argued against the existence of an orthographic consistency effect in reading [Peereman et al., 1998], but this has been subsequently challenged [Kessler et al., 2002; Massaro and Jesse, 2005]. The balance of studies suggests that both orthographic and phonological inconsistency influence multiple lexical processing tasks, especially word reading.
Although research on the development of phonological inconsistency is somewhat inconclusive, the general trends in the literature suggest that older children and children with higher phonological awareness show larger consistency effects [Laxon et al., 1991; Stuart and Masterson, 1992]. However, these developmental effects seem to be later modulated by word frequency as experience in word reading increases [Jared, 1997; Seidenberg et al., 1984; Waters et al., 1984]. Although, there is no research on the orthographic inconsistency effect in children, studies have suggested that the development of phonemic awareness (awareness of phonemes in the speech stream) is directly influenced by the development of orthographic knowledge [Byrne, 1992; Treiman et al., 2007]. In general, performance on phonemic awareness tasks is influenced by orthography in children of later elementary grades, but the influence of orthography on phonological tasks is weak and variable in children of early elementary grades [Ehri and Wilce, 1980; Perin, 1983; Tunmer and Nesdale, 1982; Zecker, 1991]. The influence of orthographic information on phonological processing consistent with theoretical frameworks of development suggest that the productive process of spelling and the receptive process of reading rely on the same general mechanisms [Ehri, 1991; Perfetti, 1992]. Although there are some contradictory findings, behavioral research suggests that phonological and orthographic inconsistency effects should generally increase as readers gain in age and ability.
Neuroimaging studies have shown that phonological inconsistency is associated with specific brain activity. Studies have found that adults show greater activation for phonologically inconsistent words in left inferior frontal gyrus [Binder et al., 2005; Fiez et al., 1999; Herbster et al., 1997; Katz et al., 2005; Peng et al., 2004; Tan et al., 2001], left superior temporal cortex [Peng et al., 2004; Tan et al., 2001], and left inferior parietal cortex [Binder et al., 2005; Peng et al., 2004]. Other studies not examining the phonological inconsistency effect have implicated posterior dorsal inferior frontal gyrus and superior temporal gyrus in phonological processing [Poldrack et al., 1999; Vigneau et al., 2006] and inferior parietal cortex in integrating orthographic and phonological representations [Booth et al., 2002, 2003]. Neuroimaging studies also show that phonologically inconsistent words produce greater activation in medial frontal gyrus/anterior cingulate cortex [Binder et al., 2005; Tan et al., 2001], although this effect is limited to low frequency words in some studies [Fiez et al., 1999]. Various studies have implicated the medial frontal gyrus/anterior cingulate cortex in conflict resolution [Barber and Carter, 2005; Kerns et al., 2004]. Finally, only one study has shown a phonological inconsistency effect in fusiform gyrus, but this was limited to low frequency words [Peng et al., 2004]. Fusiform gyrus has been implicated in orthographic processing [Cohen et al., 2004; Dehaene et al., 2004]. Although behavioral research shows that orthographic inconsistency has an effect on word processing, no imaging studies have examined the neural correlates of the orthographic inconsistency effect. A related study looking at orthographic neighborhood density in word and nonword processing revealed greater activation for items with atypical spellings (low neighborhood) compared with more typical spellings (high neighborhood) in bilateral middle frontal gyrus, anterior cingulate gyrus, left angular and middle temporal gyrus, and bilateral posterior cingulate gyrus [Binder et al., 2003]. While neighborhood density captures the prototypicality of spelling patterns, it is limited to the visual/orthographic form of words and bears no relationship with phonological form.
The goal of the current study was to examine the neural correlates of both the phonological and orthographic inconsistency effect in children (9‐ to 15‐year‐olds). We examined the hemodynamic response function (HRF) to the first word in two separate tasks in which an initial word is presented followed by a probe word both presented visually upon which a decision is made. In the spelling task, a subject must judge whether the two words are spelled the same from the first vowel onwards, and in the rhyming task, whether the two words rhyme. Although, the spelling task does not require access to phonological representations for correct performance, many studies suggest that there is automatic activation of phonological representations when reading words [Booth et al., 1999; Perfetti et al., 1988]. On the other hand, the rhyming task, by its nature, requires access to phonological representations for correct performance. Given the highly interactive nature of the language network as revealed by effective connectivity studies in spelling and rhyming tasks [Bitan et al., 2005, 2006], we expected both phonological and orthographic inconsistency to influence brain activation in left hemisphere regions implicated in prior research on the phonological consistency effect—inferior frontal gyrus, superior temporal gyrus, inferior parietal lobule, medial frontal gyrus/anterior cingulate cortex, and fusiform gyrus. However, these consistency effects may be larger for the rhyming task than for the spelling task, and this task difference may be especially pronounced for phonological inconsistency, because rhyming requires mapping from spelling to sound. Although previous behavioral research is contradictory, the balance of studies suggests that consistency effects should be larger for older and more skilled readers. No previous study has identified maturation or skill effects in cortex for consistency.
METHODS
Participants
Forty‐six healthy children (ages 9–15, mean = 11.3), 20 females, participated in the study. Children were recruited from the Chicago metropolitan area. Parents of children were given an interview to exclude participants having a previously reported history of intelligence, reading, attention, or oral‐language deficits. All children were also reported as being free of neurological diseases or psychiatric disorders and were not taking medication affecting the central nervous system. All children were also reported to be native English speakers, with normal hearing and normal or corrected‐to‐normal vision. Children were all right handed, (mean = 78, range 50–90) according to the 9‐item Likert scale questionnaire (−90 to 90, positive scores indicate right hand dominance). Children were given a standardized intelligence test [Wechsler, 1999] that showed an average full scale IQ = 112, (range = 85–141, SD = 14.8); verbal IQ = 114 (range = 79–142, SD = 14.7); and performance IQ = 107 (range = 78–135, SD = 14.0). Standardized measures of phonological awareness [Wagner et al., 1999] and word and nonword reading accuracy [Woodcock et al., 2001] were also administered. The average standard score on phonological awareness was 100 (range = 70–121, SD = 13.6); on nonword reading was 105 (range = 85–125; SD = 10.1), and on word reading was 109 (range = 91–130; SD = 10.3). The Institutional Review Board at Northwestern University and Evanston Northwestern Healthcare Research Institute approved the informed consent procedures.
Tasks
Rhyming and spelling tasks
In both the rhyming and the spelling tasks, words were presented visually in a sequential order. As shown in Figure 1A, each word was presented for 800 ms followed by a 200 ms blank interval. A red fixation‐cross appeared on the screen after the second word, indicating the need to make a response by pressing one of two buttons during the subsequent 2,600 ms interval. For the rhyming task, participants determined if two words had the same pronunciation from the first vowel onward. For the spelling task, participants determined if the rime (letter sequence from first vowel onward) was spelled the same in the two words. For a ‘yes’ response, participants used their right index finger to press a button and for a ‘no’ response participants used their right middle finger to press a second button. Twenty‐four word pairs were presented in each one of four lexical conditions that independently manipulated the orthographic and phonological similarity between words. In the two nonconflicting conditions, the two words were either similar in both orthography and phonology (O+P+, e.g. dime‐lime), or different in both orthography and phonology (O−P−, e.g. staff‐gain). In the two conflicting conditions, the two words had either similar orthography but different phonology (O+P−, e.g. pint‐mint), or different orthography but similar phonology (O−P+, e.g. jazz‐has). However, the current study did not examine this manipulation because we were interested in the effect of phonological and orthographic consistency on brain activation when processing the first word.
Figure 1.
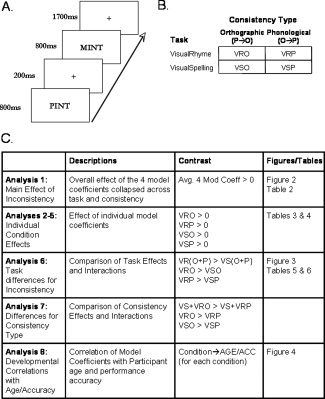
Top left (A) shows the trial specifications with the prime stimuli followed by target stimuli presented at a 1 s SOA. The HRF of primes and targets were modeled separately with the conditions of interest being applied to the modeled prime stimuli so as to minimize neural activity because of task specific processing. Top right (B) provides a diagram of the conditions of interest in our 2 (consistency type) by 2 (task) design. These conditions are measured as model coefficients from the item level performed in the single subject fixed‐effect analyses. Bottom (C) reveals the strategy for the analyses reported.
Control conditions
Two perceptual control conditions were used in which two symbol strings were presented visually in sequential order and the participant had to determine whether the strings matched. In the ‘Simple’ condition, the symbol string consisted of a single symbol, while in the ‘Complex’ condition the symbol string consisted of three different symbols. Timing and response parameters were the same as for the lexical conditions. Twenty‐four items were presented in each perceptual condition, with half of them matching. In addition to the perceptual control conditions, 72 fixation trials were included as a baseline. In the fixation condition, a black fixation‐cross was presented for the same duration as the stimuli in the lexical and perceptual conditions and participants were instructed to press a button when the black fixation‐cross turned red. However, the current study did not examine the control conditions because we were interested in the effect of phonological and orthographic consistency on lexical processing. The order of lexical, perceptual and fixation trials were optimized for event‐related design [Burock et al., 1998] and fixed for all subjects.
Stimulus characteristics
All words were monosyllabic and 4–7 letters long. Written word frequency in children did not differ across the spelling and rhyming tasks, t(188) = 0.60, P = 0.953 [1996]. Two measures of word consistency were calculated. Phonological enemies were defined as the number of words with similar spelling but different pronunciation of the rhyme and orthographic enemies were defined as the number of words with similar pronunciation but different spelling of the rime. Friends were defined as words with the same rime spelling and same rhyme pronunciation as the stimulus. Inconsistency was computed as the ratio of friends to the sum of friends and enemies (i.e. friends/(friends + enemies)) based on the 2,998 mono‐syllable words [Plaut et al., 1996]. Words that have a ratio approaching 1.0 have very few or no enemies (consistent), while words with a ratio approaching 0.0 have few or no friends (in consistent). Phonological and orthographic inconsistency did not differ across the spelling and rhyming tasks, t(188) = 0.21, P = 0.832 and t(188) = 0.37, P = 0.707, respectively. In addition, word frequency was not correlated with phonological or orthographic inconsistency for either the spelling task, r(95) = −0.02, P = 0.850 and r(95) = 0.04, P = 0.682, respectively, or the rhyming task, r(95) = −0.11, P = 0.270 and r(95) = −0.04, P = 0.618, respectively. Phonological inconsistency was not correlated with orthographic inconsistency for the spelling task, r(95) = 0.10, P = 0.334, or the rhyming task, r(95) = 0.11, P = 0.338. Mean values for each of the stimulus characteristics are presented in Table I.
Table I.
Mean, standard deviation and ranges for the stimulus characteristics for the spelling and rhyming tasks
| Spelling | Rhyming | |||||
|---|---|---|---|---|---|---|
| Mean | SD | Range | Mean | SD | Range | |
| Word frequency | 15.5 | 27.0 | 0–151 | 15.7 | 26.3 | 0–166 |
| Phonological inconsistency | 0.79 | 0.27 | 0.05–1 | 0.80 | 0.25 | 0.20–1 |
| Orthographic inconsistency | 0.59 | 0.31 | 0.02–1 | 0.61 | 0.29 | 0.06–1 |
We conducted a reading aloud pilot experiment on all of the words used in the rhyming and spelling tasks on 30 adults and Twelve 11‐year‐old children. The stimuli were presented visually for 800 ms (same as for the first word of the rhyming and spelling tasks) and the participant was asked to pronounce the words as accurately and as quickly as possible. Analysis of pilot data found moderate positive correlations between accuracy in word naming and inconsistency for children (r(11) = 0.36, 0.23, for phonological and orthographic, respectively; P < 0.05) and adults (r(29) = 0.30, 0.28, for phonological and orthographic, respectively; P < 0.05). Only adults showed a significant negative correlation between inconsistency and reaction time (r(29) = −0.21, −0.26, for phonological and orthographic, respectively; P < 0.05). Our findings are consistent with previous lexical decision and naming experiments in adults [Fiez et al., 1999; Jared et al., 1990; Lacruz and Folk, 2004; Stone et al., 1997; Ziegler et al., 1997]. There was no difference in accuracy (t(188) = 0.16, P = 0.868 for adults, t(188) = 0.38, P = 0.702 for children) or reaction time (t(188) = 0.68, P = 0.496 for adults, t(188) = 0.74, P = 0.458 for children) between the words in the spelling and rhyming tasks.
Experimental Procedures
After informed consent was obtained and the standardized intelligence test was administered, participants were invited for a practice session, in which they were trained to minimize head movement in front of a computer screen using an infrared tracking device. In addition, they performed one run of the experimental task in a simulator scanner, to make sure they understood the tasks and to acclimatize themselves to the scanner environment. Different stimuli were used in the practice and in the scanning sessions. Scanning took place within a week from the practice session. In the scanning session, two 8‐min runs of 108 trials each were performed for each task.
MRI Data Acquisition
Images were acquired using a 1.5 Tesla General Electric (GE) scanner, using a standard head coil. Head movement was minimized using vacuum pillow (Bionix, Toledo, OH). The stimuli were projected onto a screen, and viewed through a mirror attached to the inside of the head coil. Participants' responses were recorded using an optical response box (Current Designs, Philadelphia, PA). The blood‐oxygen level dependent functional images were acquired using the echo planar imaging (EPI) method. The following parameters were used for scanning: time of echo (TE) = 35 ms flip angle = 90°, matrix size = 64 × 64, field of view = 24 cm, slice thickness = 5 mm, number of slices = 24; time of repetition (TR) = 2000 ms. Four runs, with 240 repetitions each, were administered for the functional images. In addition, structural T1 weighted 3D image were acquired (TR = 21 ms, TE = 8 ms, flip angle = 20°, matrix size = 256 × 256, field of view = 22 cm, slice thickness = 1 mm, number of slices = 124), using an identical orientation as the functional images.
Image Analysis
Data analysis was performed using Statistical Parametric Mapping (SPM2, http://www.fil.ion.ucl.ac.uk/spm). The images were spatially realigned to the first volume to correct for head movements. No individual runs had more than 4 mm maximum displacement. Sinc interpolation was used to minimize timing‐errors between slices. The functional images were coregistered with the anatomical image, and normalized to the standard T1 Montreal Neurological Institute template volume. The data was then smoothed with a 10‐mm isotropic Gaussian kernel. Initial statistical analyses included ‘first words,’ ‘second words,’ ‘perceptual conditions,’ and null events as the four conditions of interest. A high pass filter with a cutoff period of 128 s was applied. First and second words of each pair were treated as individual events for analysis and modeled using a canonical HRF with intrinsic autocorrelations. The analysis of consistency effects was conducted only on the first words. Group results were obtained using random‐effects analyses by combining subject‐specific summary statistics across the group as implemented in SPM2.
In the individual analyses, we entered phonological and orthographic inconsistency as continuous variables to determine if brain activation systematically correlated with these variables. Because phonological consistency was skewed (many of the words had a consistency value at or near 1.0), we used a log 10 transformation to normalize the distribution. To examine activation associated with higher or lower inconsistency across task and type of inconsistency in the random effect analysis, we calculated a 2 task (spelling, rhyming) × 2 type of inconsistency (phonological, orthographic) analysis of variance (ANOVA). The diagram in Figure 1B reveals the study design. Model coefficients from the first‐order fixed effects ANOVA were used in subsequent comparisons. Figure 1C depicts the strategy for analyzing these coefficients in terms of main effects over tasks and consistency (Analysis 1), within each task and consistency (Analyses 2–5), between tasks within each consistency (Analysis 6), and correlations with accuracy partialed for age and age partialed for accuracy within each task and consistency (Analysis 7). We used an F‐test to examine the main effect over task and consistency (Analysis 1). We used one‐sample t‐tests to examine activation associated with higher or lower inconsistency, separately for phonological and orthographic inconsistency in the spelling task and separately for phonological and orthographic inconsistency in the rhyming task (Analysis 2–5). To examine differences between the spelling and rhyming tasks, we used paired‐sample t‐tests separately for phonological and orthographic inconsistency (Analysis 6). To examine differences between phonological and orthographic inconsistency, we used paired‐sample t‐tests separately for the spelling and rhyming tasks (Analysis 7). To determine whether accuracy on the task was associated with inconsistency/consistency, we used multiple regression to correlate accuracy with activation, partialed for age, separately for phonological and orthographic consistency in the spelling task and separately for phonological and orthographic consistency in the rhyming task (Analysis 8). All reported t‐tests are 2‐sided and are significant at least at the uncorrected level of P < 0.001. All reported effects were significant at P < 0.05 false discovery rate (FDR) corrected and contain 10 or greater voxels.
RESULTS
Behavioral Results
The analysis of accuracy on the two tasks showed that mean accuracy for spelling judgments (M = 92%, SD = 6.0.) was significantly greater than mean accuracy for rhyming judgments (M = 84%, SD = 10.0; t(45) = 6.67, P < 0.001).
fMRI Results
To examine the network generally involved in consistency, we calculated a one‐sample t‐test to examine the main effect of consistency collapsing across orthographic and phonological consistency for both the rhyming and spelling tasks. Several clusters were negatively correlated with consistency (greater activation for more inconsistent words) including anterior cingulate cortex/medial frontal gyrus, left inferior/middle frontal gyrus extending into left insula, left inferior/superior parietal lobules, left superior/middle temporal gyrus, and left fusiform gyrus (see Fig. 2 center images, and Table II). Several clusters were positively correlated with consistency (greater activation for more consistent words) including posterior cingulate cortex/precuneus and a posterior region of left superior/middle temporal gyrus (see Fig. 2 center images, and Table II).
Figure 2.
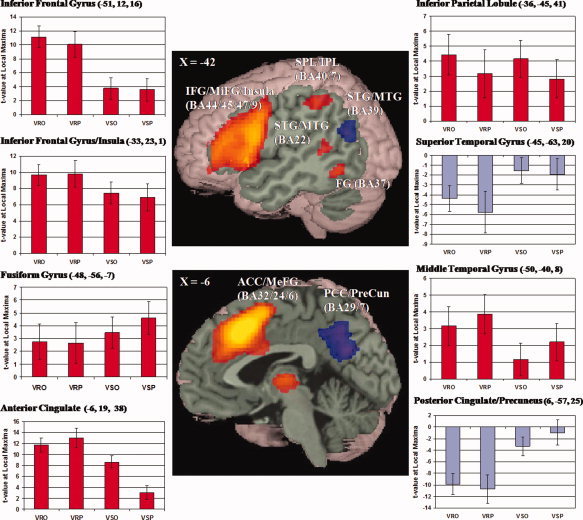
Center images show greater activation for more inconsistent words (hot scale) and greater activation for more consistent words (cold scale) collapsed across consistency type (orthographic and phonological) and task (rhyming and spelling). Regions in the top image include: inferior frontal gyrus (IFG), middle frontal gyrus (MiFG), insula, superior parietal lobule (SPL), inferior parietal lobule (IPL), superior temporal gyrus (STG), middle temporal gyrus (MTG), and fusiform gyrus (FG). Regions in the bottom image include: anterior cingulate cortex (ACC), medial frontal gyrus (MeFG), posterior cingulate cortex (PCC) and precuneus (PreCun). Surrounding graphs show the resulting t‐values of the correlations for each consistency type by each task for individual peaks within the resulting ROIs (threshold value of P < 0.001 uncorrected indicated in green). Conditions defined on the X‐axes for orthographic and phonological consistency for the visual rhyming task (VRO and VRP) and for the visual spelling task (VSO and VSP). Red bars correspond to stronger correlations with more inconsistent words and blue bars correspond to stronger correlations with more consistent words.
Table II.
Greater activation for more inconsistent words and greater activation for more consistent wordscollapsed across both orthographic and phonological consistency and both the spelling and rhyming tasks
| Region | Voxel | BA | x | y | z | Z |
|---|---|---|---|---|---|---|
| Greater for more inconsistent | ||||||
| L anterior cingulate | 4,680 | 32 | −6 | 19 | 38 | Infin |
| R anterior cingulate | a | 32 | 6 | 22 | 35 | Infin |
| L insula | 1,540 | 13 | −33 | 23 | −1 | Infin |
| L inf frontal G | a | 44 | −50 | 12 | 16 | 7.72 |
| R mid frontal G | 156 | 46 | 46 | 27 | 24 | 6.41 |
| R inf frontal G | a | 9 | 45 | 7 | 28 | 5.36 |
| L sup parietal lobule | 380 | 7 | −27 | −56 | 42 | 5.80 |
| L inf parietal lobule | a | 40 | −36 | −45 | 41 | 5.20 |
| L inf parietal lobule | a | 40 | −50 | −33 | 46 | 4.48 |
| L fusiform G | 56 | 19 | −48 | −56 | −7 | 4.76 |
| L cuneus | 156 | 23 | −9 | −75 | 12 | 4.29 |
| R posterior cingulate | a | 30 | 18 | −66 | 12 | 4.17 |
| R Lingual G | a | 19 | 18 | −55 | 0 | 3.92 |
| R sup parietal lobule | 123 | 7 | 30 | −56 | 44 | 4.26 |
| R precuneus | a | 7 | 27 | −65 | 36 | 4.19 |
| L mid temporal G | 86 | 22 | −50 | −40 | 8 | 4.18 |
| R parahippocampal G | 28 | 30 | 15 | −32 | −6 | 3.95 |
| R inf parietal lobule | 34 | 40 | 45 | −36 | 46 | 3.79 |
| L thalamus | 10 | n/a | −9 | −22 | 20 | 3.51 |
| Greater for more consistent | ||||||
| R posterior cingulate | 683 | 31 | 6 | −60 | 27 | 5.96 |
| R precuneus | a | 7 | 3 | −57 | 45 | 4.85 |
| L posterior cingulate | a | 31 | −15 | −57 | 27 | 4.46 |
| L mid temporal G | 85 | 39 | −48 | −63 | 21 | 4.54 |
| R postcentral G | 56 | 7 | 9 | −54 | 69 | 4.44 |
| R sup temporal G | 141 | 39 | 45 | −54 | 24 | 4.15 |
| R supramarginal G | a | 40 | 60 | −54 | 21 | 4.11 |
| R sup temporal G | a | 22 | 51 | −54 | 12 | 3.57 |
Clusters presented are more than 10 contiguous voxels surviving an α of 0.001 (uncorrected). All areas survive FDR corrected P < 0.05. Volume of clusters is indicated in voxels of 3 mm3 for the maximal peak. BA: Brodmann's Areas, x, y, z: Montreal Neurological Institute (MNI) Coordinates, Z: z‐core, Infin: Infinite, R: Right, L: Left, Inf: Inferior, Mid: Middle, Sup: Superior, Med: Medial.
Subpeaks of larger clusters immediately above.
To examine the contribution of each type of consistency and each task to the overall effect, we extracted the intensity of activation in the regions of interest described above. Figure 2 (surrounding graphs) shows that the effects of orthographic and phonological consistency were quite similar, with the only notable difference being a stronger correlation between greater activation and more orthographically inconsistent words as compared with the correlation between greater activation and more phonologically inconsistent words for the spelling task in anterior cingulate cortex. Tables III and IV present one‐sample t‐tests separately for each type of consistency and for each task for greater activation associated with more inconsistent words and greater activation associated with more consistent words. However, a paired‐sample t‐test revealed that there were no significant differences between orthographic and phonological consistency for either the spelling or rhyming task.
Table III.
Greater activation for more inconsistent words separately for the rhyming and spelling tasks and separatelyfor orthographic and phonological consistency
| Rhyming | Spelling | ||||||||||||||||||||
|---|---|---|---|---|---|---|---|---|---|---|---|---|---|---|---|---|---|---|---|---|---|
| Orthographic | Phonological | Orthographic | Phonological | ||||||||||||||||||
| Region | BA | x | y | z | Voxel | Z | x | y | z | Voxel | Z | x | y | z | Voxel | Z | x | y | z | Voxel | Z |
| Anterior medial | |||||||||||||||||||||
| L anterior cingulate | 32 | −6 | 19 | 38 | 1,684 | 6.83 | −6 | 20 | 43 | 1,044 | 6.30 | −3 | 22 | 38 | 815 | 6.42 | |||||
| a | 24 | −3 | 30 | 18 | 4.54 | ||||||||||||||||
| R med frontal G | 6 | 6 | 17 | 43 | a | 6.82 | 6 | 20 | 40 | a | 5.75 | ||||||||||
| a | 6 | 9 | 28 | 35 | a | 6.31 | |||||||||||||||
| L sup frontal G | 6 | −3 | 11 | 49 | a | 5.42 | |||||||||||||||
| Frontal/Insula | |||||||||||||||||||||
| L inf frontal G | 47 | −36 | 23 | −1 | 1,835 | 6.23 | −36 | 26 | 1 | 1,119 | 5.35 | −33 | 20 | −1 | 265 | 5.09 | −33 | 23 | −1 | 74 | 3.97 |
| a | 46 | −45 | 41 | 3 | a | 4.14 | |||||||||||||||
| L precentral G | 44 | −50 | 10 | 19 | a | 6.10 | −50 | 9 | 11 | a | 5.11 | ||||||||||
| a | 9 | −45 | 4 | 30 | a | 5.66 | |||||||||||||||
| L mid frontal G | 47 | −45 | 35 | −2 | a | 4.50 | |||||||||||||||
| a | 46 | −42 | 36 | 15 | 3.58 | ||||||||||||||||
| L insula | 13 | −27 | 23 | −11 | a | 3.95 | |||||||||||||||
| R inf frontal G | 47 | 33 | 26 | 1 | 303 | 5.09 | 39 | 20 | −1 | 222 | 4.30 | 36 | 20 | −1 | 258 | 5.26 | |||||
| R insula | 13 | 39 | 21 | 13 | a | 3.81 | |||||||||||||||
| R mid frontal G | 46 | 50 | 27 | 24 | 438 | 5.34 | 42 | 24 | 21 | a | 3.81 | ||||||||||
| a | 46 | 45 | 42 | 23 | 13 | 3.56 | 45 | 36 | 18 | 65 | 4.09 | ||||||||||
| a | 9 | 53 | 7 | 30 | 71 | 4.01 | |||||||||||||||
| a | 6 | 42 | 2 | 39 | a | 4.02 | 53 | 5 | 38 | a | 3.89 | 30 | 2 | 47 | 16 | 3.75 | |||||
| R precentral G | 4 | 53 | −7 | 42 | a | 3.76 | |||||||||||||||
| Temporal | |||||||||||||||||||||
| L para‐hippocampal G | 30 | −24 | −52 | 3 | 11 | 3.33 | −12 | −38 | −1 | 19 | 3.43 | ||||||||||
| R sup temporal G | 38 | 45 | 11 | −8 | 15 | 3.67 | |||||||||||||||
| L fusiform G | 37 | −48 | −53 | −5 | 13 | 3.84 | |||||||||||||||
| Parietal/posterior medial | |||||||||||||||||||||
| L postcentral G | 3 | −33 | −21 | 40 | 248 | 4.34 | |||||||||||||||
| L inf parietal lobule | 40 | −33 | −45 | 41 | a | 4.14 | |||||||||||||||
| a | 40 | −39 | −36 | 38 | a | 3.84 | |||||||||||||||
| L sup parietal lobule | 7 | −27 | −59 | 44 | 48 | 3.47 | |||||||||||||||
| L angular G | 39 | −30 | −60 | 33 | a | 3.61 | |||||||||||||||
| L precuneus | 7 | −21 | −56 | 44 | 128 | 4.44 | −27 | −65 | 39 | a | 3.7 | ||||||||||
| R precuneus | 7 | 24 | −59 | 39 | 136 | 4.54 | |||||||||||||||
| R inf parietal lobule | 40 | 42 | −53 | 44 | 10 | 3.48 | 33 | −44 | 44 | a | 3.21 | ||||||||||
| a | 40 | 50 | −38 | 49 | 31 | 3.9 | |||||||||||||||
| R posterior cingulate | 31 | 21 | −66 | 25 | 91 | 3.86 | |||||||||||||||
| R precuneus | 7 | 27 | −60 | 31 | a | 3.8 | |||||||||||||||
| a | 7 | 21 | −59 | 44 | a | 3.59 | |||||||||||||||
| L posterior cingulate | 20 | −3 | −22 | 23 | 20 | 3.67 | |||||||||||||||
| a | 23 | 6 | −22 | 26 | 23 | 4.01 | |||||||||||||||
Clusters presented are more than 10 contiguous voxels surviving an α of 0.001 (uncorrected). All areas survive FDR corrected P < 0.05. Volume of clusters is indicated in voxels of 3 mm3 for the maximal peak. BA: Brodmann's Areas, x, y, z: Montreal Neurological Institute (MNI) Coordinates, Z: z‐core, Infin: Infinite, R: Right, L: Left, Inf: Inferior, Mid: Middle, Sup: Superior, Med: Medial.
Subpeaks of larger clusters immediately above.
Table IV.
Greater activation for more consistent words separately for the rhyming and spelling tasks and separately for orthographic and phonological consistency
| Rhyming | Spelling | ||||||||||||||||||||
|---|---|---|---|---|---|---|---|---|---|---|---|---|---|---|---|---|---|---|---|---|---|
| Orthographic | Phonological | Orthographic | Phonological | ||||||||||||||||||
| Region | BA | x | y | z | Voxel | Z | x | y | z | Voxel | Z | x | y | z | Voxel | Z | x | y | z | Voxel | Z |
| Medial | |||||||||||||||||||||
| R posterior cingulate | 31 | 6 | −57 | 25 | 471 | 5.25 | 9 | −54 | 33 | 573 | 4.61 | ||||||||||
| R postcentral G | 7 | 9 | −49 | 63 | a | 4.37 | |||||||||||||||
| R precuneus | 7 | 6 | −50 | 49 | a | 4.16 | 3 | −51 | 38 | a | 4.58 | ||||||||||
| a | 7 | −3 | −56 | 42 | a | 4.51 | |||||||||||||||
| L medial frontal G | 11 | 0 | 46 | −15 | 46 | 4.57 | |||||||||||||||
| Temporal | |||||||||||||||||||||
| L mid temporal G | 39 | −45 | −63 | 20 | 32 | 3.80 | |||||||||||||||
| R mid temporal G | 21 | 45 | −1 | −28 | 23 | 3.61 | |||||||||||||||
| R sup temporal G | 22 | 53 | −57 | 17 | 18 | 3.71 | |||||||||||||||
Clusters presented are more than 10 contiguous voxels surviving an α of 0.001 (uncorrected). All areas survive FDR corrected P < 0.05. Volume of clusters is indicated in voxels of 3 mm3 for the maximal peak. BA: Brodmann's Areas, x, y, z: Montreal Neurological Institute (MNI) Coordinates, Z: z‐core, Infin: Infinite, R: Right, L: Left, Inf: Inferior, Mid: Middle, Sup: Superior, Med: Medial.
Subpeaks of larger clusters immediately above.
Figure 2 (surrounding graphs) also shows that there appears to be task differences in phonological and orthographic consistency effects for anterior cingulate cortex/medial frontal gyrus and posterior cingulate cortex/precuneus. For both regions, the correlation between greater activation and more phonologically inconsistent words was much larger for the rhyming than for the spelling task, but the correlation between greater activation and more orthographically inconsistent words was similar across the two tasks. A paired‐sample t‐test directly comparing the rhyming to the spelling task revealed that the phonological inconsistency effect (greater activation for more inconsistent words) was larger for the rhyming than for the spelling task in anterior cingulate cortex/medial frontal gyrus as well as left inferior/middle frontal gyrus (see Fig. 3 top row, and Table V) and that the phonological consistency effect (greater activation for more consistent words) was larger for the rhyming than for the spelling task in posterior cingulate cortex/precuneus (see Fig. 3 bottom row, Table VI). Task differences in the orthographic consistency/inconsistency effect were much smaller. Furthermore, the spelling task did not have a larger consistency/inconsistency effect in any brain region when compared with the rhyming task.
Figure 3.
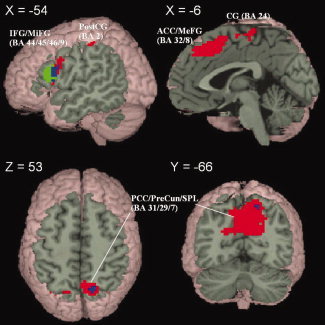
(Top row) Regions in which greater activation for more inconsistent words is significantly greater for the rhyming compared to the spelling task. The regions include inferior frontal gyrus (IFG), middle frontal gyrus (MiFG), postcentral gyrus (PostCG), anterior cingulate cortex (ACC), medial frontal gyrus (MeFG), and cingulate gyrus (CG). (Bottom row) Regions in which the greater activation for more consistent words is greater for the rhyming compared to the spelling task. The regions include posterior cingulate cortex (PCC), precuneus (PreCun) and superior parietal lobule (SPL). Color indicates whether task differences were due to phonological consistency (red), orthographic consistency (green) or both (blue).
Table V.
Greater activation for more inconsistent words for the rhyming task that are larger than for the spelling task collapsed across orthographic and phonological consistency and separately for each consistency
| Region | Voxel | BA | x | y | z | Z |
|---|---|---|---|---|---|---|
| Collapsed | ||||||
| L anterior cingulate | 908 | 32 | −6 | 22 | 38 | 5.48 |
| R medial frontal G | a | 8 | 6 | 37 | 40 | 4.9 |
| R medial frontal G | a | 8 | 6 | 25 | 43 | 4.69 |
| L inf frontal G | 507 | 44 | −53 | 15 | 19 | 5.23 |
| L inf frontal G | a | 9 | −56 | 10 | 24 | 5.17 |
| L inf frontal G | a | 47 | −45 | 26 | −1 | 3.88 |
| R inf frontal G | 153 | 9 | 53 | 10 | 27 | 4.33 |
| R inf frontal G | a | 45 | 50 | 21 | 18 | 3.85 |
| R inf frontal G | a | 9 | 42 | 8 | 38 | 3.51 |
| R anterior cingulate | 15 | 24 | 6 | −4 | 31 | 3.48 |
| R precentral G | 12 | 4 | 56 | −10 | 39 | 3.45 |
| Orthographic | ||||||
| L inf frontal G | 101 | 45 | −53 | 18 | 13 | 4.16 |
| L inf frontal G | a | 9 | −56 | 7 | 25 | 3.36 |
| L mid frontal G | a | 46 | −45 | 21 | 21 | 3.33 |
| Phonological | ||||||
| L anterior cingulate | 842 | 32 | −6 | 22 | 38 | 5.6 |
| R anterior cingulate | a | 32 | 9 | 17 | 43 | 4.93 |
| R sup frontal G | a | 6 | 6 | 11 | 49 | 4.89 |
| L inf frontal G | 77 | 9 | −56 | 10 | 24 | 4.26 |
| L inf frontal G | a | 44 | −56 | 18 | 13 | 3.38 |
| R precentral G | 107 | 9 | 39 | 14 | 38 | 3.89 |
| R inf frontal G | a | 9 | 53 | 10 | 27 | 3.69 |
| R Mid Frontal G | a | 9 | 53 | 5 | 36 | 3.54 |
| R anterior cingulate | 19 | 24 | 6 | −1 | 33 | 3.75 |
| L postcentral G | 42 | 2 | −45 | −24 | 48 | 3.72 |
| R lingual G | 10 | 19 | 18 | −4 | 3 | 3.55 |
Clusters presented are more than 10 contiguous voxels surviving an α of 0.001 (uncorrected). All areas survive FDR corrected P < 0.05. Volume of clusters is indicated in voxels of 3 mm3 for the maximal peak. BA: Brodmann's Areas, x, y, z: Montreal Neurological Institute (MNI) Coordinates, Z: z‐core, Infin: Infinite, R: Right, L: Left, Inf: Inferior, Mid: Middle, Sup: Superior, Med: Medial.
Subpeaks of larger clusters immediately above.
Table VI.
Greater activation for more consistent words for the rhyming task that are larger than for the spelling task collapsed across orthographic and phonological consistency and separately for each consistency
| Region | Voxel | BA | x | y | Z | Z |
|---|---|---|---|---|---|---|
| Collapsed | ||||||
| R sup parietal lobule | 1,023 | 7 | 15 | −64 | 53 | 5.68 |
| R precuneus | a | 31 | 9 | −63 | 25 | 5.45 |
| R posterior cingulate | a | 31 | 3 | −36 | 40 | 4.94 |
| R posterior cingulate | 133 | 29 | 3 | −40 | 13 | 4.39 |
| R mid temporal G | 15 | 39 | 48 | −69 | 20 | 3.91 |
| R sup temporal G | 25 | 38 | 50 | 11 | −21 | 3.88 |
| R sup temporal G | a | 38 | 42 | 13 | −28 | 3.38 |
| Orthographic | ||||||
| R sup parietal lobule | 12 | 7 | 15 | −64 | 53 | 3.52 |
| Phonological | ||||||
| R precuneus | 928 | 7 | 9 | −63 | 28 | 5.02 |
| R sup parietal lobule | a | 7 | 15 | −67 | 56 | 4.98 |
| L precuneus | a | 7 | 0 | −50 | 41 | 4.68 |
Clusters presented are more than 10 contiguous voxels surviving an α of 0.001 (uncorrected). All areas survive FDR corrected P < 0.05. Volume of clusters is indicated in voxels of 3 mm3 for the maximal peak. BA: Brodmann's Areas, x, y, z: Montreal Neurological Institute (MNI) Coordinates, Z: z‐core, Infin: Infinite, R: Right, L: Left, Inf: Inferior, Mid: Middle, Sup: Superior, Med: Medial.
Subpeaks of larger clusters immediately above.
Lastly, in a set of multiple regressions, we analyzed the relationship of age and task accuracy with orthographic and phonological consistency separately for the rhyming and spelling task. Figure 4 (top left image) shows higher accuracy (partialed for age) was associated with a stronger correlation between greater activation and more inconsistent words in left fusiform gyrus for both orthographic (voxel = 30, x = −33, y = −54, z = −9, Z = 3.94) and phonological consistency (voxel = 15, x = −33, y = −54, z = −3, Z = 3.51). Figure 4 (bottom left image) shows higher accuracy (partialed for age) was also associated with a stronger correlation between greater activation and more consistent words in posterior cingulate cortex/precuneus for phonological consistency (voxel = 67, x = 0, y = −54, z = 42, Z = 3.69). To understand the nature of this correlation, we separated the children into top, middle, and bottom thirds in their task accuracy and plotted the average of the partialed β values for the group peak voxel (Fig. 4 graphs). The intercept plotted was calculated by using the average β value for all items for each subject that was then averaged by group. For left fusiform gyrus, these data reveal a decrease in the negative slope from high to low accuracy for orthographic (mean β value = −6.64, −2.77, and 0.69, respectively) and phonological (mean β values = −7.21, −2.54, and 1.30, respectively) consistency. The correlation between accuracy (partialed for age) and these mean β values for the peak voxel was significant for phonological (r = 0.45, P < 0.001) and orthographic (r = 0.46, P < 0.001) consistency. For posterior cingulate cortex/precuneus, the data reveal a similar positive slope for the high and middle accuracy groups for phonological consistency (mean β values = 4.29 and 3.86, respectively), with the low accuracy group having a near zero slope (mean β value = 0.18). The correlation between accuracy (partialed for age) and these mean β values for the peak voxel was significant for phonological consistency (r = 0.66, P < 0.001). The multiple regressions did not show significant correlations between age (partialed for accuracy) and consistency effects for either task. Similar regression analyses were conducted with standard scores on phonological awareness [Wagner et al., 1999], nonword reading [Woodcock et al., 2001], and word reading [Woodcock et al., 2001] as well as on verbal and performance IQ [Wechsler, 1999]. Several positive correlations were found in bilateral inferior frontal gyrus/insula with phonological awareness, nonword reading and word reading indicating that, similar to performance accuracy on the task, effects of inconsistency increase with skill; however, these correlations failed to survive FDR correction.
Figure 4.
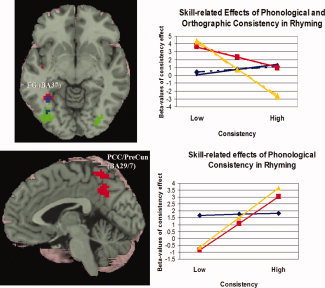
(Top left) Higher accuracy correlated with greater activation for more inconsistent words in the rhyming task in left fusiform gyrus (FG) for phonological (red) and orthographic (green) consistency (overlap in blue). (Bottom left) Higher accuracy correlated with greater activation for more consistent words in the rhyming task in posterior cingulate cortex/precuneus (PCC/PreCun) for phonological consistency (red). (Right) Graphs display accuracy groups for the top (yellow), middle (red), bottom (blue) third of task performers. Solid lines indicate phonological consistency and dotted lines indicate orthographic consistency. The bottom third of task performers were not sensitive to consistency, whereas better performers were.
DISCUSSION
Although previous studies have examined the neural correlates of phonological inconsistency (i.e. the rime of a written word can have multiple pronunciations like seat versus sweat), this study is the first to examine the neural correlates of orthographic inconsistency (i.e. the rhyme of a spoken word can have multiple spellings like grade vs. laid). In addition, this is the first study to examine the neural correlates of inconsistency effects in children and their relationship to skill differences. This is also the first study to examine whether inconsistency effects are modulated by the nature of the linguistic task. To do this, we examined inconsistency effects for a rhyming task that required mapping between orthographic and phonological representations for correct performance and a spelling task that could be correctly performed without mapping between orthographic and phonological representations. In these tasks, two words were presented sequentially in the visual modality and the HRF to the first word in the pair was modeled.
Our results are consistent with previous studies that have shown greater activation for inconsistent compared with consistent words in left inferior frontal gyrus, left superior temporal cortex, left fusiform gyrus, left inferior parietal lobule, and bilateral medial frontal gyrus/anterior cingulate cortex [Binder et al., 2005; Fiez et al., 1999; Herbster et al., 1997; Peng et al., 2004; Tan et al., 2001] (see Fig. 2). The greater activation in all regions but the medial frontal gyrus/anterior cingulate cortex for inconsistent words presumably results from greater demands on orthographic and phonological processing [Booth et al., 2002, 2003; Cohen et al., 2004; Dehaene et al., 2004; Poldrack et al., 1999; Vigneau et al., 2006]. Greater activation in medial frontal gyrus/anterior cingulate is probably related to conflict resolution procedures [Barber and Carter, 2005; Kerns et al., 2004] because of the inconsistent spelling and sound information.
The difference between inconsistent and consistent words was greater in the rhyming task compared with the spelling task in bilateral inferior frontal gyrus and medial frontal gyrus/anterior cingulate cortex (see Fig. 3). The rhyming and not the spelling, task required mapping between orthographic and phonological representations for correct performance. This mapping may have made the participants more sensitive to the relationship between orthographic and phonological representations and this required greater phonological processing resources [Poldrack et al., 1999; Vigneau et al., 2006] and greater reliance on conflict resolution procedures [Barber and Carter, 2005; Kerns et al., 2004]. Task differences in the inconsistency effect were primarily driven by phonological inconsistency, showing that mapping from orthography to phonology is most influenced by inconsistency from orthography to phonology.
Although some studies using a variety of tasks have implicated the fusiform gyrus in semantic processing [Balsamo et al., 2006; Mechelli et al., 2006; Simons et al., 2003; Wheatley et al., 2005], others have suggested that the fusiform gyrus is centrally involved in orthographic processing and this region has been referred by researchers as the Visual word form area (VWFA) [Cohen et al., 2004; Dehaene et al., 2004]. The fact that we observed inconsistency effects in the fusiform gyrus shows that this region is sensitive to the mapping between orthographic and phonological representations. We cannot argue from this finding that phonological information is represented in fusiform gyrus, just that it influences processing in this region. We also demonstrated that the effect of inconsistency shown in this region was modulated by differences in skill as measured by task performance (see Fig. 4). Low skill readers (bottom third in accuracy) showed a weaker correlation of activation with both phonological and orthographic inconsistency compared with moderate skill readers (middle third in accuracy) who in turn showed a weaker correlation compared with high skill readers (top third in accuracy). In general, our finding of larger inconsistency effects in better readers is in line with previous behavioral research [Ehri and Wilce, 1980; Laxon et al., 1991; Perin, 1983; Stuart and Masterson, 1992; Tunmer and Nesdale, 1982; Zecker, 1991]. However, our neuroimaging study showed that sensitivity to inconsistent words, marked by increased activation, emerged before sensitivity to consistent words, marked by decreased activation, with respect to developing skill. In other words, both moderate and high skill readers showed greater activation compared with low skill readers for inconsistent words, whereas only high skill readers showed reduced activation compared with low and moderate skill readers for consistent words. The earlier emergence of sensitivity to inconsistent words is in line with a neuroimaging study examining learning of an artificial grammar that found item‐based learning dominates early in learning, whereas ‘rule‐based’ learning dominates later in learning [Opitz and Friederici, 2004]. Item‐based learning is necessary for the acquisition of inconsistent words because they are exceptions to the ‘rule,’ whereas ‘rule‐based’ learning can be applied to consistent words because they have regular mappings between orthography and phonology. The earlier emergence of sensitivity to inconsistent words is also in line with a behavioral study that showed preschool children reveal prototype and item‐based knowledge, whereas adults show only prototype‐based knowledge after learning visual categories [Boswell and Green, 1982]. Item‐based learning is necessary for learning the inconsistent words in our study, whereas the consistent words can be thought of as prototypes because they have a family of similar words (e.g. ball, call, fall, hall, mall, tall, wall).
Although, one study reported greater activation for consistent than inconsistent words in bilateral precentral gyrus [Fiez et al., 1999], all other studies examining consistency effects have not reported greater activation for consistent words [Binder et al., 2005; Herbster et al., 1997; Peng et al., 2004; Tan et al., 2001]. However, all previous studies treated consistency as a dichotomous variable, so they may have not been sensitive enough to detect activation associated with consistent words. In contrast to these studies, we treated consistency as a continuous variable and found greater activation for consistent compared wth inconsistent words in posterior superior/middle temporal gyrus (BA 39) (see Fig. 2). A recent meta‐analysis has implicated BA 39 in semantic processing [Vigneau et al., 2006], so consistent words may allow for greater access to representations because behavioral research shows consistent words are recognized more quickly than inconsistent words [Fiez et al., 1999; Jared et al., 1990; Lacruz and Folk, 2004; Stone et al., 1997; Ziegler et al., 1997].
We also found greater activation for more consistent words in precuneus/posterior cingulate cortex (see Fig. 2). This region has recently been dubbed a central component of the “default state” or resting state network [Raichle, 1998; Raichle et al., 2001] of the brain that shows anticorrelations with attention‐demanding tasks [Fox et al., 2005], particularly with respect to visual processing [Shulman et al., 1997]. More specifically, Raichle and coworkers [Raichle, 1998; Raichle et al., 2001] has proposed that the posterior cingulate cortex and adjacent precuneus is involved spatial attention particularly gathering information of the visual world in the periphery. Moreover, task demands that increased attention for processing foveal‐based visual information result in suppression of these brain regions. Because the demands of attention decrease with more automatic, skilled processing, activation in precuneus/posterior cingulate cortex has been shown to increase when stimuli are more familiar and easier to process. In support of this, studies have shown greater activation in these regions for high frequency compared with low frequency Chinese characters [Kuo et al., 2003], for early versus late learned words [Fiebach et al., 2003], for words compared withto nonwords [Binder et al., 2005] and for visually familiar words compared to pseudo‐words [Ischebeck et al., 2004] and from practice‐related increases in performance on verb‐generation tasks [Raichle et al., 1994]. In the context of our study, consistent words demand less of the attentional system because they are easier to process than inconsistent words, and therefore resulted in greater activation for precuneus/posterior cingulate cortex for consistent words. Furthermore, this effect of consistency in precuneus/posterior cingulate cortex was modulated by performance on the task with low skill participants showing no consistency effect compared with moderate and high skill participants.
The hypothesis that the precuneus/posterior cingulate cortex should show greater activation in situations than demand less attention also provides an explanation of the task and skill differences in the consistency effect. In terms of the task differences, we found that the rhyming task showed a larger difference between consistent and inconsistent words (i.e. there was a stronger correlation) as compared with the spelling task, and this was particularly true for phonologically consistent words (see Fig. 3). The rhyming task was more difficult than the spelling task (84 vs. 92%, respectively) and required mapping from orthographic to phonological representations. This mapping process necessarily involves the consistency between these representations, and therefore, the more demanding inconsistent words may have produced greater suppression of activation in the precuneus/posterior cingulate cortex in the rhyming task. The spelling task was easier than the rhyming task and could be correctly performed without mapping between orthographic and phonological representations. The fact that mapping was not required for the spelling task could explain why there was a smaller consistency effect as compared with the rhyming task. In terms of skill differences, we found that low skill readers (bottom third in accuracy) showed a weaker correlation of activation with phonological consistency compared with the moderate (middle third in accuracy) and high skill readers (top third in accuracy) on the rhyming task (see Fig. 4). This suggests that moderate and high skill readers were able to more effectively suppress activation in precuneus/posterior cingulate cortex in order to focus their attention on the demanding phonologically inconsistent stimuli. Our finding of larger consistency effects for higher skill readers is in line with previous behavioral research [Ehri and Wilce, 1980; Laxon et al., 1991; Perin, 1983; Stuart and Masterson, 1992; Tunmer and Nesdale, 1982; Zecker, 1991]. The lack of skill differences in the correlation between activation and consistency for the spelling task may be again because this task did not require mapping from orthographic to phonological representations.
In conclusion, this is the first study to demonstrate both orthographic and phonological inconsistency effects in the brain and it is also the first to examine whether these inconsistency effects are modulated by task and skill. We showed that inconsistent words were associated with greater activation in several brain regions including left inferior frontal gyrus and medial frontal gyrus/anterior cingulate cortex. We also showed that consistent words were associated with greater activation in several brain regions including precuneus/posterior cingulate cortex. However, both of these effects were larger for phonologically inconsistent words in the task that required mapping from orthography to phonology (i.e. rhyming). Finally, we showed that higher skill readers were more sensitive to the consistency manipulation in fusiform gyrus and precuneus/posterior cingulate cortex. These findings implicate a skill‐based developmental trajectory for sensitivity to spelling‐sound (and sound‐spelling) relationships in cortex.
Contributor Information
Donald J. Bolger, Email: d-bolger@northwestern.edu.
James R. Booth, Email: j-booth@northwestern.edu.
REFERENCES
- Balsamo LM,Xu B,Gaillard WD ( 2006): Language lateralization and the role of the fusiform gyrus in semantic processing in young children. Neuroimage 31: 1306–1314. [DOI] [PubMed] [Google Scholar]
- Barber AD,Carter CS ( 2005): Cognitive control involved in overcoming prepotent response tendencies and switching between tasks. Cereb Cortex 15: 899–912. [DOI] [PubMed] [Google Scholar]
- Binder JR,McKiernan KA,Parsons ME,Westbury CF,Possing ET,Kaufman JN,Buchanan L ( 2003): Neural correlates of lexical access during visual word recognition. J Cogn Neurosci 15: 372–393. [DOI] [PubMed] [Google Scholar]
- Binder JR,Medler DA,Desai R,Conant LL,Liebenthal E ( 2005): Some neurophysiological constraints on models of word naming. Neuroimage 27: 677–693. [DOI] [PubMed] [Google Scholar]
- Bitan T,Booth JR,Choy J,Burman DD,Gitelman DR,Mesulam MM ( 2005): Shifts of effective connectivity within a language network during rhyming and spelling. J Neurosci 25: 5397–5403. [DOI] [PMC free article] [PubMed] [Google Scholar]
- Bitan T,Burman DD,Lu D,Cone N,Gitelman DR,Mesulam MM,Booth JR ( 2006): Weaker top‐down modulation from left inferior frontal gyrus area in children. Neuroimage 33: 991–998. [DOI] [PMC free article] [PubMed] [Google Scholar]
- Booth JR,Burman DD,Meyer JR,Gitelman DR,Parrish TR,Mesulam MM ( 2002): Functional anatomy of intra‐ and cross‐modal lexical tasks. NeuroImage 16: 7–22. [DOI] [PubMed] [Google Scholar]
- Booth JR,Burman DD,Meyer JR,Gitelman DR,Parrish TR,Mesulam MM ( 2003): The relation between brain activation and lexical performance. Hum Brain Mapp 19: 155–169. [DOI] [PMC free article] [PubMed] [Google Scholar]
- Booth JR,Perfetti CA,MacWhinney B ( 1999): Quick, automatic, and general activation of orthographic and phonological representations in young readers. Dev Psychol 35: 3–19. [DOI] [PubMed] [Google Scholar]
- Boswell DA,Green HF ( 1982): The abstraction and recognition of prototypes by children and adults. Child Dev 53: 1028–1037. [PubMed] [Google Scholar]
- Burock MA,Buckner RL,Woldorff MG,Rosen BR,Dale AM ( 1998): Randomized event‐related experimental designs allow for extremely rapid presentation rates using functional MRI. Neuroreport 9: 3735–3739. [DOI] [PubMed] [Google Scholar]
- Byrne B ( 1992): Studies in the acquisition procedure: rationale, hypotheses and data In: Gough PB, Ehri LC, Treiman R, editors. Reading Acquisition. Hillsdale, NJ: L. Erlbaum Associates; pp 1–34. [Google Scholar]
- Cohen L,Jobert A,Le Bihan D,Dehaene S ( 2004): Distinct unimodal and multimodal regions for word processing in the left temporal cortex. Neuroimage 23: 1256–1270. [DOI] [PubMed] [Google Scholar]
- Dehaene S,Jobert A,Naccache L,Ciuciu P,Poline JB,Le Bihan D,Cohen L ( 2004): Letter binding and invariant recognition of masked words: Behavioral and neuroimaging evidence. Psychol Sci 15: 307–313. [DOI] [PubMed] [Google Scholar]
- Ehri LC ( 1991): Learning to read and spell words In: Rieben L,Perfetti CA, editors. Learning to Read: Basic Research and its Implications. Hillsdale, NJ, USA: Lawrence Erlbaum Associates, Inc. pp 57–73. [Google Scholar]
- Ehri LC,Wilce LS ( 1980): The influence of orthography on readers' conceptualization of the phonemic structure of words. Appl Psycholinguist 1: 371–385. [Google Scholar]
- Fiebach CJ,Friederici AD,Muller K,von Cramon DY,Hernandez AE ( 2003): Distinct brain representations for early and late learned words. Neuroimage 19: 1627–1637. [DOI] [PubMed] [Google Scholar]
- Fiez JA,Balota DA,Raichle ME,Petersen SE ( 1999): Effects of lexicality, frequency, and spelling‐to‐sound consistency on the functional anatomy of reading. Neuron 24: 205–218. [DOI] [PubMed] [Google Scholar]
- Fox MD,Snyder AZ,Vincent JL,Corbetta M,Van Essen DC,Raichle ME ( 2005): The human brain is intrinsically organized into dynamic, anticorrelated functional networks. Proc Natl Acad Sci USA 102: 9673–9678. [DOI] [PMC free article] [PubMed] [Google Scholar]
- Herbster AN,Mintun MA,Nebes RD,Becker JT ( 1997): Regional cerebral blood flow during word and nonword reading. Hum Brain Mapp 5: 84–92. [DOI] [PubMed] [Google Scholar]
- Ischebeck A,Indefrey P,Usui N,Nose I,Hellwig F,Taira M ( 2004): Reading in a regular orthography: an FMRI study investigating the role of visual familiarity. J Cogn Neurosci 16: 727–741. [DOI] [PubMed] [Google Scholar]
- Jared D ( 1997): Spelling‐sound consistency affects the naming of high‐frequency words. J Mem Lang 36: 505–529. [Google Scholar]
- Jared D,McRae K,Seidenberg MS ( 1990): The basis of consistency effects in word naming. J Mem Lang 29: 687–715. [Google Scholar]
- Katz L,Lee CH,Tabor W,Frost SJ,Mencl WE,Sandak R,Rueckl J,Pugh KR ( 2005): Behavioral and neurobiological effects of printed word repetition in lexical decision and naming. Neuropsychologia 43: 2068–2083. [DOI] [PubMed] [Google Scholar]
- Kerns JG,Cohen JD, MacDonald AW,3rd ,Cho RY,Stenger VA,Carter CS ( 2004): Anterior cingulate conflict monitoring and adjustments in control. Science 303: 1023–1026. [DOI] [PubMed] [Google Scholar]
- Kessler B,Treiman R,Mullennix J ( 2002): Phonetic biases in voice key response time measurements. J Mem Lang 47: 145–171. [Google Scholar]
- Kessler B,Treiman R,Mullennix J (in press): Feedback consistency effects in single‐word reading In: Grigorenko EJ, Naples A, editors. Single‐Word Reading: Cognitive, Behavioral, and Biological Perspectives. Mahwah, NJ: Erlbaum. [Google Scholar]
- Kuo WJ,Yeh TC,Lee CY,Wu YT,Chou CC,Ho LT,Hung DL,Tzeng OJ,Hsieh JC ( 2003): Frequency effects of Chinese character processing in the brain: an event‐related fMRI study. Neuroimage 18: 720–730. [DOI] [PubMed] [Google Scholar]
- Lacruz I,Folk J ( 2004): Feedforward and feedback consistency effects for high‐ and low‐frequency words in lexical decision and naming. Q J Exp Psychol A 57: 1261–1284. [DOI] [PubMed] [Google Scholar]
- Laxon V,Masterson J,Coltheart V ( 1991): Some bodies are easier to read: The effect of consistency and regularity on children's reading. Q J Exp Psychol A 43: 793–824. [Google Scholar]
- Massaro DW,Jesse A ( 2005): The magic of reading: Too many influences for quick and easy explanations In: Trabasso T,Sabatini D, Massaro DW, Calfee RC, editors. From Orthography to Pedagogy: Essays in Honor of Richard L. Venezky. Mahwah, NJ: Erlbaum; pp 37–61. [Google Scholar]
- Mechelli A,Sartori G,Orlandi P,Price CJ ( 2006): Semantic relevance explains category effects in medial fusiform gyri. Neuroimage 30: 992–1002. [DOI] [PubMed] [Google Scholar]
- Opitz B,Friederici AD ( 2004): Brain correlates of language learning: The neuronal dissociation of rule‐based versus similarity‐based learning. J Neurosci 24: 8436–8440. [DOI] [PMC free article] [PubMed] [Google Scholar]
- Peereman R,Content A,Bonin P ( 1998): Is perception a two‐way street? The case of feedback consistency in visual word recognition. J Mem Lang 39: 151–174. [Google Scholar]
- Peng D‐L,Ding G‐S,Perry C,Xu D,Jin Z,Luo Q,Zhang L,Deng Y,Perry CChth ( 2004): fMRI evidence for the automatic phonological activation of briefly presented words. Cogn Brain Res 20: 156–164. [DOI] [PubMed] [Google Scholar]
- Perfetti CA ( 1992): The representation problem in reading acquisition In: Gough LCEPB,Treiman R, editors. Reading Acquisition. Hillsdale, NJ: L. Erlbaum Associates; pp 145–174. [Google Scholar]
- Perfetti CA,Bell L,Delaney SM ( 1988): Automatic (prelexical) phonetic activation in silent word reading: Evidence from backward masking. J Mem Lang 27: 59–70. [Google Scholar]
- Perin D ( 1983): Phonemic segmentation and spelling. Br J Psychol 74: 129–144. [Google Scholar]
- Plaut DC,McClelland JL,Seidenberg MS,Patterson K ( 1996): Understanding normal and impaired word reading: Computational principles in quasi regular domains. Psychol Rev 103: 56–115. [DOI] [PubMed] [Google Scholar]
- Poldrack RA,Wagner AD,Prull MW,Desmond JE,Glover GH,Gabrieli JD ( 1999): Functional specialization for semantic and phonological processing in the left inferior prefrontal cortex. Neuroimage 10: 15–35. [DOI] [PubMed] [Google Scholar]
- Raichle ME ( 1998): The neural correlates of consciousness: an analysis of cognitive skill learning. Phil Trans R Soc London Ser B 353: 1889–1901. [DOI] [PMC free article] [PubMed] [Google Scholar]
- Raichle ME,Fiez JA,Videen TO,MacLeod AK,Pardo JV,Fox PT,Petersen SE ( 1994): Practice‐related changes in human brain functional anatomy during non‐motor learning. Cereb Cortex 4: 8–26. [DOI] [PubMed] [Google Scholar]
- Raichle ME,MacLeod AM,Snyder AZ,Powers WJ,Gusnard DA,Shulman GL ( 2001): A default mode of brain function. Proc Natl Acad Sci USA 98: 676–682. [DOI] [PMC free article] [PubMed] [Google Scholar]
- Seidenberg MS,Waters GS,Barnes MA,Tanenhaus MK ( 1984): When does irregular spelling or pronunciation influence word recognition. J Verbal Learn Verbal Behav 23: 383–404. [Google Scholar]
- Shulman G,Fiez JA,Corbetta M,Buckner R,Miezin FM,Raichle ME,Petersen SE ( 1997): Common blood flow changes across visual tasks: II.” Decreases in cerebral cortex. J Cogn Neurosci 9: 648–663. [DOI] [PubMed] [Google Scholar]
- Simons JS,Koutstaal W,Prince S,Wagner AD,Schacter DL ( 2003): Neural mechanisms of visual object priming: Evidence for perceptual and semantic distinctions in fusiform cortex. Neuroimage 19: 613–626. [DOI] [PubMed] [Google Scholar]
- Stone GO,Vanhoy M,VanOrden GC ( 1997): Perception is a two way street: Feedforward and feedback phonology in visual word recognition. J Mem Lang 36: 337–359. [Google Scholar]
- Stuart M,Masterson J ( 1992): Patterns of reading and spelling in 10‐year‐old children related to prereading phonological abilities. J Exp Child Psychol 54: 168–187. [Google Scholar]
- Tan LH,Feng C‐M,Fox PT,Gao J‐H ( 2001): An fMRI study with written Chinese. Neuroreport 12: 83–88. [DOI] [PubMed] [Google Scholar]
- Touchstone Applied Science Associates ( 1996): The Educator's Word Frequency Guide. Brewster, NY: Touchstone Applied Science Associates, Inc. [Google Scholar]
- Treiman R,Kessler B,Evans R ( 2007): Anticipatory conditioning of spelling‐to‐sound translation. J Mem Lang 56: 229–245. [Google Scholar]
- Tunmer WE,Nesdale AR ( 1982): The effects of digraphs and pseudowords on phonemic segmentation in young children. Appl Psycholinguistics 3: 299–311. [Google Scholar]
- Vigneau M,Beaucousin V,Herve PY,Duffau H,Crivello F,Houde O,Mazoyer B,Tzourio‐Mazoyer N ( 2006): Meta‐analyzing left hemisphere language areas: phonology, semantics, and sentence processing. Neuroimage 30: 1414–1432. [DOI] [PubMed] [Google Scholar]
- Wagner RK,Torgesen JK,Rashotte CA ( 1999): Comprehensive Test of Phonological Processes. Austin, TX: Pro Ed. [Google Scholar]
- Waters GS,Seidenberg MS,Bruck M ( 1984): Children's and adults' use of spelling‐sound information in three reading tasks. Mem Cogn 12: 293–305. [DOI] [PubMed] [Google Scholar]
- Wechsler D ( 1999): Wechsler Abbreviated Scale of Intelligence. The Psychological Corporation; San Antonio,TX: Harcourt Brace & Company. [Google Scholar]
- Wheatley T,Weisberg J,Beauchamp MS,Martin A ( 2005): Automatic priming of semantically related words reduces activity in the fusiform gyrus. J Cogn Neurosci 17: 1871–1885. [DOI] [PubMed] [Google Scholar]
- Woodcock RW,McGrew KS,Mather N ( 2001): Woodcock‐Johnson III Tests of Achievement. Itasca, IL: The Riverside Publishing Company. [Google Scholar]
- Zecker S ( 1991): The orthographic code: Developmental trends in reading‐disabled and normally‐achieving children. Ann Dyslexia 41: 179–192. [DOI] [PubMed] [Google Scholar]
- Ziegler JC,Montant M,Jacobs AM ( 1997): The feedback consistency effect in lexical decision and naming. J Mem Lang 37: 533–554. [Google Scholar]