

Abstract
Objective
To test the hypothesis that early knee and hand OA development is characterized by detectable changes in serum proteins relevant to inflammation, cell growth, activation, and metabolism several years before OA becomes radiographically evident.
Methods
Using microarray platforms that simultaneously test 169 proteins relevant to inflammation, cell growth, activation and metabolism, we conducted a case-control study nested within the Baltimore Longitudinal Study of Aging (BLSA). Subjects included 22 incident cases of osteoarthritis and 66 age, sex and BMI- matched controls. Serum samples tested were obtained at the time of radiographic classification as either case or control, and up to 10 years earlier at a time when all participants were free of radiographic OA. Proteins with mean signal intensities 4-fold higher than background were compared between cases and controls using multivariate techniques.
Results
Sixteen proteins were different between OA cases compared to controls. Four of these proteins (MMP-7, IL-15, PAI-1 and sVAP-1) were already different in samples obtained 10 years before radiographic classification and remained different at the time of diagnosis. Six additional proteins were only associated with subsequent OA development and not with established OA.
Conclusions
Changes in serum proteins implicated in matrix degradation, cell activation, inflammation and bone collagen degradation products accompany early OA development and can precede radiographic detection by several years.
INTRODUCTION
Osteoarthritis (1) is a highly prevalent chronic health condition that causes substantial disability in late life. At present, conventional radiography is considered the gold standard for the diagnosis of OA but cannot detect early disease or subtle changes over time. To overcome these limitations, the search for diagnostic and prognostic biomarkers has intensified over recent years. Early studies focusing on cartilage precursors, constituents and degradation products (2-4) suggest that perturbation of the delicate balance between degradation and repair mechanisms which eventually lead to cartilage degeneration – occur in the early stages of OA development(2, 5). Additional studies aimed at identifying imaging markers of OA have demonstrated that OA pathogenesis involves other tissues including bone, synovium and meniscus(6). Additional evidence is mounting to suggest that clusters of markers (7-9) may comprise “signatures” predictive of OA development, activity or progression. Reliable and valid biomarkers may identify individuals at high risk of OA (9-11) who may be ideal participants for clinical trials testing interventions of disease modification (12, 13).
One promising approach to identify biomarkers that can reveal the early stages of OA development is to apply high sensitivity technology to characterize the profile of candidate circulating proteins in subjects who have been radiographically characterized at multiple points in time over many years. Following this line of investigation, we conducted a case-control study nested within the Baltimore Longitudinal Study of Aging (BLSA) to test the hypothesis that the early stage of knee and hand OA development is characterized by detectable changes in serum proteins relevant to inflammation, cell growth, activation, and metabolism several years before OA becomes radiographically evident.
METHODS
Design
We conducted a case-control study nested within the Baltimore Longitudinal Study of Aging (BLSA). The BLSA is a longitudinal normative aging study where a cohort of volunteers has been followed prospectively through comprehensive biennial examinations for more than 40 years (14). The BLSA is conducted by the National Institute on Aging intramural research scientists of the Clinical Research Branch, presently located at Harbor Hospital Baltimore, Maryland. This study was approved by the Institutional Review Board of the MedStar Research Institute (MRI 2003-076).
Participants
Participants were community-dwelling healthy volunteers 19-92 years old at study entry, mostly of Caucasian race (96%) and upper middle-class socioeconomic status.
Selection of Cases and Controls
Single posteroanterior radiographs of both hands and weight-bearing, fully extended anteroposterior radiographs of both knees were obtained at one or more visits between 1984 and 1991 and a repeat set of knee x-rays was obtained using the same methodology between 1995 and 1998 as previously reported (15). The mean interval between the initial and follow-up x-rays was approximately 10 years (range 9.3 - 11.9 years) and did not differ between cases and controls.
All radiographs obtained at both time points were independently evaluated for OA using the Kellgren–Lawrence (KL) grades as described in the Atlas of Standard Radiographs (16). Definite OA of the knee was defined as KL grade 2 or higher of either knee. Hand OA was defined as a KL grade of 2 or higher at one or more of the 1st carpal-metacarpal, 2nd or 3rd distal or proximal interphalangeal joints of either hand. Paired radiographs were read by two trained readers blinded from the participant’s identity, time and sequence of examination; a third trained reader adjudicated disagreements. The intra-class correlation coefficient for agreement on KL grade between the 2 reviewers was previously published as 0.83-0.85 for baseline and follow-up films(17).
BLSA participants were eligible for this study if they had 2 sets of x-rays – the first of which had been scored as no evidence of OA, and a set of banked serum samples obtained over the corresponding time interval. Participants who had radiographic OA of one or both knees and one or both hands on the second x-ray were classified as “incident OA” cases. Controls were participants with normal x-rays at both time points selected to match OA cases by age-decade, sex and body mass index category. Serum samples identified for testing were obtained during the initial xray visit and a second sample obtained on average 10 years later during the classifying xray visit.
Rolling Circle Amplification (RCA) Assays: Serum samples were obtained after an overnight fast, immediately processed, and stored at −80°C until testing. RCA enhanced antibody-based protein microarrays were used to assay samples for 169 proteins that spanned cytokines, chemokines, growth factors, apoptosis regulators, soluble receptors, adhesion molecules, enzymes, proteases and their inhibitors, coagulation factors, cell cycle proteins and hormones. Samples were thawed, centrifuged to remove particulate matter and mixed with 0.25 mg/ml Heteroblock (Omega), 0.25 mg/ml IIR (Bioreclamation) and 0.1% Tween-20 prior to the assay. Twenty μL of the treated sample were then applied to each sub-array. As described in detail by others(18, 19), measurements are performed when the sample protein is captured by specific antibody affixed to the chipA secondary detector antibody binds to the captured protein, and is bound by a universal antibody affixed with RCA signal amplifier. Each analyte was tested in quadruplicate. Four quality controls with known concentrations corresponding to four anchor points on the full titration curve were included on each sample slide. The slides were scanned using a LS200 scanner (TECAN) and analyzed using proprietary software (Molecular Staging, Inc). The fluorescence intensity of microarray spots was analyzed for each analyte and the resulting mean intensity values were determined. Standard curves for selected proteins were examined to ensure that increasing intensity corresponded to increasing analyte concentration. Slide-to-slide precision was improved using regression-based normalization (normalization method based on analytically identifying and excluding random background noise) with coefficients of variation of 17%, 20%, 17%, 19%, 18%, and 17%.
Data Analysis
All analyses were performed on samples with mean fluorescence intensity at least 4-fold greater than background, using normalized Z-scores separately. Non-normally distributed data were log-transformed prior to analysis. Data were analyzed using mixed model ANOVA and significant analysis of microarray (20) – a statistical technique that can be used to correlate protein expression data to a wide range of parameters by repeated measurement). This analytic technique was applied to identify significant proteins that distinguish OA from control samples. In the ANOVA analysis, individual samples were treated as the random effect, visit time as repeated measures, and “OA” versus “no OA” as a fixed effect. In the SAM analysis, proteins with different concentrations were determined based on the false discovery rate via permutations. The potential to discriminate OA cases and controls based on aggregated measures of proteins with different concentrations was further examined by principal component analysis (PCA). Finally, we used decision tree analyses to assess classification accuracy between OA and controls based on the proteins with different concentrations. We constructed a binary response tree using assignment as a case or control to recursively partition the data into one of two non-empty groups. This is repeated until the terminal nodes are too small or too few to be split further (21). The differentially expressed proteins were examined by neural network classification using a process of ‘supervised learning’. The entire protein microarray dataset was randomly divided into two parts. The first part, which consisted of total 70% of the data source, was used as the training data set. The remaining 30% of data was used to verify the accuracy of the classification as a case or control. Predicted results were pooled together into receiver operator characteristic (ROC) curves to assess sensitivity and specificity of the differentially expressed proteins for discriminating OA cases from controls, and compared to ROC curves based on all assessed proteins. Finally, mixed effects modeling repeated measure ANOVA was applied to explore age-associated differences between 3 age groups: < 44 years (n= 40), 45-69 (n=91) and 70+ years (n=38).
All analyses were performed using the commercial software Partek and Insightful Miner 3.0 and the open source R package Bioconductor.
RESULTS
We analyzed serum samples from 22 participants classified as incident knee OA and 66 controls who remained OA free over the entire study period. Testing yielded data of acceptable quality for all participants at the initial x-ray visit, and all but 2 cases at the classifying x-ray visit. The time between x-rays did not differ between cases and controls (mean ± SEM 10.03 ± 0.31 years for OA and 9.88 ± 0.22 years for controls; p>0.05). The initial ages of participants ranged from 22 to 92 years. Hand OA was present in 9 of the 21 knee OA participants at the time of the initial X-ray visit, and 10 of the 19 participants at the time of classifying X-ray visit but was not present in controls. The number of participants represented in these analyses stratified by age group is reported in Table 1. Overall, 16 proteins were significantly different between cases and controls at the time of classification. The protein signatures predictive of OA development compared to those individuals remaining OA free include 10 proteins that were different at the initial x-ray visit (Figure 2A). Most of these proteins were observed in lower concentrations (negative z-scores) in OA samples with few exceptions. Furthermore, the differences between OA cases and controls appear more dramatic in the younger age groups. Similarly, Figure 2B depicts the protein concentration patterns detected in blood samples collected at the time of the second x-ray. Comparison of the two patterns demonstrates consistency between the signature predictive of OA development and that associated with OA presence. Table 2 lists the fold changes of these protein signatures distinguish OA from control samples for all ages at the time of initial and classifying X-ray. The fold change was calculated by dividing the averaged value of OA cases by the averaged value of controls. If this number was less than one the (negative) reciprocal is listed.
Table 1.
Characteristics of BLSA Participants Represented at the Time of Initial and Classifying X-ray
| Initial X-ray (1984-1991) | Classifying X-ray (1994-1996) | |||
|---|---|---|---|---|
| OA (n=21) | Controls (n=61) | OA (n=19) | Controls (n=66) | |
| Age (mean ± SD years) | 58.0±15.2 | 52.3±14.4 | 69.4±15.7 | 65.7±14.2 |
| Age Group | ||||
| 22-44 | 3 | 16 | 1 | 6 |
| 45-70 | 12 | 36 | 6 | 31 |
| 71-92 | 6 | 9 | 12 | 29 |
| Men:Women | 9:12 | 25:36 | 8:11 | 29:38 |
| Body Mass Index (kg/m2) | 25.4 ± 3.07 | 25.6 ± 4.4 | 26.7 ± 4.8 | 26.9 ± 4.8 |
Figure 2.
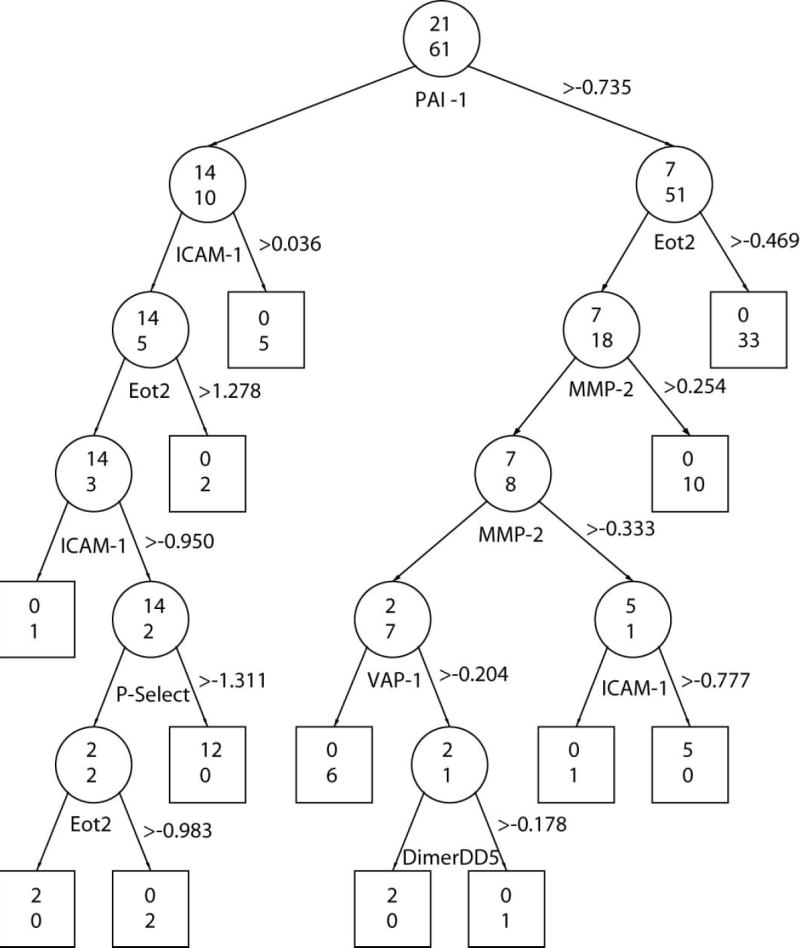
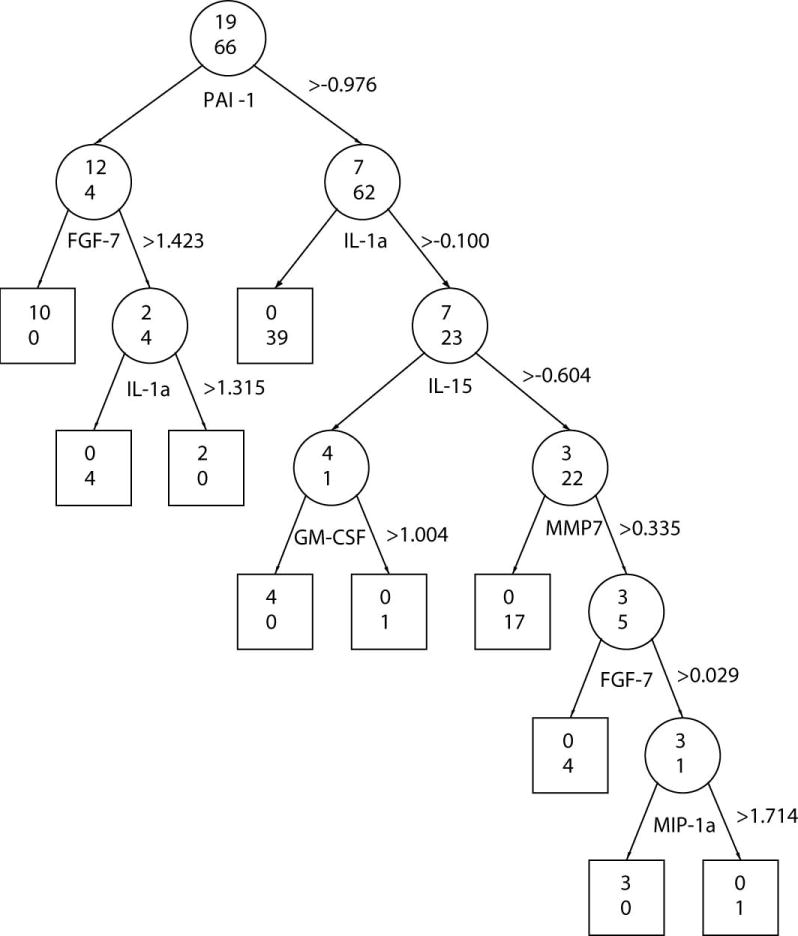
Classification Tree Using Proteins that were Different at Initial and Classifying X-ray Visits. Recursive regression tree classification of OA cases and control samples based on protein amount observed at the time of the initial x-ray (A), and at the time of the classifying x-ray (B). Beside each protein appears the threshold z-score used to classify samples. The odds ratios associated with each protein appear in the brackets. Two numbers are displayed on each node (depicted as circle for nonterminal nodes or square for terminal nodes): the number of samples classified as OA by that protein is shown on the top and the number of participants classified as controls is shown on the bottom. The misclassification error rate was 0.061 for Figure A, and 0.071 for Figure B.
Table 2.
Fold changes of protein signatures distinguish OA from control samples at the time of initial and classifying X-ray
| Initial X-ray (1984-1991) | Classifying X-ray (1994-1996) | ||
|---|---|---|---|
| Protein | Fold change | Proteins | Fold change |
| IL-15 | 1.242 | IL-15 | 1.182 |
| MMP7 | 1.298 | MMP7 | 1.239 |
| PAI-1 | -1.111 | PAI-1 | -1.132 |
| VAP-1 | 1.133 | VAP-1 | 1.228 |
| D-Dimer DD5 | -1.184 | 6Ckine | 1.167 |
| D-Dimer DD6 | -1.30 | BLC | 1.207 |
| Eot2 | -1.503 | FGF-7 | 1.188 |
| ICAM-1 | -1.492 | GM-CSF | 1.165 |
| MMP-2 | -1.122 | ICAM3 | 1.191 |
| P-Select | -1.280 | IGFBP2 | 1.150 |
| IL-1a | 1.158 | ||
| IL-2 | 1.259 | ||
| MIP-1a | 1.248 | ||
| NT4 | 1.240 | ||
| TIMP1 | 1.195 | ||
| VE-cadherin | 1.352 | ||
The results of the PCA analyses are consistent with the findings reported above. Figure 2C illustrates results of PCA analysis that uses proteins that were different at the time of the initial x-ray. The three PCs accounted for 57.4% total variability (38.8%, 9.7% and 8.9% for the first, second and the third principal components respectively). The discrimination between cases and controls using the 16 proteins differentially expressed at x-ray classification is illustrated in Figure 2D. Three principal components accounted for 56.5% of the total variability (26.3%, 17.9% and 12.3% for the main three components). When a similar PCA was conducted using all 169 proteins, the discrimination between cases and controls was significantly lower and accounted for only 37.0% of total variability (18.8%, 9.9%, and 8.3% for the main three components) at the first time point and 34.1% of total variability (14.8%, 10.9%, and 8.4% for the main three components) at the second time point (data not shown). The ROC characteristics of the 10 differentially expressed OA predictive proteins and the 16 differentially expressed OA-associated proteins were superior to all 169 proteins in discriminating cases from controls (data not shown).
Proteins evaluated at the initial x-ray that predicted OA development included increased matrix metalloproteinase (MMP)-7, soluble vascular adhesion protein (VAP)-1and interleukin (IL)-15, and decreased MMP-2, plasminogen activator inhibitor (PAI)-1, D-dimers DD5 and DD6, eotaxin-2, intracellular adhesion molecule (ICAM-1), and P-selectin. Proteins that were different between OA and controls at the time of the classifying x-ray included higher concentrations of proteins relevant to immune response and inflammation - B-lymphocyte chemokine (BLC), 6-chemokine (Ckine), macrophage inhibitory protein (MIP)-1α, IL-1α, IL-2, IL-15, MMP-7; growth and repair - fibroblast growth factor (FGF)-7, insulin-like growth factor binding protein (IGFBP)-2, granulocyte macrophage colony stimulating factor (GM-CSF), neurotrophin-4 (NT4); and cellular and vascular adhesion matrix integrity -ICAM-3, VAP-1, and vascular endothelial (VE)-cadherin. Four of these proteins, IL-15, MMP-7, VAP-1 and PAI-1, were different between cases and controls at both time points with IL-15, MMP-7 and VAP-1 increased and PAI-I decreased in OA cases relative to controls. Although we also examined these OA-predictive and OA-associated proteins for age effects, only MMP-7 expression was also differentially expressed at higher concentrations in the 45-69 and 70+ year compared to the <44 year old samples (data not shown; p < 0.05).
Finally, using recursive partitioning (21), we explored the relationships between individual proteins with different concentrations, and their ability to discriminate cases from controls using z-score thresholds at the initial (Figure 2A) and classifying (Figure 2B) xray visits. These figures illustrate the discriminative value of a given protein in classifying participants as cases or controls is influenced by the by the concentration of other proteins (e.g., ICAM-1) and also differed between visits (e.g. PAI-1). The misclassification error rate was 0.061 for the 10 OA-predictive proteins observed at the initial xray visit, and 0.071 for the 16 OA-associated proteins observed at the classifying x-ray visit (Figure 2B).
DISCUSSION
This is the first study to demonstrate serum protein signatures associated with osteoarthritis. Using a case-control design nested in a large longitudinal study of normative aging, we detected 16 proteins that were different in participants with radiographic knee and hand OA compared to age-, gender-, and BMI-matched controls free of OA. Four of these proteins (MMP-7, IL-15, PAI-1 and sVAP-1) associated with OA presence at the time of the classifying x-ray were also differentially expressed between cases and controls, at a time when OA was not detectable by conventional x-ray. Six additional proteins were different between OA cases and controls at a time when radiographic evidence of OA was not present, but not ten years later when radiographic features had developed. We have also clearly demonstrated that these signatures more accurately distinguished cases from controls at both time points than all proteins assayed, and that there is overlap and consistency in the protein signatures associated with OA at the two points in time.
It is plausible that the protein signatures identified in association with OA are serum markers of disease initiating events (initial OA signature) or disease sustaining events (prevalent OA signature). Accordingly, our data suggest that altered extracellular matrix metabolism plays a central role in OA initiation. The pattern includes a shift away from constitutively expressed MMP-2 towards higher MMP-7 expression and propensity for enhanced plasmin activation to render extracellular matrix vulnerable to degeneration and injury is consistent with previous reports of MMP-7 over expression in human OA chondrocytes(22) and synovial fluid samples(23), and may also explain the lower PAI-1 concentrations observed in OA samples that has not previously been reported. The observations of higher IL-15, vascular adhesion protein-1 (VAP-1) and adhesion molecule concentrations in OA samples, although not previously reported, suggest that cellular and immune mechanisms contribute to OA initiation. The sustained profile comprised of high MMP-7, IL-15, VAP and low PAI-1 associated with prevalent OA suggest that these same mechanisms also contribute to OA perpetuation. However, in contrast to the earlier time point, the protein signature associated with prevalent OA suggests that reparative mechanisms are operative, as evidenced by over-expressed TIMPs and growth factors (FGF, IGF binding protein, GM-CSF, NT-4). The increased expression of inflammatory cytokines and chemokines associated with prevalent OA lend additional support of the notion of OA as an inflammatory disease.
The protein signatures associated with OA in this study are not specific to cartilage, and therefore understandably distinct from those identified in microarray studies of cartilage(24). These proteins cannot be presumed to cartilage-specific events although collagen turnover products are also associated with OA in our study. Interestingly, some of the proteins identified that were associated with older age (e.g. IL-6) are also associated with frailty and sarcopenia. With rare exceptions, the proteins associated with OA were distinct from the expression pattern associated with and predictive of OA development.
Although these results advance our understanding of the molecular markers of OA, there are several limitations inherent in the data. First, this study is based upon microarray data and hence vulnerable to the criticisms implicit to this technology. The simultaneous quantification of 169 proteins might be regarded as “fishing.” However the specific proteins selected a priori for this chip include mediators of inflammation, cell growth, activation and metabolism that are relevant to OA pathogenesis. Additionally, a number of quality control features such as target specificity and use of a 4-fold change as the threshold for inclusion were implemented to reduce the chance of false positive results. Despite the considerable improvement, the sensitivity of this RCA-based assay remains inferior to conventional ELISA assays. We also acknowledge the possibility that the length of storage prior to testing may have compromised sample integrity. Therefore, we cannot exclude that some proteins important to the pathogenesis of OA but with levels below the RCA limits of detection could not be identified. Second, the study sample is small due to our adherence to very strict inclusion and exclusion criteria with careful matching of controls to cases on the most likely confounders of age group, sex and BMI. While this approach increased the precision of our measures and reduced the chances of outcome misclassification, the presence of a few outliers may have influenced the analysis results. Due to the small sample size, we were not able to examine signatures according to specific OA sub-type or clinical pattern. Given the selection criteria for this study, the OA-associated protein signatures identified in this study are most relevant to OA of the knee that and might be less relevant to OA of other locations, or that develops secondary to other processes. Third, this study relied on radiographic definitions of OA to classify individuals as cases or controls. Given the limited sensitivity of conventional x-rays for early changes of OA, it remains possible that participants classified as “normal” may have been affected by early OA that escaped radiographic detection.
Despite the above limitations, this study offers new insight that can be best gleaned through a prospective, long lasting, longitudinal study such as the BLSA. We conclude that osteoarthritis of the knee and hand is associated with serum protein signatures that include mediators of cellular activation, inflammation and matrix degradation, and that some of these proteins were predictive of OA development years prior to radiographic detection. Additionally, except for four proteins, the set of proteins associated with OA at the time of the initial x-ray was not different at the time of the second x-ray and vice-versa. These findings support the notion that these protein signatures are responsive to change over time - and that initiating events and their mediators are distinct from those that sustain the disease. However, additional studies are necessary to establish the utility of these protein profiles for the diagnosis and monitoring of OA. The protein signatures identified in this study may have utility as targets of future intervention studies and/or as prognostic indicators or predictors of therapeutic response.
Figure 1.
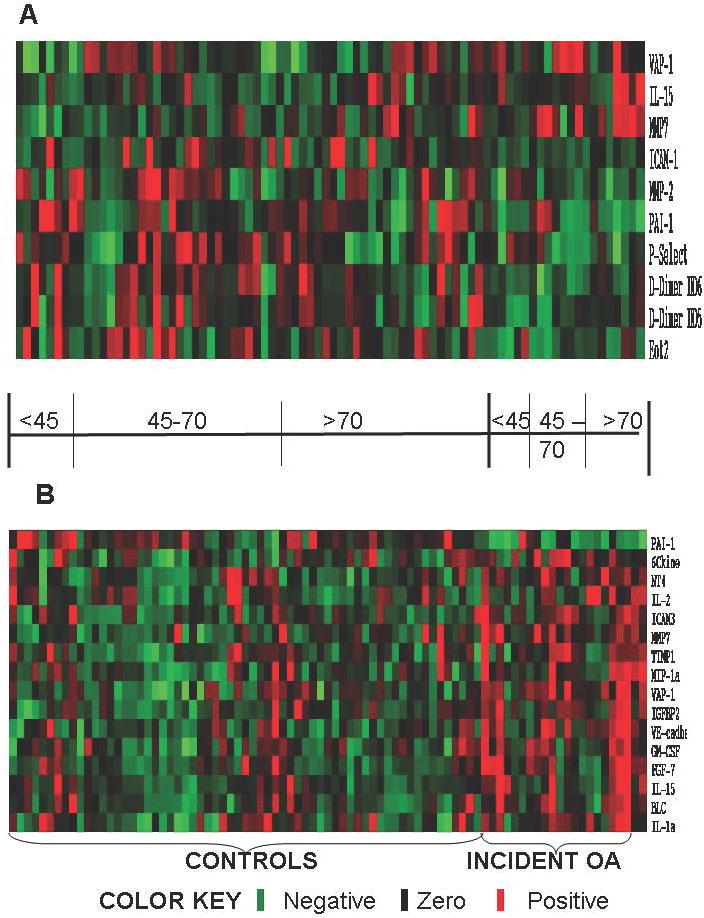
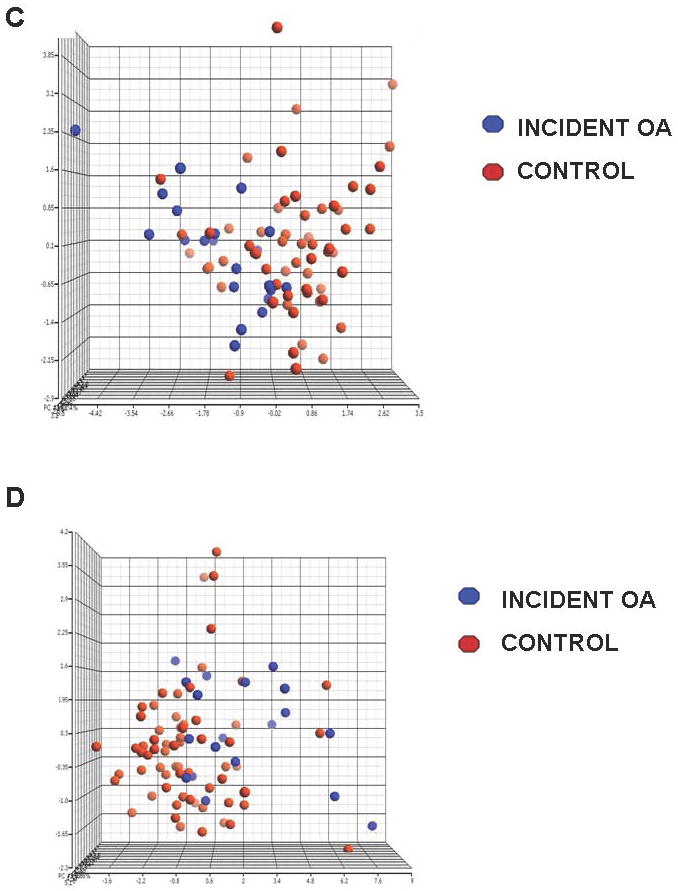
Protein signatures distinguish OA from control samples at both time points. The differences in protein expression between cases and controls at the initial x-ray visit (Panel A) and at the classifying x-ray visit (Panel B) are displayed in the heat-maps. Red depicts proteins that are expressed at higher concentrations in OA samples, while green indicates protein expression at lower concentrations in OA samples. Black spots indicate proteins that were not different between OA and control samples. In both heat maps, samples are horizontally grouped according to the classification of OA and controls, and by age group. Vertically the proteins are arranged by UPGMA clustering based on the Z score expression values. The differentially expressed proteins analyzed by principal components analysis (PCA) are plotted separately with the X, Y and Z axes signifying the 1st, 2nd and 3rd principal components with OA-associated proteins are represented in blue and control-associated proteins in red. The 10 differentially expressed proteins predictive of OA development at the initial x-ray visit (Panel C) and the 16 proteins associated with OA at the classifying x-ray visit (Panel D) illustrate separation of cases from controls at both time points.
Footnotes
Publisher's Disclaimer: This is a PDF file of an unedited manuscript that has been accepted for publication. As a service to our customers we are providing this early version of the manuscript. The manuscript will undergo copyediting, typesetting, and review of the resulting proof before it is published in its final citable form. Please note that during the production process errors may be discovered which could affect the content, and all legal disclaimers that apply to the journal pertain.
References
- 1.Aigner T, Sachse A, Gebhard PM, Roach HI. Osteoarthritis: pathobiology-targets and ways for therapeutic intervention. Adv Drug Deliv Rev. 2006;58(2):128–49. doi: 10.1016/j.addr.2006.01.020. [DOI] [PubMed] [Google Scholar]
- 2.Poole AR, Ionescu M, Swan A, Dieppe PA. Changes in cartilage metabolism in arthritis are reflected by altered serum and synovial fluid levels of the cartilage proteoglycan aggrecan. Implications for pathogenesis. J Clin Invest. 1994;94(1):25–33. doi: 10.1172/JCI117314. [DOI] [PMC free article] [PubMed] [Google Scholar]
- 3.Dragomir AD, Kraus VB, Renner JB, Luta G, Clark A, Vilim V, et al. Serum cartilage oligomeric matrix protein and clinical signs and symptoms of potential pre-radiographic hip and knee pathology. Osteoarthritis Cartilage. 2002;10(9):687–91. doi: 10.1053/joca.2002.0816. [DOI] [PubMed] [Google Scholar]
- 4.Lohmander LS, Ionescu M, Jugessur H, Poole AR. Changes in joint cartilage aggrecan after knee injury and in osteoarthritis. Arthritis Rheum. 1999;42(3):534–44. doi: 10.1002/1529-0131(199904)42:3<534::AID-ANR19>3.0.CO;2-J. [DOI] [PubMed] [Google Scholar]
- 5.Moskowitz RW. The biochemistry of osteoarthritis. Br J Rheumatol. 1984;23(3):170–2. doi: 10.1093/rheumatology/23.3.170. [DOI] [PubMed] [Google Scholar]
- 6.Peterfy CG, Guermazi A, Zaim S, Tirman PF, Miaux Y, White D, et al. Whole-Organ Magnetic Resonance Imaging Score (WORMS) of the knee in osteoarthritis. Osteoarthritis Cartilage. 2004;12(3):177–90. doi: 10.1016/j.joca.2003.11.003. [DOI] [PubMed] [Google Scholar]
- 7.Otterness IG, Swindell AC, Zimmerer RO, Poole AR, Ionescu M, Weiner E. An analysis of 14 molecular markers for monitoring osteoarthritis: segregation of the markers into clusters and distinguishing osteoarthritis at baseline. Osteoarthritis Cartilage. 2000;8(3):180–5. doi: 10.1053/joca.1999.0288. [DOI] [PubMed] [Google Scholar]
- 8.Meulenbelt I, Kloppenburg M, Kroon HM, Houwing-Duistermaat JJ, Garnero P, Hellio-Le Graverand MP, et al. Clusters of biochemical markers are associated with radiographic subtypes of osteoarthritis (OA) in subject with familial OA at multiple sites. The GARP study. Osteoarthritis Cartilage. 2006 doi: 10.1016/j.joca.2006.09.007. [DOI] [PubMed] [Google Scholar]
- 9.Garnero P, Mazieres B, Gueguen A, Abbal M, Berdah L, Lequesne M, et al. Cross-sectional association of 10 molecular markers of bone, cartilage, and synovium with disease activity and radiological joint damage in patients with hip osteoarthritis: the ECHODIAH cohort. J Rheumatol. 2005;32(4):697–703. [PubMed] [Google Scholar]
- 10.Kraus VB. Biomarkers in osteoarthritis. Curr Opin Rheumatol. 2005;17(5):641–6. doi: 10.1097/01.bor.0000174195.15421.17. [DOI] [PubMed] [Google Scholar]
- 11.Lohmander LS, Felson D. Can we identify a ‘high risk’ patient profile to determine who will experience rapid progression of osteoarthritis? Osteoarthritis Cartilage. 2004;12(Suppl A):S49–52. doi: 10.1016/j.joca.2003.09.004. [DOI] [PubMed] [Google Scholar]
- 12.Moskowitz RW, Hooper M. State-of-the-art disease-modifying osteoarthritis drugs. Curr Rheumatol Rep. 2005;7(1):15–21. doi: 10.1007/s11926-005-0004-0. [DOI] [PubMed] [Google Scholar]
- 13.Theiler R, Ghosh P, Brooks P. Clinical, biochemical and imaging methods of assessing osteoarthritis and clinical trials with agents claiming ‘chondromodulating’ activity. Osteoarthritis Cartilage. 1994;2(1):1–23. doi: 10.1016/s1063-4584(05)80002-0. [DOI] [PubMed] [Google Scholar]
- 14.Shock NW. The physiological basis of aging. New York: Human Sciences; 1985. [Google Scholar]
- 15.Hochberg MC, Lethbridge-Cejku M, Tobin JD. Bone mineral density and osteoarthritis: data from the Baltimore Longitudinal Study of Aging. Osteoarthritis Cartilage. 2004;12(Suppl A):S45–8. doi: 10.1016/j.joca.2003.09.008. [DOI] [PubMed] [Google Scholar]
- 16.Kellgren JH, L L. Atlas of Standard Radiographs of Arthritis. The Epidemiology of Chronic Rheumatism. 1963;II [Google Scholar]
- 17.Scott WW, Jr, Lethbridge-Cejku M, Reichle R, Wigley FM, Tobin JD, Hochberg MC. Reliability of grading scales for individual radiographic features of osteoarthritis of the knee. The Baltimore longitudinal study of aging atlas of knee osteoarthritis. Invest Radiol. 1993;28(6):497–501. [PubMed] [Google Scholar]
- 18.Kingsmore SF, Patel DD. Multiplexed protein profiling on antibody-based microarrays by rolling circle amplification. Curr Opin Biotechnol. 2003;14(1):74–81. doi: 10.1016/s0958-1669(02)00019-8. [DOI] [PubMed] [Google Scholar]
- 19.Shao W, Zhou Z, Laroche I, Lu H, Zong Q, Patel DD, et al. Optimization of Rolling-Circle Amplified Protein Microarrays for Multiplexed Protein Profiling. J Biomed Biotechnol. 2003;2003(5):299–307. doi: 10.1155/S1110724303209268. [DOI] [PMC free article] [PubMed] [Google Scholar]
- 20.Baslund B, Tvede N, Danneskiold-Samsoe B, Larsson P, Panayi G, Petersen J, et al. Targeting interleukin-15 in patients with rheumatoid arthritis: a proof-of-concept study. Arthritis Rheum. 2005;52(9):2686–92. doi: 10.1002/art.21249. [DOI] [PubMed] [Google Scholar]
- 21.Zhang H, Yu CY, Singer B, Xiong M. Recursive partitioning for tumor classification with gene expression microarray data. Proc Natl Acad Sci U S A. 2001;98(12):6730–5. doi: 10.1073/pnas.111153698. [DOI] [PMC free article] [PubMed] [Google Scholar]
- 22.Ohta S, Imai K, Yamashita K, Matsumoto T, Azumano I, Okada Y. Expression of matrix metalloproteinase 7 (matrilysin) in human osteoarthritic cartilage. Lab Invest. 1998;78(1):79–87. [PubMed] [Google Scholar]
- 23.Yoshihara Y, Nakamura H, Obata K, Yamada H, Hayakawa T, Fujikawa K, et al. Matrix metalloproteinases and tissue inhibitors of metalloproteinases in synovial fluids from patients with rheumatoid arthritis or osteoarthritis. Ann Rheum Dis. 2000;59(6):455–61. doi: 10.1136/ard.59.6.455. [DOI] [PMC free article] [PubMed] [Google Scholar]
- 24.Aigner T, Fundel K, Saas J, Gebhard PM, Haag J, Weiss T, et al. Large-scale gene expression profiling reveals major pathogenetic pathways of cartilage degeneration in osteoarthritis. Arthritis Rheum. 2006;54(11):3533–44. doi: 10.1002/art.22174. [DOI] [PubMed] [Google Scholar]
- 25.Charni N, Juillet F, Garnero P. Urinary type II collagen helical peptide (HELIX-II) as a new biochemical marker of cartilage degradation in patients with osteoarthritis and rheumatoid arthritis. Arthritis Rheum. 2005;52(4):1081–90. doi: 10.1002/art.20930. [DOI] [PubMed] [Google Scholar]
- 26.Christgau S, Garnero P, Fledelius C, Moniz C, Ensig M, Gineyts E, et al. Collagen type II C-telopeptide fragments as an index of cartilage degradation. Bone. 2001;29(3):209–15. doi: 10.1016/s8756-3282(01)00504-x. [DOI] [PubMed] [Google Scholar]