

Abstract
The identification and characterization of a priori unknown proteins from an Escherichia coli (E. coli) soluble protein lysate using ion trap collision-induced dissociation of intact protein ions followed by ion/ion reactions in a quadrupole/time-of-flight tandem mass spectrometer is illustrated. The procedure involved the submission of uninterpreted product ion spectra to a peak picking program and then to ProSightPTM for searching against an E. coli database. Examples are provided for the identification and characterization of both modified and unmodified unknown proteins with masses up to ∼28 kDa. The availability of protein intact mass along with sequence information makes possible the characterization of proteins with post translational modifications, such as disulfide linkages, as well as protein isoforms whose sequences are absent from a database, provided that a related form of the gene product is present in the database. This work demonstrates that the quadrupole/time-of-flight platform, in conjunction with ion-ion proton transfer reactions, can be adapted to obtain primary structure information from entire protein ions, rather than simply N- or C-terminal information from low mass-to-charge products, for proteins as large as several tens of kilodaltons.
Keywords: Top-down proteomics, ion trap CID, ion/ion reactions, quadrupole/time-of-flight, E. coli protein mixture
1. Introduction
Mass spectrometry has emerged as a rapid and sensitive technique for protein identification and characterization.1, 2 Initial success with protein identification was based on an approach referred to as “peptide mass fingerprinting”,3-5 which involved a single stage mass measurement of peptide components from enzymatically or chemically digested pure proteins or proteins in a simple mixture. As the complexity of the protein mixture increases, tandem mass spectrometry of the digested peptides is typically used to increase the specificity of the approach with database analysis of the product ion spectrum.6, 7 Both approaches are based on the digestion of proteins and are generally referred to as “bottom-up” approaches. To date, “bottom-up” proteomics has developed into a powerful approach for protein identification; variations thereof are widely used on a range of platforms. However, valuable information about a protein, such as its molecular weight and modification state, can be lost when the protein is subjected to complete digestion, which is a widely recognized disadvantage in the ‘bottom-up” approach.
With the advent of new ionization approaches, such as electrospray ionization (ESI),8, 9 as well as advances in mass spectrometry instrumentation, intact proteins can be interrogated directly by mass spectrometry without resort to digestion. As a result, intact protein mass information can be readily obtained from various platforms, including mass spectrometers of moderate mass-to-charge upper limits due to the multiple charging phenomenon associated with ESI. The derivation of structural information from a whole protein ion, however, is more challenging than the measurement of its mass due to challenges associated with dissociation of the protein ions and the interpretation of the product ion spectra. Nevertheless, various approaches have been developed for the tandem mass spectrometry of intact protein ions. Strategies based on whole protein tandem mass spectrometry form the basis of “top-down” proteomics,10-12 the utility of which for protein identification/characterization is increasingly recognized, particularly for the characterization of protein post-translational modifications.13
In a typical “top-down” approach, protein identification is generally made via a database search of a protein database or a translated genomic database, in which an experimental product ion spectrum from dissociation of a whole protein is compared with a predicted spectrum derived from in silico dissociation of database candidate proteins, whose molecular weights are within a specified mass window of the unknown protein to be identified. The candidate protein is then ranked based on an algorithm-assigned score that depends primarily on the number of matched peaks.14, 15 The confidence level for a proposed identification via database search is affected by many factors and is heavily dependent on the information that can be drawn from a product ion spectrum. The quality of the structural information in a product ion mass spectrum is largely defined by factors such as the mass measurement accuracy of the instrument, signal-to-noise ratio (S/N) of the products in the spectrum, etc., while the quantity of the information depends both on the amount of potential information that can be initially produced in a tandem mass spectrometry experiment (typically a dissociation experiment) as well as the fraction of the total amount of information that can be extracted from such an experiment. For a polypeptide ion, for example, the quantity of information might be measured by the fraction of inter-residue cleavages observed.
The amount of structural information that can be produced in a tandem mass spectrometry experiment is determined largely by factors like the forms of the protein precursor ions (e.g. positive vs. negative, open shell vs. closed shell, protonated vs. metal cationized, etc.) and the dissociation method employed. Compared to the fragmentation of peptides, dissociation of intact proteins of large size (e.g., >200 kDa) is much more challenging.16 To date, for proteins in the tens of kilodaltons range, a variety of approaches has been used for intact protein ion dissociation that are based on either ion/electron interaction, such as electron capture dissociation (ECD)17 and electron transfer dissociation (ETD),18, 19 ion/photon interaction, such as infra-red multiple photon dissociation (IRMPD),20, 21 or ion/neutral interaction, such as ion trap collisional-induced dissociation (CID)22 and collision-induced dissociation by sustained off-resonance irradiation (SORI CID).23
Relative to the “bottom-up” approach, it is also more difficult to extract sequence information from dissociation of a whole protein ion due to the challenges in the charge state assignment of large fragment ions and the potentially severe peak overlap in the spectrum from ions of different mass but similar mass-to-charge ratio. The percentage of mass information that can be extracted from an MS/MS experiment is largely determined by the informing power24 of the approach employed, which is reflected by its ability to address the charge state ambiguity associated with a highly charged large fragment ion as well as its capability to deal with peak overlap in a spectrum. With the high resolving powers of the Fourier transform ion cyclotron resonance (FTICR) mass spectrometer and Oribtrap™,25, 26 assignment of product ion charge state can be facilitated by measuring the spacing between the isotopic peaks,27 which has greatly facilitated the exploration of whole protein tandem mass spectrometry.28 It is also noteworthy that a quadrupole/TOF platform, with its moderate resolving power, has been reported for “top-down” protein identification from a database search based on peptide sequence tags identified from the spectrum.29 However, identification of a sequence tag from a tandem mass spectrum is not always guaranteed on such a platform and full characterization of the protein is precluded by overlap of high mass and high charge products. The problems of peak overlap and charge state ambiguity can be alleviated to some extent in top-down analysis of intact proteins using MALDI TOF-TOF platforms in which singly charged precursor ions are examined.30, 31 However, the extent of sequence information available from the dissociation of large singly charged polypeptides can be limited. Alternative approaches to obtain product ion mass information without resorting to ultra-high resolving power have employed charge manipulation strategies such as ion/ion reactions to remove the charge state ambiguity by charge reducing the product ions to largely singly charged ions.32 Additional advantages from the use of ion/ion charge reduction include a reduction of peak overlap in the post-ion/ion CID spectrum by distributing the overlapped peaks over a wider mass space. A recent study24 showed that the informing power of an electrospray-based tandem mass spectrometry approach for protein mixture analysis can be significantly improved when coupled with ion/ion reactions for charge state manipulation, particularly when mass analyzers of low to moderate resolving powers are used, such as with ion traps and time-of-flight, respectively. Consistent with this result, identification of a priori unknown proteins has been successfully demonstrated on 3D ion traps coupled with ion/ion reactions.33-35 Moreover, successful “top-down” protein identification has been demonstrated via database search of low mass product ions from a linear ion trap coupled with ion/ion reactions for both protein dissociation (i.e. ETD) and product ion charge reduction (i.e. proton transfer reactions).36, 37 However, the limited mass range (<∼ m/z 2000) associated with such a platform imposed a limitation on the derivation of the sequence information from the internal region of a large protein. A QqTOF platform, with a much larger mass range and higher resolving power relative to a 3D or linear ion trap, coupled with ion/ion reactions has been predicted to provide informing power comparable to that obtained from very high resolution approaches that do not employ charge state manipulation, such as those based on Orbitrap™ and FTICR MS.24 This suggests that ion/ion reactions can enhance the utility of the QqTOF platform for top-down proteomics. In this work, we apply a QqTOF approach coupled with ion/ion reactions to the identification and characterization of components of protein mixtures derived from Escherichia coli protein lysates. The results serve to illustrate that the predicted improvements in informing power are largely realized and that a QqTOF instrument of moderate mass resolving power and mass measurement accuracy is capable of confident identification and characterization of intact protein ions of several tens of kilodaltons in mass.
2. Experimental Section
Material
Methanol and glacial acetic acid were purchased from Mallinckrodt (Phillipsburg, NJ). Perfluoro-1-octanol (PFO) was obtained from Sigma-Aldrich (Milwaukee, WI). Difco nutrient broth and bacto-agar were purchased from BD (Franklin Lakes, NJ), while Bacterial protease inhibitor cocktail was purchased from Sigma-Aldrich (St. Louis, MO).
Growth and Lysis of E. coli
E. coli ATCC 15224 was obtained from the American Type Culture Collection (Rockville, MD). The freeze-dried E. coli was reactivated in nutrient broth at 37 °C under aerobic growth conditions. The E. coli cells were harvested during stationary phase by centrifugation at 3000g for 10 min. About 4g of the pellets were resuspended in 10 mL of water with 1mL of protease inhibitor cocktail and then were subjected to French press under 700 psi. The lysate was then centrifuged at 16000g for 20 min, and the resulted supernatants were stored at -70 °C.
Fractionation of Proteins from the Soluble E. coli Whole Cell Lysate by RP-HPLC
The supernatant was fractionated by reverse-phase HPLC on an Agilent 1100 series with a C4 column (Vydac, 4.6 × 100 mm). A linear 60-min gradient from 0 to 100% buffer B was used (buffer A: 0.1% aqueous TFA and buffer B: 60% acetonitrile/40% H2O containing 0.09% TFA). The column temperature was set at 40 °C. The absorbance was monitored at 215 nm. The fraction collected was lyophilized to dryness and then dissolved in 49:49:2 methanol/water/acetic acid solution for nano-ESI.
Mass Spectrometer
All experiments were performed on a quadrupole/TOF (Q-STAR XL, Applied BioSystems/MDS Sciex, Concord, ON, Canada) modified for ion/ion reactions.38 A home-built pulsed dual ion source39 was coupled directly to the interface of the Q-STAR instrument for the generation of ions of both polarities, which consists of two nano-ESI emitters, one for the generation of protein cations and the other for the production of reagent PFO anions. Ion/ion proton transfer reactions were implemented in the Q2 quadrupole linear ion trap (LIT) in mutual storage mode,40 in which ions of opposite polarity were stored simultaneously by superposing an auxiliary radio frequency signal (rf) (250 kHz, 500 Vpp) on the end lenses (IQ2 and IQ3) to store ions in the axial direction, while the normal operation of the oscillating quadrupole field of the Q2 quadrupole array stored ions of both polarities in the radial plane. All electronics are controlled by Daetalyst 3.14, a version of research software developed by MDS Sciex.
A typical scan function in the ion/ion reaction of product ions derived from the ion trap CID consists of the following steps: protein ion injection and isolation (100 ms), ion trap CID of the isolated ions (200 ms), anion injection and isolation (100 ms), mutual storage mode ion/ion reaction (300 ms), and mass analysis by TOF (50 ms). Specifically, a positive high voltage (∼+1.5 kV) applied to one of the emitters was initially pulsed on to generate protein cations, which were sampled and transferred into the Q2 linear ion trap (LIT) with Q1 operated in mass resolving mode to isolate the charge state of interest. Protein ions were cooled in the Q2 LIT for a short time (30 ms) with nitrogen as buffer gas at a pressure of ∼ 8 mTorr, during which time the positive high voltage was turned off. After the cation cooling step, an auxiliary dipolar AC signal corresponding to the secular frequency of the isolated ions was applied to one pair of the Q2 rods to induce ion trap CID. The product ions were cooled in the Q2 LIT for 30 ms, after which time the negative high voltage was turned on to generate the PFO reagent anions, which were subsequently introduced into the Q2 LIT with relatively low kinetic energies (∼ 8 eV) with Q1 operated in mass resolving mode to isolate the singly charged PFO dimer reagent anions (i.e., [(PFO)2-H]-) for the subsequent ion/ion reaction. During this period, the DC potentials on the IQ2 and IQ3 lenses were adjusted to a common value and set ∼ 0.5 V more positive relative to the Q2 DC offset while an auxiliary rf voltage (250 kHz, 500 Vpp) was applied to the IQ3 lens. During the subsequent mutual storage step, the negative high voltage was turned off and a common DC offset potential was set for both the Q2 rods and the Q2 containment lenses. An auxiliary rf voltage was also applied to the IQ2 and IQ3 lenses to enable the axial trapping of both polarities. After a specified mutual storage time, a positive DC potential was applied to the containment lenses to remove the residual reagent anions while the auxiliary rf voltage was terminated. In the final step, the positive ions consisting of the ion/ion reaction products and the unreacted precursor ions were released from Q2 LIT to the orthogonal reflectron TOF for mass analysis.
Database Search
ProSight PTM Retriever41, 42 was used in its absolute mass search mode as a “top-down” database search engine searching against the annotated SWISS-PROT E. coli K12 strain database. Input data to the search engine were a product ion list selected using the Origin 6.0 program from the post-ion/ion CID spectrum. Instead of a S/N criterion, Origin 6.0 uses a search rectangle to find a peak and a minimum height percentage value to eliminate noise from consideration. The typical search rectangle set for the current study is one with a width of 0.3 and length of 0.3, and the minimum height percentage value of 3. The product ions selected were searched as average masses against the protein database with an intact protein mass window of 2,000 Da and product ion mass tolerance of 1.5 Da.
3. Results and Discussion
Tandem Mass Spectrometry of Unknown Proteins from a Whole Cell E. coli Lysate Fraction
A simple LC separation was employed to reduce the complexity of the protein mixture in the supernatant of the E. coli whole cell lysate after centrifugation. The acquired chromatogram is shown in Figure 1, in which the four labeled peaks correspond to fractions selected for study. No attempt was made to examine each fraction. The fractions examined were chosen more-or-less randomly with the provision that at least one abundant protein greater in mass than 9 kDa was present. In all of the examples described herein, the protein subjected to characterization was a major component in the mass spectrum. One of the most abundant charge states of the protein was selected for tandem mass spectrometry. All proteins that met these criteria (i.e., mass greater than 9 kDa that yielded strong signals) provided sufficient information for protein characterization. However, in most of the fractions, the signals were dominated by species of mass lower than about 5 kDa. It is generally straightforward to perform tandem mass spectrometry on these low mass species without recourse to ion/ion reactions and they were therefore not targeted in this work. There were also many low levels signals for larger proteins but these species proved not to provide sufficient product ion signal for protein characterization. In the absence of further purification to isolate abundant low mass polypeptides from the mixtures, which tended to consume much of the charge in the mass spectrum, the fraction of proteins of mass greater than 9 kDa that can be characterized under the conditions used in this work is expected to be low. However, no attempt was made here to take measures either to improve the dynamic range or to determine the fraction of proteins in the entire protein lysate that can be characterized. This is an important area for emphasis in future work. The electrospray mass spectrum of the fraction at a retention time of 38.26 min., labeled as #1 in Fig. 1, is shown in Figure 2(a), in which one major component was apparent with a charge state distribution corresponding to +15-+10 ions and a molecular weight of 9534.25 Da. A charge state of relatively high abundance was arbitrarily selected, isolated, and subjected to ion trap CID. The CID spectrum derived from the +12 charge state of this unknown protein is shown in Figure 2(b) by use of a dipolar excitation frequency of 164.6 kHz with a voltage amplitude of 470 mVpp for 200 ms.
Figure 1.
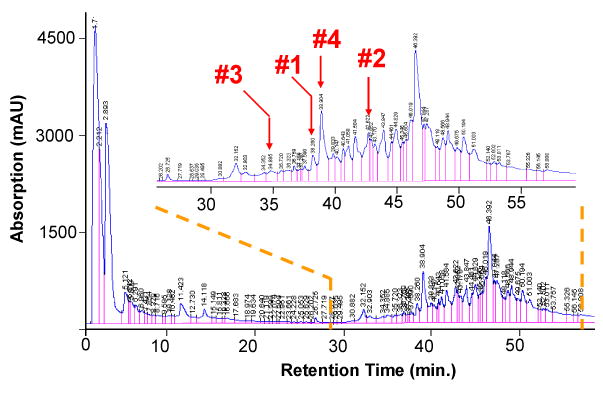
RP-HPLC fractionation of the soluble proteins from the supernatant of the whole cell E. coli lysate. The labeled peaks correspond to the fractions containing unknown proteins discussed in this study.
Figure 2.

Spectra derived from (a) ESI of the LC fraction labeled as #1 in Figure 1, and (b) ion trap CID of protein ions with m/z 795.5 shown in (a) (frequency: 164.6 kHz, amplitude: 470 mV ).
The resolving power of the TOF analyzer (∼8000 M/ΔMFWHM) allows confident charge state assignment of most of the ions in the low m/z region of the CID spectrum by measuring the spacing between the isotope peaks of a product ion. However, charge state assignment in the high m/z region was complicated by the overlap of peaks, as evident by the clustering of products around the precursor ion shown in Figure 2(b). Therefore, CID products shown in Figure 2(b) were subjected to ion/ion proton transfer reactions to simplify the CID spectrum. The post-ion/ion CID spectrum is shown in Figure 3, in which the majority of the product ions are reduced to singly and doubly charged ions, as indicated by the predominant +2 and +1 residual precursor ions in the spectrum. All the product ions with m/z values falling above the residual doubly charged precursor ion must be singly charged ions; therefore, the doubly charged version of these product ions can be readily identified on the basis of their m/z values and abundances relative to the residual doubly charged precursor ions, because the intensity ratio of such a doubly charged product ion relative to the residual doubly charged precursor ion is close to the intensity ratio of the singly charged version of that product over the residual singly charged precursor ion. However, no attempt was made to identify the doubly charged ions in the post-ion/ion spectrum. Rather, all the peaks in the post-ion/ion spectrum were subjected to a peak picking process using Origin 6.0 and the masses derived therefrom were based on the assumption that all ions were singly protonated. The selected peaks are labeled with red crosses in Figure 3. The automatically selected product ions with m/z less than that of the singly charged precursor ion were subjected to database searches for protein identification. While it is possible to correct for the doubly charged ions, we chose to evaluate how well the overall approach works when there is essentially no post-processing of the raw product ion spectrum. A similar procedure as described above was applied to other E. coli LC fractions of interest to provide protein intact mass and CID product ion mass information for ProSightPTM database search. In cases in which the protein mixture was significantly more complex than that of Figure 1(a), the protein ion mixture was first subjected to ion/ion proton transfer reactions to determine the masses of the protein components in the mixture. This information was used to determine which peaks to select from the pre-ion/ion protein mixture spectrum for tandem mass spectrometry.
Figure 3.
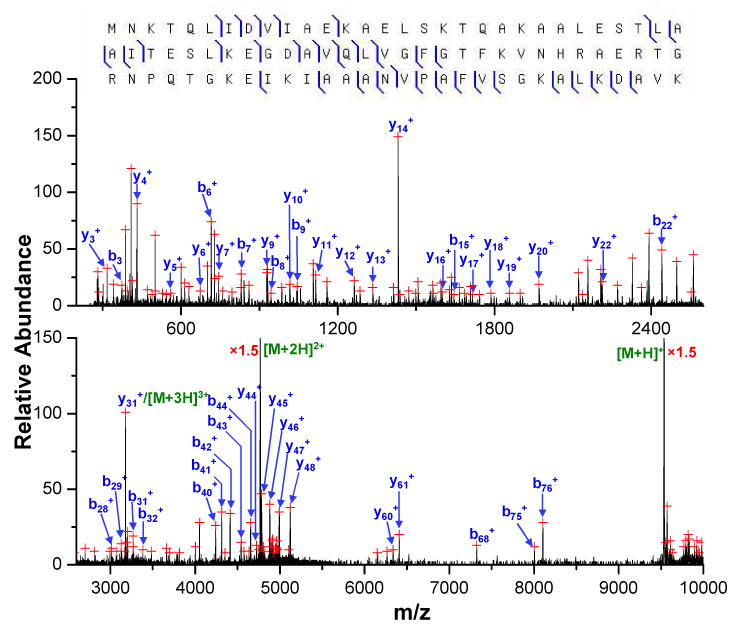
Post-ion/ion reaction MS/MS spectrum derived from the [M+12H]12+ ion, m/z 795.5, of the unknown protein in fraction #1 followed by ion/ion reactions with the PFO dimer anion. (Peaks are labeled based on the matches of the protein DBHA_ECOLIm identified from ProSightPTM database search.)
Protein Identification by Database Search of Un-interpreted Whole Protein MS/MS Spectra
In a typical “top-down” database search, candidate proteins selected from a database are fragmented in silico to generate a series of theoretical product ions, which are compared to the experimental product ion masses to determine the number of matched ions, from which a search score is assigned.14 Either the monoisotopic mass or the average mass, but not a combination of both, is normally used in such a mass comparison process in most search algorithms, including ProSightPTM. However, the product ion mass selected by the Origin program from the post-ion/ion spectrum collected using the current approach is a mixture of monoisotopic and average masses, i.e. monoisotopic masses for the low mass resolvable ions and average masses for high mass ions whose isotopes are unresolved, because the Origin program tends to select peaks with the highest abundance within a specified search rectangle. To accommodate this feature of the product ion mass data, experimental product ion masses selected by Origin program were searched in ProSighPTM as average masses with a relatively large product ion mass tolerance of 1.5 Da. An intact protein ion mass window of 2000 Da was also used in the search to accommodate a large range of possible PTMs on the protein.
Proteins without post-translational modification
The ProSightPTM database search of the major unknown protein component in the soluble whole cell E. coli lysate HPLC fraction #1 resulted in 1412 candidate proteins within the 2000 Da mass window of the unknown protein. Of this group, 1406 had at least one b-/y-type product ion matching one of the 116 experimental product ions selected by the Origin program from the post-ion/ion spectrum in Figure 3. All candidate proteins were ranked by probability score14 (viz., lowest scores are most highly ranked) and the three top ranked proteins are listed in Table 1, in which the highest ranked protein is DBHA_ECOLIm with a MW of 9535.0 Da. This top ranked protein has a total match of 44 ions (19 b-ions and 25 y-ions) with a probability score of 1.17×10⁻¹⁹. The second highest ranked protein is DBHA_ECOLI, which has the same sequence as the top ranked protein except for the absence of the N-terminal methionine residue. The DBHA_ECOLI entry has a total match of 26 ions with a probability score of 3.49×10⁻⁶ and the third highest ranked protein matched only 17 ions with an assigned probability score of 0.266. With a good match to the measured protein mass (mass difference of 0.78 Da) and such a small value for the probability score, it is very unlikely that the top ranked DBHA_ECOLIm protein is a random match. The peaks in the post-ion/ion product ion spectrum shown in Figure 3 were assigned according to the sequence of DBHA_ECOLIm with a summary of the fragmentation shown in the upper panel, which represents cleavage of 38.2% of the amide bonds. It is noteworthy that matches of b-type ions from the candidate protein DBHA_ECOLI are unexpected because the absence of an N-terminal methionine residue relative to the top-ranked protein DBHA_ECOLIm shifts all its b-ion masses by a constant value equal to the mass of the methionine residue. Therefore, the match of a b-type ion for DBHA_ECOLI most likely comes from a random match of a noise peak. A close examination of this match reveals that the matched b4 ion with neutral mass of 471.500 Da is 0.708 Da smaller than the observed mass, which corresponds to a 1499.3 ppm mass difference, which is much larger than the routine mass accuracy of ∼ 30 ppm obtained with this TOF using external calibration. This result indicates that the potential performance of the current platform was not fully exploited by the employment of a relatively large product ion mass tolerance of 1.5 Da to accommodate the limitations associated with the ProSightPTM search with only monoisotopic or average masses. It can be envisioned that if the monoisotopic mass information available for the low mass ions can be exploited in a mixed search with both monoisotopic and average product ion masses, random matches would significantly decrease, which can improve the specificity of the current approach.
Table 1.
Summary of the ProSightPTM Database Search Results for Proteins from the Soluble Whole Cell Lysate HPLC Fraction of E. coli. (Candidate proteins are ranked based on the probability scores)
| Unknown Protein and MW | Top Ranked Candidate Proteins | ||||||
|---|---|---|---|---|---|---|---|
| Protein Name | MW (Da) | Mass Difference (Da) | b-ions | y-ions | Total ions | Probability Score | |
| #1 (9534.25 Da) |
DBHA_ECOLIm | 9535.0 | -0.78 | 19 | 25 | 44 | 1.17e-19 |
| DBHA_ECOLI | 9403.8 | 130.42 | 1 | 25 | 26 | 3.49e-6 | |
| YUAZ_ECOLI | 9632.33 | -98.11 | 7 | 10 | 17 | 2.66e-1 | |
|
| |||||||
| #2 (15407.9 Da) |
HNS_ECOLI | 15408.5 | -0.59 | 32 | 29 | 61 | 1.29e-28 |
| HNS_ECOLIm | 15539.7 | -131.789 | 4 | 29 | 33 | 1.09e-7 | |
| PAL_ECOLIc | 16747.6 | -1339.69 | 7 | 12 | 19 | 9.41e-1 | |
|
| |||||||
| #3 (9738.49 Da) |
HDEA_ECOLIc | 9740.93 | -2.44 | 5 | 7 | 12 | 1.11e-2 |
| HDEA_ECOLIcm | 9872.13 | -133.64 | 2 | 7 | 9 | 1.02 | |
| MINE_ECOLI | 10103.7 | -365.24 | 6 | 2 | 8 | 3.77 | |
|
| |||||||
| #4 (28462.14 Da) |
RBSB_ECOLIc | 28474.5 | -12.37 | 13 | 21 | 34 | 7.49e-12 |
| RBSB_ECOLIcm | 28605.7 | -143.57 | 2 | 21 | 23 | 1.77e-4 | |
| THIM_ECOLI | 27339.3 | 1122.88 | 10 | 5 | 15 | 1.7 | |
The previous case illustrated the situation in which the N-terminal initiating methionine residue is retained. An example of the opposite situation is briefly described below. The procedure just described was performed with the major protein component in the LC fraction No. 2, which has a measured MW of 15407.9 Da. The post-ion/ion CID spectrum of this unknown protein is shown in Figure 4 with peaks selected by the Origin program for database search indicated with red crosses. The ProSightPTM database search resulted in a top ranked protein, HNS_ECOLI, which is 0.59 Da higher than the experimentally measured mass. This protein matched a total of 61 product ions in the spectrum with 32 b- ions and 29 y- ions, yielding a probability score of 1.29×10⁻²⁸, while the proteins ranked second and third showed much fewer matches relative to the top ranked protein with probability scores of 1.09×10⁻⁷ and 0.941, respectively. The second ranked protein, which shows a moderately good score, is related to the top ranked protein in that it has the same sequence with the lone exception that it contains the N-terminal methionine residue. Based on the identification made here, the product ions were assigned and the fragmentation pattern of this protein is summarized in the upper panel of Figure 4. For the selected charge state, evidence for cleavage of roughly 33.3% of the amide bonds were cleaved via ion trap CID.
Figure 4.
Post-ion/ion MS/MS spectrum derived from ion trap CID of the [M+15H]15+ ion of the unknown protein in fraction #2 followed by ion/ion reactions with the anions of PFO dimer. (Peaks are labeled based on the matches of the protein HNS_ECOLI identified from ProSightPTM database search.)
Identification of Proteins with Post-translational Modifications or Absent from the Database
One of the major causes for errors in protein identification arises from incompleteness of a database. That is, they do not contain all of the possible mature gene products, including those with PTMs, mutations, etc., that may be present in the sample. However, it is often possible to characterize a protein even when it is not in the database and this is greatly facilitated if a closely related protein happens to be in the database. Several examples of situations of this type are presented that illustrate the capabilities of this approach.
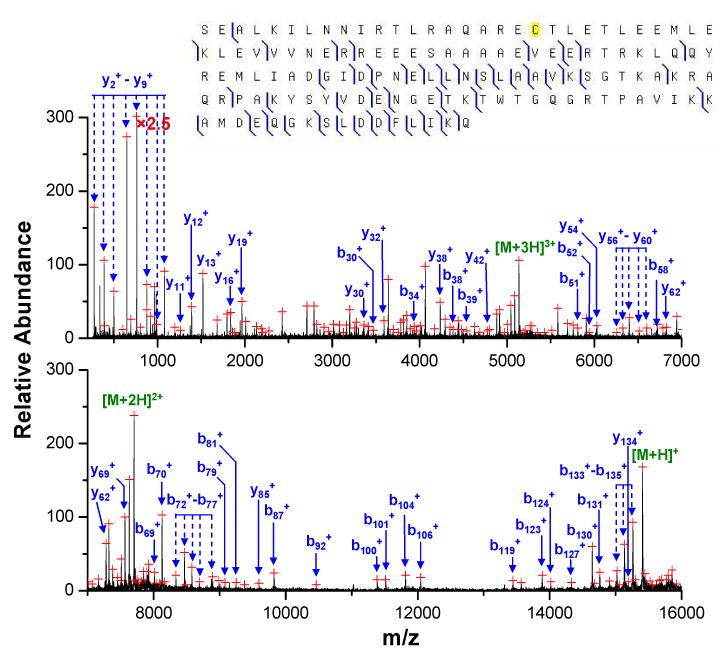
The first example involves the database search of the major unknown protein component in the E. coli LC fraction #3, the post ion/ion CID spectrum of which is shown in Figure 5. Compared to the post-ion/ion CID spectrum of the protein of similar intact mass (Figure 3), this protein, with a measured intact mass of 9738.49 Da, shows significantly fewer product ions upon collisional activation. The ProSightPTM database search of the post-ion/ion CID spectrum results in a best candidate protein HDEA_ECOLIc with a probability score of 0.0111, which is slightly better than the commonly accepted score of 0.05 for positive identification at a confidence level of 95%. The proteins ranked second and third, i.e. HDEA_ECOLIcm and MINE_ECOLI, respectively, have a probability score larger than 0.05 and are most likely random matches. Although the probability score of 0.0111 for the top-ranked protein is below the commonly used significance level, the mass difference of 2.44 Da (∼ 250 ppm) between the measured mass and the predicted mass from HDEA_ECOLIcm is much larger than the mass accuracy of the current platform. Therefore, while the protein under investigation may be related to the top-ranked protein in the search, it is clearly not the entity in the database. A close examination of the post-ion/ion spectrum reveals that the top-ranked protein matches only the peaks in the low mass region of the spectrum, which are labeled in blue in Figure 5, with the exception of one peak of low abundance in the high mass region matching the b87+ ion of HDEA_ECOLIc. With matches of only low mass product ions, the discrepancy between the spectrum and the best candidate protein suggests a possible PTM in the middle of the protein. The most common protein PTM giving a mass deficiency of 2.44 Da relative to the unmodified version is the formation of a disulfide linkage within the protein molecule, which can occur in HDEA_ECOLIc between Cysteine 18 and Cysteine 66. When the formation of a disulfide bond between these two cysteine residues is considered, most of the abundant peaks in the high mass region can be successfully identified and are labeled in green in Figure 5. With the additional matches, a much better probability score of 1.85×10⁻⁵ was obtained. Except for the three charge reduced precursor ions, the three most abundant peaks in the high mass region of the post-ion/ion spectrum correspond to the singly, doubly and triply charged fragment ions of y81, which is the complementary ion of b8+, the most abundant product ion in the spectrum. The b8/y81 complementary pair arises from cleavage C-terminal to an aspartic acid residue, a favorable channel commonly observed in collisional activation of protein cations of relatively low charge states. The existence of a disulfide bond is also consistent with the fact that no cleavage was observed in the region between Cysteine 18 and Cysteine 66, which is a common phenomenon for proteins with disulfide linkages43. Moreover, the formation of a disulfide bond in the protein is also supported by the ESI spectrum of the protein (data not shown) that gave a charge distribution of only three low charge states of +9, +8, and +7, a result that may very well reflect a relatively compact conformation of the protein due to the existence of a disulfide linkage in the molecule. Collectively, this evidence suggests that a disulfide-linked version of HDEA_ECOLIc has been identified in the E. coli sample.
Figure 5.
Post-ion/ion MS/MS spectrum derived from ion trap CID of the [M+8H]8+ ion of an unknown protein of mass 9738.49 Da in fraction #3 followed by ion/ion reactions with the anions of PFO dimer. A zoomed region is shown in the inset. (Peaks are labeled based on the sequence of the protein HDEA_ECOLIc. Product ions labeled in blue are identified from ProSightPTM database search, while ions labeled in green are identified when disulfide linkage is considered.)
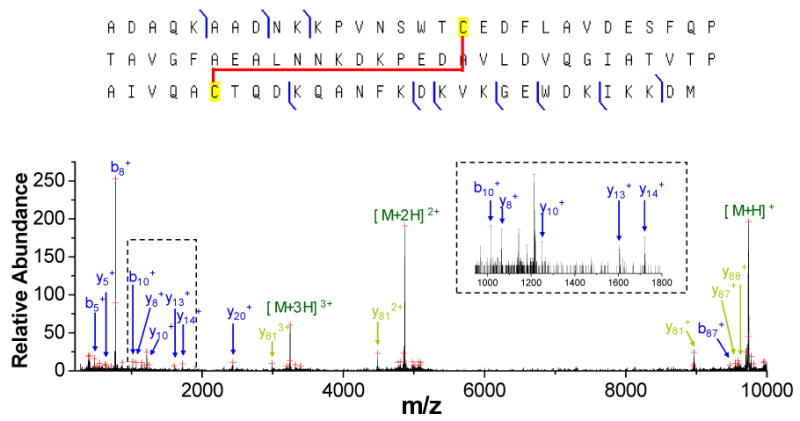
Another case in which the observed protein was not present in the database is illustrated by the major protein component in the LC fraction #4, which has a measured MW of 28462.14 Da. The post-ion/ion CID spectrum of its most abundant charge state, [M+31H]31+, is shown in Figure 6. A ProSightPTM database search of this spectrum gave a top-ranked protein of RBSB_ECOLIc with a probability score of 7.49×10⁻¹². The protein ranked second, RBSB_ECOLIcm, shares the same sequence with the top-ranked protein except for the absence of the N-terminal methionine residue and was assigned a probability score of 1.77×10⁻⁴. The protein THIM_ECOLI was ranked third with a probability score of 1.7, which is most likely a random match to the spectrum.
Figure 6.
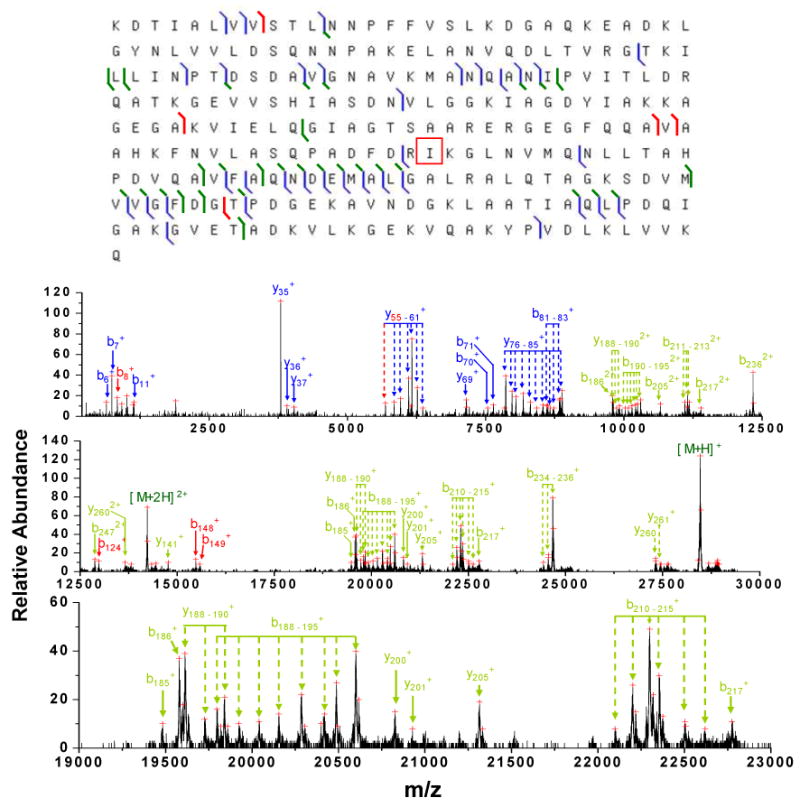
Post-ion/ion MS/MS spectrum derived from ion trap CID of the [M+31H]31+ (m/z = 919.13) ion of an unknown protein in fraction #4 followed by ion/ion reactions with the anions of PFO dimer. The bottom panel shows the zoomed mass region of m/z 19000 – 23000. (Peaks are labeled based on the sequence of the protein RBSB_ECOLIc with a substitute of isoleucine 167 by threonine, which is indicated by the red box in the top panel showing the fragmentation pattern. Product ions labeled in blue are identified directly from ProSightPTM database search, while ions labeled in green are identified when the amino acid substitute is considered. The peaks labled in red are those missed by the algorithm.)
The top-ranked protein, RBSB_ECOLIcm, gave 34 matches (13 b-type ions and 23 y-type ions) to the total 123 peaks selected by Origin program from the post-ion/ion spectrum shown in Figure 6. However, 31 out of the 34 ions matched only the low mass ion peaks in the spectrum, which are labeled in blue in the spectrum. The three matches to high mass ions (b262+, y214+, y191+) were peaks of very low abundances, which are not labeled in the spectrum. Although the top-ranked protein has an excellent probability score, it has an intact mass 12.37 Da (∼435 ppm) higher than the experimentally measured mass. This large mass discrepancy between the measured mass and the predicted mass indicates that RBSB_ECOLIc is not a correct assignment, although it is likely to be related to the unknown protein. The dominant matches of the low mass b- and y-type ions of RBSB_ECOLIc strongly suggest that the protein in the sample shares much of the same sequence with RBSB_ECOLIc in both N- and C- terminals but not in the middle region, where the 12.37 Da mass discrepancy originates. Such a difference in mass cannot be accounted for by the presence of multiple di-sulfide linkages because there are no cysteine residues in the sequence.
One way to account for such a mass discrepancy could come from a substitution of some amino acid residues in the middle region of the RBSB_ECOLIc sequence. To test this hypothesis, a sequence similarity search of protein RBSB_ECOLIc was performed using protein BLAST44 to identify any RBSB_ECOLIc protein isoforms containing amino acid changes giving such a mass deficit. The results showed that RBSB_ECOLIc shares the same sequence with 19 protein isoforms with removed signal peptides except for residue isoleucine 167, which is threonine 167 in these isoforms. The mass difference (12.037 Da) between threonine and isoleucine can account for the 12.37 Da mass difference observed between the measured mass and the mass for RBSB_ECOLIc. The 19 protein isoforms include a D-ribose periplasmic binding protein [rbsB] from E. coli O157:H7, i.e. Q8XAW6_ECO57, as well as another 18 proteins from E. coli strains other than K12. When the post ion/ion spectrum shown in Figure 6 was interpreted based on the sequence of Q8XAW6_ECO57 without the signal peptide sequence, the majority of the abundant peaks in Figure 6 can be identified that gave a total of 36 b-ions and 30 y-ions, with the new identifications being labeled in green. Twenty-one complementary b-/y-pairs were identified from the 36 b-ions and 30 y-ions (top panel in Figure 6). As a result, an excellent probability score of 2.8×10⁻³¹ was obtained when the 66 b-/y-ion identifications were considered. It is noteworthy that the identified peaks labeled in red in Figure 6 are those missed in the ProSightPTM identification because the mass determined by Origin is beyond the mass tolerance window of 1.5 Da due to the irregularity of the peak shape. From the above discussion, it is clear that the protein in the sample is not included in the E. coli K12 database used by ProSightPTM; however, with the assistance of a BLAST sequence similarity search, the high informing power and high mass accuracy of the current platform allows confident identification of the correct protein which has lost its signal peptide and also has a substituted amino acid residue relative to the top ranked protein RBSB_ECOLIc identified directly from the ProSightPTM database search.
4. Conclusions
With a simple LC separation of an E. coli lysate soluble protein mixture, unknown protein identification with high confidence was demonstrated on a quadrupole/TOF platform with ion/ion reaction capabilities. The high informing power of the current platform allows sequence information to be derived from entire proteins with molecular weights up to at least 28 kDa in a tandem mass spectrometry experiment by removing the product ion charge state ambiguity and reducing the peak overlap via ion/ion reactions. The specificity provided by the large amount of sequence information is high enough to allow confident identification of unknown proteins even with a relatively large product ion mass tolerance that was made necessary by the current version of the ProSightPTM search engine in the handling of mixed data of both monoisotopic masses and average mass. It can be envisioned that when the high mass accuracy associated with the monoisotopic mass in the low mass region can be exploited in the database search, an even higher specificity can be achieved from the current approach. Although the use of the Origin program for peak picking can compromise the overall performance of the approach, as just mentioned, it is desirable to have an automated means for picking the peaks for subsequent database searching. The high mass accuracy achieved from the current approach with large intact proteins allows facile determination of the existence of an unknown protein with PTMs or a protein absent from the searched database. When this accurate intact mass information is linked with protein sequence information, it is possible to identify and localize protein PTMs, such as disulfide linkages, as well as to identify proteins whose primary structures are slightly different from those of proteins in the database.
This work represents a significant improvement in top-down protein characterization using a quadrupole/TOF platform. Further improvements can be readily envisioned by adapting the search algorithm to accept both monoisotopic and average masses. Furthermore, several other means for ion manipulation may improve the specificity and overall utility of the approach. These include the use of beam-type collisional activation to access higher dissociation rate processes45, the use of electron transfer dissociation to provide complementary structural information46, 47, the use of ion parking techniques for parent ion charge state concentration and purification31, 38, 48, and the use of de-convolution algorithms to convert product spectra to zero-charge spectra. All of these measures are currently under development and evaluation for unknown protein characterization on the quadrupole/TOF platform and promise to improve further the capabilities of this type of instrument for top-down protein analysis. In addition to improvements in specificity, key areas for improvement in whole protein mixture analysis in general include matrix effects upon ionization and dynamic range. Future work will also be directed to addressing these issues.
Acknowledgments
This work was supported by the National Institute of General Medical Sciences under Grant GM 45372. The authors acknowledge Dr. Frank Londry, Dr. Bruce Thomson, Dr. Jim Hager, and Dr. Mahmoud Risheri of MDS SCIEX for help with the instrumentation and Dr.Min Yang of MDS SCIEX for providing custom instrument control software. The authors also acknowledge the Kelleher group in the University of Illinois at Urbana-Champaign for the access to the ProSightPTM program.
References
- 1.Yates JR. J Mass Spectrom. 1998;33:1–19. doi: 10.1002/(SICI)1096-9888(199801)33:1<1::AID-JMS624>3.0.CO;2-9. [DOI] [PubMed] [Google Scholar]
- 2.Peng JM, Gygi SP. J Mass Spectrom. 2001;36:1083–1091. doi: 10.1002/jms.229. [DOI] [PubMed] [Google Scholar]
- 3.Yates JR, Speicher S, Griffin PR, Hunkapiller T. Anal Biochem. 1993;214:397–408. doi: 10.1006/abio.1993.1514. [DOI] [PubMed] [Google Scholar]
- 4.Mann M, Hojrup P, Roepstorff P. Method Enzymol. 1993;22:338–345. doi: 10.1002/bms.1200220605. [DOI] [PubMed] [Google Scholar]
- 5.Pappin DJC, Hojrup P, Bleasby AJ. Curr Biol. 1993;3:327–332. doi: 10.1016/0960-9822(93)90195-t. [DOI] [PubMed] [Google Scholar]
- 6.Mann M, Wilm M. Anal Chem. 1994;66:4390–4399. doi: 10.1021/ac00096a002. [DOI] [PubMed] [Google Scholar]
- 7.Eng JK, Mccormack AL, Yates JR. J Am Soc Mass Spectrom. 1994;5:976–989. doi: 10.1016/1044-0305(94)80016-2. [DOI] [PubMed] [Google Scholar]
- 8.Fenn JB, Mann M, Meng CK, Wong SF, Whitehouse CM. Science. 1989;246:64–71. doi: 10.1126/science.2675315. [DOI] [PubMed] [Google Scholar]
- 9.Fenn JB, Mann M, Meng CK, Wong SF, Whitehouse CM. Mass Spectrom Rev. 1990;9:37–70. [Google Scholar]
- 10.McLafferty FW, Kelleher NL, Begley TP, Fridriksson EK, Zubarev RA, Horn DM. Curr Opin Chem Biol. 1998;2:571–578. doi: 10.1016/s1367-5931(98)80085-9. [DOI] [PubMed] [Google Scholar]
- 11.Kelleher NL. Anal Chem. 2004;76:196a–203a. [PubMed] [Google Scholar]
- 12.Reid GE, McLuckey SA. J Mass Spectrom. 2002;37:663–675. doi: 10.1002/jms.346. [DOI] [PubMed] [Google Scholar]
- 13.Roth MJ, Parks BA, Ferguson JT, Boyne MT, Kelleher NL. Anal Chem. 2008;80:2857–2866. doi: 10.1021/ac800141g. [DOI] [PMC free article] [PubMed] [Google Scholar]
- 14.Meng FY, Cargile BJ, Miller LM, Forbes AJ, Johnson JR, Kelleher NL. Nat Biotechnol. 2001;19:952–957. doi: 10.1038/nbt1001-952. [DOI] [PubMed] [Google Scholar]
- 15.Geer LY, Markey SP, Kowalak JA, Wagner L, Xu M, Maynard DM, Yang XY, Shi WY, Bryant SH. J Proteome Res. 2004;3:958–964. doi: 10.1021/pr0499491. [DOI] [PubMed] [Google Scholar]
- 16.Han XM, Jin M, Breuker K, McLafferty FW. Science. 2006;314:109–112. doi: 10.1126/science.1128868. [DOI] [PubMed] [Google Scholar]
- 17.Zubarev RA, Kelleher NL, McLafferty FW. J Am Chem Soc. 1998;120:3265–3266. [Google Scholar]
- 18.Syka JEP, Coon JJ, Schroeder MJ, Shabanowitz J, Hunt DF. Proc Natl Acad Sci USA. 2004;101:9528–9533. doi: 10.1073/pnas.0402700101. [DOI] [PMC free article] [PubMed] [Google Scholar]
- 19.Pitteri SJ, Chrisman PA, Hogan JM, McLuckey SA. Anal Chem. 2005;77:1831–1839. doi: 10.1021/ac0483872. [DOI] [PMC free article] [PubMed] [Google Scholar]
- 20.Little DP, Speir JP, Senko MW, Oconnor PB, McLafferty FW. Anal Chem. 1994;66:2809–2815. doi: 10.1021/ac00090a004. [DOI] [PubMed] [Google Scholar]
- 21.Laskin J, Futrell JH. Mass Spectrom Rev. 2005;24:135–167. doi: 10.1002/mas.20012. [DOI] [PubMed] [Google Scholar]
- 22.McLuckey SA. J Am Soc Mass Spectrom. 1992;3:599–614. doi: 10.1016/1044-0305(92)85001-Z. [DOI] [PubMed] [Google Scholar]
- 23.Gauthier JW, Trautman TR, Jacobson DB. Anal Chim Acta. 1991;246:211–225. [Google Scholar]
- 24.Liu J, Chrisman PA, Erickson DE, McLuckey SA. Anal Chem. 2007;79:1073–1081. doi: 10.1021/ac061798t. [DOI] [PMC free article] [PubMed] [Google Scholar]
- 25.Hu QZ, Noll RJ, Li HY, Makarov A, Hardman M, Cooks RG. J Mass Spectrom. 2005;40:430–443. doi: 10.1002/jms.856. [DOI] [PubMed] [Google Scholar]
- 26.Makarov A, Denisov E, Kholomeev A, Baischun W, Lange O, Strupat K, Horning S. Anal Chem. 2006;78:2113–2120. doi: 10.1021/ac0518811. [DOI] [PubMed] [Google Scholar]
- 27.Henry KD, McLafferty FW. Org Mass Spectrom. 1990;25:490–492. [Google Scholar]
- 28.McLafferty FW. Acc Chem Res. 1994;27:379–386. [Google Scholar]
- 29.Nemeth-Cawley JF, Rouse JC. J Mass Spectrom. 2002;37:270–282. doi: 10.1002/jms.281. [DOI] [PubMed] [Google Scholar]
- 30.Liu ZY, Schey KL. J Am Soc Mass Spectrom. 2008;19:231–238. doi: 10.1016/j.jasms.2007.06.006. [DOI] [PMC free article] [PubMed] [Google Scholar]
- 31.Liu ZY, Schey KL. J Am Soc Mass Spectrom. 2005;16:482–490. doi: 10.1016/j.jasms.2004.12.018. [DOI] [PubMed] [Google Scholar]
- 32.Pitteri SJ, McLuckey SA. Mass Spectrom Rev. 2005;24:931–958. doi: 10.1002/mas.20048. [DOI] [PubMed] [Google Scholar]
- 33.Reid GE, Shang H, Hogan JM, Lee GU, McLuckey SA. J Am Chem Soc. 2002;124:7353–7362. doi: 10.1021/ja025966k. [DOI] [PubMed] [Google Scholar]
- 34.Amunugama R, Hogan JM, Newton KA, McLuckey SA. Anal Chem. 2004;76:720–727. doi: 10.1021/ac034900k. [DOI] [PubMed] [Google Scholar]
- 35.Bowers JJ, Liu J, Gunawardena HP, McLuckey SA. J Mass Spectrom. 2008;43:23–34. doi: 10.1002/jms.1263. [DOI] [PubMed] [Google Scholar]
- 36.Coon JJ, Ueberheide B, Syka JEP, Dryhurst DD, Ausio J, Shabanowitz J, Hunt DF. Proc Natl Acad Sci USA. 2005;102:9463–9468. doi: 10.1073/pnas.0503189102. [DOI] [PMC free article] [PubMed] [Google Scholar]
- 37.Bunger MK, Cargile BJ, Ngunjiri A, Bundy JL, Stephenson JL. Anal Chem. 2008;80:1459–1467. doi: 10.1021/ac7018409. [DOI] [PubMed] [Google Scholar]
- 38.Xia Y, Chrisman PA, Erickson DE, Liu J, Liang XR, Londry FA, Yang MJ, McLuckey SA. Anal Chem. 2006;78:4146–4154. doi: 10.1021/ac0606296. [DOI] [PMC free article] [PubMed] [Google Scholar]
- 39.Xia Y, Liang XR, McLuckey SA. J Am Soc Mass Spectrom. 2005;16:1750–1756. doi: 10.1016/j.jasms.2005.07.013. [DOI] [PubMed] [Google Scholar]
- 40.Xia Y, Wu J, McLuckey SA, Londry FA, Hager JW. J Am Soc Mass Spectrom. 2005;16:71–81. doi: 10.1016/j.jasms.2004.09.017. [DOI] [PubMed] [Google Scholar]
- 41.Taylor GK, Kim YB, Forbes AJ, Meng FY, McCarthy R, Kelleher NL. Anal Chem. 2003;75:4081–4086. doi: 10.1021/ac0341721. [DOI] [PubMed] [Google Scholar]
- 42.LeDuc RD, Taylor GK, Kim YB, Januszyk TE, Bynum LH, Sola JV, Garavelli JS, Kelleher NL. Nucleic Acids Res. 2004;32:W340–W345. doi: 10.1093/nar/gkh447. [DOI] [PMC free article] [PubMed] [Google Scholar]
- 43.Stephenson JL, Cargile BJ, McLuckey SA. Rapid Commun Mass Spectrom. 1999;13:2040–2048. doi: 10.1002/(SICI)1097-0231(19991030)13:20<2040::AID-RCM754>3.0.CO;2-W. [DOI] [PubMed] [Google Scholar]
- 44.Altschul SF, Gish W, Miller W, Myers EW, Lipman DJ. J Mol Biol. 1990;215:403–410. doi: 10.1016/S0022-2836(05)80360-2. [DOI] [PubMed] [Google Scholar]
- 45.Xia Y, Liang XR, McLuckey SA. Anal Chem. 2006;78:1218–1227. doi: 10.1021/ac051622b. [DOI] [PubMed] [Google Scholar]
- 46.Han H, Xia Y, Yang M, McLuckey SA. Anal Chem. 2008;80:3492–3497. doi: 10.1021/ac7022734. [DOI] [PMC free article] [PubMed] [Google Scholar]
- 47.Xia Y, Han H, McLuckey SA. Anal Chem. 2008;80:1111–1117. doi: 10.1021/ac702188q. [DOI] [PubMed] [Google Scholar]