

Abstract
Recent human functional MRI (fMRI) studies have revealed that two widely distributed groups of cortical areas display inverse changes in activity when attentional demands increase, with one group showing higher (task-on) and the second lower (task-off) blood oxygen level-dependent (BOLD) signals. Moreover, task-on and task-off regions also exhibit slow (<0.2 Hz) inversely correlated fluctuations in BOLD signal at rest. However, the neuronal correlates of these reciprocal BOLD signal fluctuations are unknown. Here, we addressed this question using simultaneous recordings of unit activity and local field potentials (LFPs) in the cat homologues of task-on and task-off regions. In all states of vigilance, LFP power was lower in task-off than task-on regions with no difference in firing rates. Both sets of regions displayed slow (0.5–0.15 Hz) cyclical modulations in LFP power in all frequency bands but with large and variable phase differences such that task-on and task-off regions were often anticorrelated. Inversely correlated LFP power fluctuations were state-dependent in that they were much more frequent in waking and paradoxical sleep than in slow-wave sleep. Moreover, consistent with fMRI findings, when attentional demands increased, LFP power in task-on and task-off regions changed in opposite directions, further augmenting and decreasing, respectively. At odds with previous fMRI studies, however, the decreased LFP power in task-off regions was associated with increased firing rates, suggesting that the engagement of task-off regions might not be reduced but in fact enhanced during attention.
Keywords: attention, cortex, amygdala, prefrontal, EEG, electroencephalogram, cingulate
Introduction
Adaptive interactions with the environment necessitate coordination of activity among spatially distributed and sparsely interconnected cortical areas. Although much data are available on the computations taking place within individual areas, the large-scale coordination of cortical activity remains largely unexplored. Indeed, most physiological studies on corticocortical interactions have focused on directly connected areas (Castelo-Branco et al., 2000; Isomura et al., 2006; Buschman and Miller, 2007) (but see Hoffman and McNaughton, 2002). As a result, we know little about the global functional architecture of the cerebral cortex beyond what can be extrapolated from our understanding of small-scale cortical circuits.
Fortunately, recent functional MRI (fMRI) studies have shed some light into this question. Indeed, it was reported that when attentional demands increase, two distributed sets of cortical areas display reciprocal changes in activity with one group showing increased and the second decreased blood oxygen level-dependent (BOLD) signals (Binder et al., 1999; Greicius et al., 2003; McKiernan et al., 2003; Fox et al., 2005; Fransson, 2006; Dosenbach et al., 2007). Because BOLD correlates positively with metabolic demands and thus neuronal activity, these two groups of cortical regions were termed “task-on” and “task-off,” respectively. Interestingly, task-on and task-off regions also exhibit slow (<0.2 Hz) inversely correlated BOLD fluctuations at rest (Greicius et al., 2003; Fox et al., 2005, 2006; Fransson, 2006).
Initially, these findings were interpreted as evidence for the existence of a default mode of brain operation where, in the absence of cognitive demands, task-off regions support introspective and self-referential activity (Gusnard and Raichle, 2001; Raichle et al., 2001). In this view, task-off regions would be disengaged when cognitive demands increase. However, it was later reported that performance on a working memory task correlates positively with functional coupling between different task-off regions (Hampson et al., 2006), suggesting that rather than being deactivated during cognitive tasks, neurons in task-off regions might actually be performing useful coding.
Also inconsistent with the initial interpretation, similar reciprocal BOLD fluctuations were observed during sleep (Fukunaga et al., 2006), under anesthesia (Kiviniemi et al., 2005), and in anesthetized monkeys (Vincent et al., 2007). Rather, these observations imply that the anticorrelated BOLD signals of task-on and task-off regions reflect a functional organization that is loosely connected to cognitive activity, but is evolutionarily well conserved. Indeed, fMRI data from lower species are consistent with human findings. For instance, slow (<0.2 Hz) baseline BOLD fluctuations were also observed in rat cortex (Lu et al., 2007; Zhao et al., 2008). Moreover, anticorrelated BOLD responses were also seen in distant cortical areas upon sensory stimulation in rodents (Huang et al., 1996) and felines (Harel et al., 2002).
Given the indirect relationship existing between BOLD and neuronal activity (Logothetis and Wandell, 2004; Buzsáki et al., 2007; Viswanathan and Freeman, 2007), more direct measures of neuronal activity are needed to compare task-on and task-off regions. The evidence indicating that anticorrelated BOLD fluctuations exist in lower species opens the possibility of using more invasive electrophysiological techniques than practical in primates to study the cellular correlates of this large-scale coordination of cortical activity. Thus, the present study addresses this question using multisite unit and local field potential (LFP) in the feline homologues of task-on and task-off regions.
Materials and Methods
Surgery.
All procedures were approved by the Institutional Animal Care and Use Committee of Rutgers State University, in compliance with the Guide for the Care and Use of Laboratory Animals (Department of Health and Human Services). Three adult cats were preanesthetized with a mixture of ketamine and xylazine (15 and 2 mg/kg, i.m.) and then artificially ventilated with a mixture of ambient air, oxygen, and isoflurane. Atropine (0.05 mg/kg, i.m.) was administered to prevent secretions. The end-tidal CO2 concentration was maintained at 3.7 ± 0.2% and the body temperature at 37–38°C (with a heating pad). Two silver-ball electrodes were inserted into the supra-orbital cavity to monitor eye movements. After trepanation and opening of the dura mater, an array of high impedance microelectrodes was stereotaxically positioned at the various sites indicated in Figure 1A. Then, four screws were cemented to the skull to later fix the cat's head without pain or pressure. Cats were administered penicillin (20,000 UI/kg, i.m.) and an analgesic (Ketofen, 2 mg/kg, s.c.) daily for 3 d after the surgery.
Figure 1.
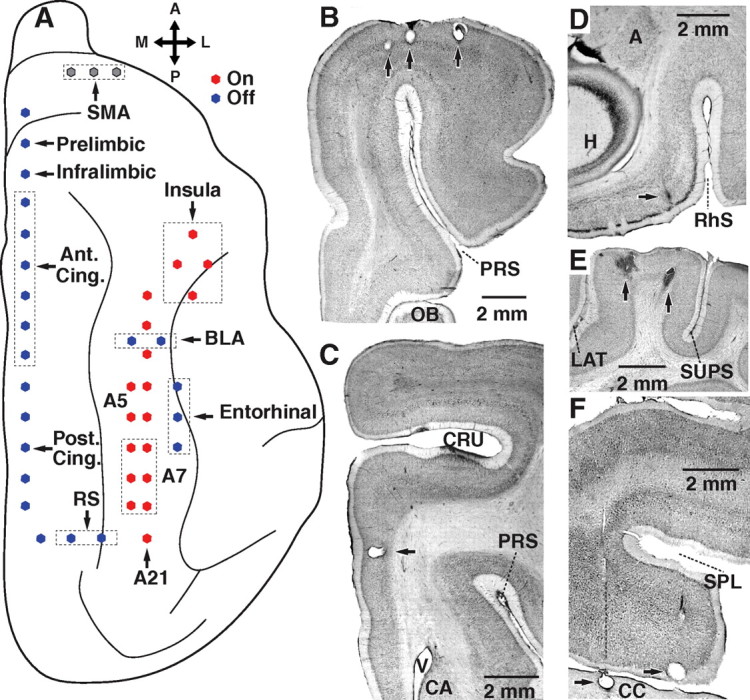
Location and histological identification of recording sites. A, Recording method. Microelectrodes (filled circles) were inserted in various cortical regions. Targeted task-on regions (red circles) included the insula as well as areas 5, 7, and 21. Task-off regions (blue circles) consisted of the medial prefrontal, cingulate, and retrosplenial cortices. In addition, we obtained recordings from the entorhinal cortex and BLA. Electrodes positioned in the SMA are shown in gray because earlier fMRI studies variously classified this area as belonging to the task-on or task-off networks. B–F, Histological verification of recording sites. Coronal (B–E) and parasagittal (F) sections showing the location of electrolytic lesions (arrows) performed at the end of the experiments to mark the position of the microelectrode tips in SMA (B), anterior cingulate cortex (C), the entorhinal cortex (D), area 5 (E) and the posterior cingulate cortex (F). A, Amygdala; CA, caudate nucleus; CC, corpus callosum; CRU, cruciate sulcus; H, hippocampus; LAT, lateral sulcus; OB, olfactory bulb; PRS, presylvian sulcus; RS, retrosplenial cortex; RhS, rhinal sulcus; SPL, splenial sulcus; SUPS, suprasylvian sulcus; V, ventricle.
The array of electrodes was constructed by drilling small holes in a Teflon block and then inserting tungsten microelectrodes into them. The Teflon block was then inserted into a tightly fitting Delrin sleeve, which was cemented to the skull. The lengths of the electrodes were adjusted so that LFP and unit recordings could be simultaneously obtained from the various sites indicated in Figure 1A.
Behavior.
Before implantation of the microelectrodes, the cats were trained on an operant sensory discrimination task. In this task, visual stimuli (gratings of various orientations moving at a constant speed) were shown to the cats via a computer screen positioned one foot in front of them. The screen encompassed most of their visual field. By successive approximation, the cats learned that a CS+ (grating) of variable duration (10–18 s) predicted the presentation of a second grating (4 s) of shifted orientation (5–45°) during which the animal had to lick at a frequency ≥200% than during the CS+, to obtain a liquid food reward. Interruption of an infrared beam by the cats' tongue was used to detect licking. In addition, the animals were presented a CS− grating of identical duration but shifted 90° with respect to the CS+. Each session, ∼25 CS+ and 25 CS− were presented in random order, with 40 s between the onset of successive trials. The LCD screen was black during intertrial intervals. Eight days after implantation of the microelectrodes, the animals were retrained on the task until their performance reached presurgical levels. One or two daily recording sessions were then performed for 10–14 d. In two of the animals, the CS+ was horizontal and the CS− vertical. The opposite was used for the third cat but this had no impact on the unit and LFP changes seen when we compared activity during the CS+ and CS−.
It could be argued that performance of this task does not require increased levels of attention during the CS+. Among the alternative interpretations are the possibilities that activity differences between the CS+ and CS− reflect an associative learning phenomenon, or that they are related to a diffuse arousal caused by anticipation of the reward. However, we believe this task truly requires increased attention because the subjects must withhold responding across a long and variable delay.
Recordings.
Neuronal activity was sampled at 100 μm intervals. Each day, the electrodes were lowered to a new recording site, and at least 30 min elapsed before data were acquired, to ensure mechanical stability. The signals picked up by the electrodes were observed on an oscilloscope, digitized at 25 kHz, and stored on a hard disk. Spike sorting was performed off-line using a clustering algorithm based on principal component analysis and K-means. To analyze how LFP power changed during the behavioral task, we computed the power spectral density of each LFP and normalized the differences between the CS+ and CS− to overall power using the following equation: (CS+ − CS−)/(CS+ + CS−). The same approach was used to study task-related changes in firing rates. Spike durations were measured in various ways but they all yielded qualitatively identical results when cell groups were compared. The spike duration values reported below refer to the interval between the onset of the initial negativity to the peak of the subsequent positivity.
Histology.
At the end of the experiments, the cats were given an overdose of pentobarbital (50 mg/kg, i.v.), and the final recording sites were marked with electrolytic lesions (0.5 mA, 10 s). The cats were then perfused transcardially with 500 ml of 0.9% saline, and then 500 ml of fixative (2% paraformaldehyde and 1% glutaraldehyde in 0.1 m phosphate buffer, pH 7.4). The brains were later sectioned on a vibrating microtome (100 μm) and stained with cresyl violet to verify electrode positions. This report only includes LFPs and unit activity obtained from sites that were histologically confirmed to be located in the regions of interest (Fig. 1B–F).
Statistical analyses.
Unless otherwise stated, all values in text and figures are averages ± SEM. Statistical significance of the results was assessed by performing repeated-measures ANOVAs followed by post hoc t tests with a significance threshold of p < 0.05 that was adjusted with Holm's stepwise Bonferroni correction (Holm, 1979) in cases of multiple comparisons. The significance of differences in LFP power spectra between task-on and task-off regions were assessed using Arvesen's Jackknifing U statistical test (Arvesen, 1969), as implemented using the two_group_test_spectrum function freely available at chronux.org.
Results
Guided by cytoarchitectural and functional homologies between cat and primate brains (Reinoso-Suárez, 1961), three cats were implanted with 43 high-impedance tungsten microelectrodes in task-on (Fig. 1A, red) and task-off (Fig. 1A, blue) cortical regions, as defined in Fox et al. (2005). The targeted task-on regions included the insula as well as areas 5, 7, and 21. Task-off regions consisted of the medial prefrontal, cingulate, and retrosplenial cortices. In addition, microelectrodes were positioned in the supplementary motor area (SMA) (Fig. 1A, gray) that was variously classified as belonging to the task-off or task-on networks. Finally, because most task-off regions are commonly considered as “limbic,” we also obtained recordings from other brain sites that meet this definition, namely the entorhinal cortex and basolateral amygdala (BLA). Below, we only report data obtained from electrodes that were histologically confirmed to have reached their intended position (Fig. 1B–F).
Activity of task-on and task-off regions during different behavioral states of vigilance
In keeping with previous findings (Steriade and Hobson, 1976), task-on (Fig. 2A) and task-off (Fig. 2B) regions displayed an increase in LFP power when the cats' behavioral state shifted from waking (Fig. 2A1,B1) to slow-wave sleep (SWS) (Fig. 2A2,B2) and the opposite from SWS to REM sleep (Fig. 2A2,B2). Indeed, at all recording sites, SWS onset coincided with an obvious increase in the amplitude of slow frequency components that reverted at the start of REM sleep or when the cats woke up. Despite these similarities, however, total LFP power was markedly lower in task-off (Fig. 2B) than task-on regions (Fig. 2A), a property that also characterized the LFPs recorded in the BLA and entorhinal cortex (Fig. 2B). To assess whether this difference was significant, we computed total LFP power for all available sites in waking, SWS, and REM sleep. For the three behavioral states, the frequency distribution of LFP power was bimodal (Fig. 2C1–3) with ≥73% of task-off sites (n = 53) in the left mode and ≥82% of task-on sites (n = 35) in the right mode (χ2 tests, all with p < 0.01). Further analyses revealed that task-on regions exhibited higher LFP power than task-off regions in all frequency bands and behavioral states (supplemental Fig. 1, available at www.jneurosci.org as supplemental material). Yet, the average firing rates of neurons recorded in task-on and task-off regions were statistically indistinguishable (task-on, 1.76 ± 0.31 Hz, n = 79; task-off, 1.95 ± 0.34 Hz, n = 76; t test, p = 0.8).
Figure 2.
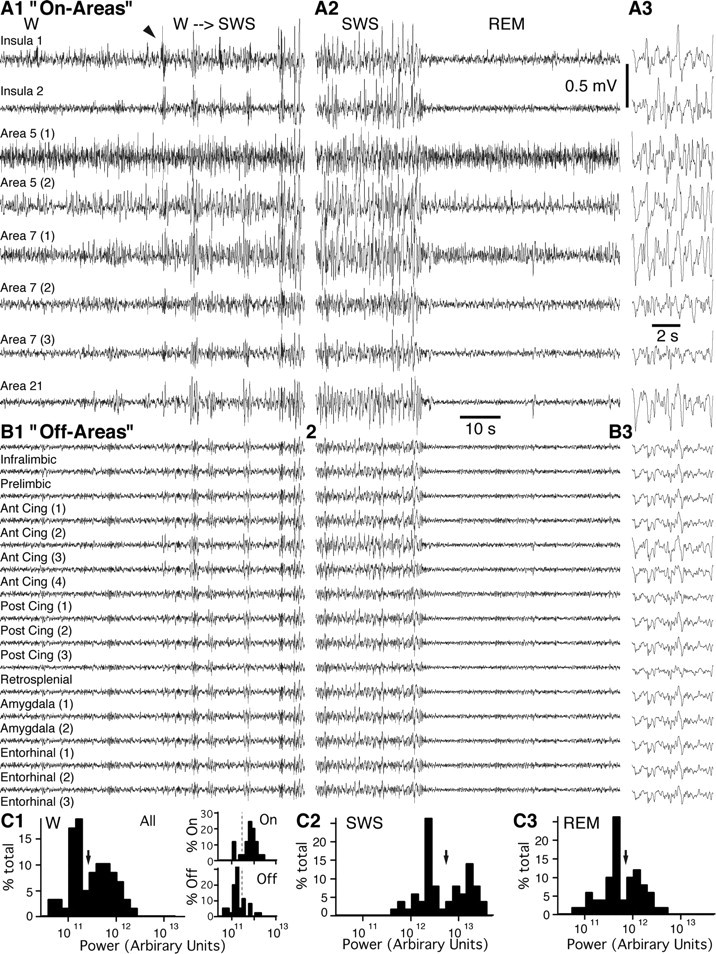
LFP power is lower in task-off than task-on regions. A, B, LFPs recorded simultaneously in task-on (A) or task-off (B) regions in waking (W), at the transition from waking to slow-wave sleep (W→SWS), and during paradoxical sleep (REM). A3 and B3 show an expanded period of SWS. C1–3, Frequency distribution of total power in W (C1), SWS (C2), and REM sleep (C3). Note that all histograms are bimodal. Arrows indicate cutoff between low and high modes. C1 (insets), Separate frequency distributions of LFP power for task-on and task-off regions during wakefulness.
In search of the electrophysiological manifestation of the slow inversely correlated BOLD fluctuations previously seen at rest in task-on and task-off regions, we estimated power spectral densities by computing Fast Fourier transforms (FFTs) in 512 ms time windows. This data were then averaged separately in task-on and task-off regions, and normalized to an average of one. The analyzed frequency bands were 1–5, 5–10, 10–30, 30–50, 65–100 Hz, hereafter termed delta, theta, beta, gamma, and fast, respectively. This procedure was performed for 10 or more long stationary epochs of waking, slow-wave sleep, and REM sleep (total of 31 epochs) obtained from three different cats.
Consistent with earlier spectral assessments of spontaneous BOLD fluctuations, this analysis disclosed the presence of extremely slow cyclical variations in LFP power (<0.2 Hz) that were highly correlated within task-on or task-off regions, considered separately. Indeed, a high correlation was found between total power fluctuations at the various recording sites (range, 0.72–0.83) within task-on or task-off regions. Similarly high correlation coefficients were obtained when we separately considered power in the various frequency bands listed above. An example of this phenomenon is shown in Figure 3 that plots gamma and delta power fluctuations in task-on (Fig. 3A1) and task-off (Fig. 3A2) regions during a slow-wave sleep epoch. Upon visual inspection, these fluctuations seemed to be loosely correlated across task-on and task-off regions (Fig. 3A). Moreover, fluctuations in the low (delta, theta) versus high frequency bands (gamma, fast) typically seemed to be in phase opposition (Fig. 3A, compare continuous and dashed lines).
Figure 3.
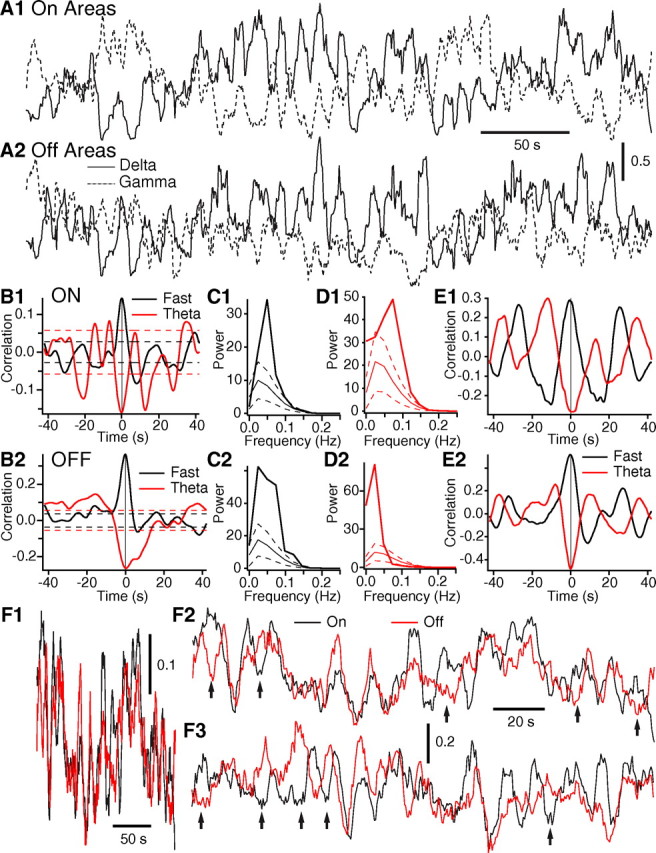
Task-on and task-off regions exhibit slow LFP power fluctuations. A, Average delta (continuous line) and gamma (dashed line) power fluctuations in task-on (A1) and task-off (A2) regions during a slow-wave sleep epoch. B, Correlation between unit activity and LFP power in the theta (red) and fast (black) frequency bands in task-on (B1) and task-off (B2) regions. Average of data obtained in 10 different waking epochs obtained from three cats. C, D, FFT of average unit-power crosscorrelograms shown in A for fast (C1, D1) and theta (D1, D2) LFP activity. Thick lines indicate power of actual correlogram, whereas thin solid line indicate power ±1SD (dashed lines) of shuffled correlograms. E, Same as in B but for a single waking session where the power-unit relations were particularly strong and rhythmic. F, Gamma power fluctuations of task-on (black) and task-off (red) regions in waking shown with a slow (F1) and fast (F2–3) time base. Same epoch is shown in F1–2. Arrows in F2–3 point to periods of anticorrelated fluctuations in gamma power in task-on and task-off regions.
A possible artifactual explanation for these slow LFP power fluctuations is breathing. However, this seems unlikely because respiration rate in cats is ∼30 per min whereas the dominant frequencies of the slow power fluctuations were <0.2 Hz. A second possibility is that these fluctuations are caused by slow mechanical perturbations in the recording room (e.g., ventilation). To test if this was the case, we examined whether such power fluctuations could be seen when the recording electrodes and reference were placed in saline, or when resistors (1–10 MΩ) were placed between the preamplifier input stages and reference. Both tests yielded the same result: a flat line with negligible power fluctuations.
Since slow mechanical perturbations of the recording equipment would not be expected to affect single-unit activity, we next examined correlations between fluctuations in power and unit activity. To this end, for all 31 waking, slow-wave sleep and REM sleep epochs, we computed normalized fluctuations in the firing rates of simultaneously recorded task-off (n = 118) and task-on (n = 115) neurons. Then, we crosscorrelated power and unit fluctuations. To assess significance, for each power-unit crosscorrelogram, we shuffled the field and unit data 1000 times, crosscorrelated the randomized data, and averaged the result. To be considered significant, the actual correlogram had to be >95% of the randomly generated values in two parameters: value within ±10 s of the origin and power of the cross-correlogram.
At odds with the idea that the slow power fluctuations resulted from mechanical perturbations, we found a consistent pattern of power-unit relationships across behavioral states and recorded regions. In particular, in a majority of epochs, the power of fast and gamma oscillations showed a significant positive correlation with the unit activity (58–68% of epochs reached significance). Epochs with significant negative power-unit correlations with gamma or fast frequencies (6%) occurred at chance level. In contrast, firing rates tended to be negatively correlated with power fluctuations in the delta and theta bands, in all behavioral states (42–52% of epochs reached significance). Epochs with significant positive power-unit correlations with delta or theta frequencies occurred at chance level. Figure 3B depicts the average power-unit correlograms of all 10 waking epochs for fluctuations in the theta (red) and fast (black) power bands in task-on (Fig. 3B1) and task-off regions (Fig. 3B2) where the dashed lines indicate ±1 SD of the randomized correlograms. Using the same color code, Figure 3, C and D, compares the power of the actual (thick line) and randomized (thin line) correlograms. Examples of individual waking epochs were the unit power-relationship was particularly strong are provided in Figure 3E1–2.
Having established that the slow power fluctuations are not artifacts caused by mechanical perturbations, we next examined the temporal relationship between power fluctuations in task-on and task-off regions. Computing linear correlations between power fluctuations in like frequency bands always yielded positive correlation coefficients in all behavioral states (range, 0.42–0.73; see supplemental Table 1, available at www.jneurosci.org as supplemental material), with the gamma band yielding the lowest coefficients of correlation (range, 0.42–0.47). However, examination of overlaid power fluctuations in task-on (black) and task-off (red) regions with a slow (Fig. 3F1) or fast (Fig. 3F2–3) time base revealed a more complex situation. In all behavioral states, whether we considered power fluctuations of low (delta, theta) or high (gamma, fast) frequency bands, we observed slow oscillations (<0.05 Hz) that were tightly correlated in task-on and task-off regions (Fig. 3F1). In contrast, faster power fluctuations (0.5–0.15 Hz) (Fig. 3F2–3) showed more independence, particularly in waking and REM sleep epochs.
To estimate the proportion of time when fluctuations in task-on and task-off regions were in phase opposition (Fig. 3F2–3, arrows), we digitally filtered gamma power fluctuations in the 0.05–0.15 Hz range, computed correlation coefficients in sliding windows of 10 s, and estimated the proportion of time the coefficients were more negative than −0.3. This analysis revealed state-dependent fluctuations in the proportion of time gamma power fluctuations were anticorrelated in task-on versus task-off regions. Indeed, periods of anticorrelated gamma power fluctuations accounted for <5% of the time in slow-wave sleep (4.95 ± 1.41%) compared with ∼20% of the time in waking (19. 1 ± 5.03%) and REM sleep (22.28 ± 3.28%). Using t tests with stepwise Bonferroni correction of the significance level, these differences between slow-wave sleep versus REM sleep or waking were found to be statistically significant (p < 0.05).
Attention-related changes in LFP power in task-on and task-off regions
To study how the activity of task-on and task-off regions is affected when attentional demands increase, three cats were trained on an operant sensory discrimination task (Fig. 4 A,B). In this task, a LCD screen that encompassed most of the cats' visual field displayed a CS+ (grating) of variable duration (10–18 s). This stimulus was followed by a second grating (4 s) of shifted orientation (5–45°) during which the animal had to lick to obtain a liquid food reward. To distinguish between the effects of the sensory stimulation versus attention, the animals were also presented a CS− grating of identical duration but shifted 90° with respect to the CS+. The CS+ and CS− were presented in random order with a 20 s interstimulus interval during which the LCD screen was black.
Figure 4.

Operant sensory discrimination task. A, B, Cats were presented vertical (CS−, A) or horizontal gratings (CS+, B). The CS+ had a variable duration (10–18 s) and was followed by a second grating (4 s) of shifted orientation (5–45°), during which the cat had to lick to obtain a liquid food reward at CS+ offset. Each session, ∼25 CS+ and 25 CS− were presented in random order (40 s between onset of each CS). C, D, Lick frequency (y-axis) as a function of time (x-axis) during trials where the CS+ (C) or CS− (D) were presented.
Presumably because of the long and variable duration of the CS+, this task proved difficult for the animals. Depending on the cat, 8–10 daily training sessions were required for their performance to reach criterion (licking rate during response period ≥200% higher than during CS+ in ≥50% of trials). Nevertheless, all tested animals learned to lick at a much higher rate during the response interval that followed the CS+ (0.79 ± 0.02 Hz) (Fig. 4C) than at any other time during the CS+ (0.11 ± 0.01 Hz) or CS− (0.09 ± 0.03 Hz) (Fig. 4D) (paired t tests, p < 0.0001 for both comparisons). Importantly, the cats' behavior during the CS− and CS+ (excluding response interval) did not differ (t tests, licking rate, p = 0.89; frequency of eye movements, p = 0.2).
By computing power spectra, we compared task-related changes in LFP power for various frequency bands during correct CS+ trials (excluding the response interval) versus the CS−. During correct CS+ trials, total LFP power increased significantly in task-on regions (by 8.7 ± 1.8%), whereas it decreased in task-off regions (by 10.8 ± 2.0%; paired t tests, p < 0.00001 in both cases). As shown in Figure 5A, where we separately averaged LFP power in all task-on and task-off recording sites, these changes were not confined to a particular frequency band (repeated measure ANOVA, F groups (1,460) = 52.36, p < 0.0001). Moreover, the same trend was observed when individual regions were examined separately (repeated-measures ANOVA on change in total power; CS+ versus CS−, F(1,703) = 23.65, p < 0.0001; between areas, F(10,703) = 18.74, p < 0.0001). For instance, Figure 5B shows percentage change in total power from the CS− to correct CS+ trials in individual task-on and task-off regions. Using paired t tests, the difference in total power was found to be significant at p ≤ 0.02 for all examined regions with the exception of the SMA. After using Holm's stepwise Bonferroni correction of the significance threshold (p < 0.05) for multiple comparisons (see Materials and Methods), all differences remained significant with the exception of the insula, retrosplenial cortex, and SMA.
Figure 5.

Compared with the CS−, LFP power during the CS+ shifts in opposite directions in task-on and task-off regions. A, Difference in LFP power during the CS+ versus the CS− (y-axis) in various frequency bands (x-axis) in task-on (thick line) and task-off (thin line) regions. B, Normalized change in total power in different task-on (thick lines) and task-off (thin lines) regions.
Analysis of LFP coherence revealed that in baseline conditions and during the CS−, LFP coherence was much higher among task-off than task-on regions (t test, on vs off, p < 0.0001) (Fig. 6A,B). Yet, for low frequencies (≤10 Hz), LFP coherence was significantly lower between task-on and task-off regions than within different regions of each network (ANOVA F(2,358) = 141, p < 0.0001; t tests with Bonferroni correction, all p values < 0.05) (Fig. 6A,B). These observations support the notion that there is greater functional coupling among areas that belong to the same network than across networks. Further analyses also revealed that during correct CS+ trials, LFP coherence increased both within and between task-on and task-off regions (Fig. 6A,B). As was seen with changes in LFP power, this effect was not confined to a particular range of frequencies (Fig. 6B) (repeated-measures ANOVAs; on–on, F(1,560) = 28.35, p < 0.0001; off–off, F(1,856) = 4.07, p < 0.05; on–off, F(1,1448) = 29.75, p < 0.0001).
Figure 6.

Compared with the CS−, LFP coherence during the CS+ increases both within and between task-on and task-off regions. A, LFP coherence (theta band) during the CS− (empty bars) and CS+ (solid bars) among task-on (left), task-off (middle), or between task-on and task-off regions (right). B, LFP coherence (color coded) in various frequency bands (x-axis) during the CS− (left) and CS+ (right).
Attention-related changes in the firing rates of cells recorded in task-on and task-off regions
Overall, these results indicate that, consistent with previous fMRI findings, two widely distributed sets of brain regions display opposite shifts in activity when attentional demands increase. Because the BOLD signal correlates positively with metabolic demands and thus neuronal activity, it was assumed that these activity shifts respectively reflected increased and decreased engagement of task-on and task-off regions in conditions of heightened attentional demands. This assumption was supported by a recent resonance spectroscopic study that reported a correlation between GABA concentration and negative BOLD responses in a task-off region (Northoff et al., 2007). Nevertheless, given the indirect relationship existing between the BOLD signal and neuronal activity (Logothetis and Wandell, 2004; Buzsáki et al., 2007; Viswanathan and Freeman, 2007), this assumption remained to be tested.
To this end, we obtained single-unit recordings in task-on (n = 115) and task-off (n = 118) regions. Although there were regional differences in firing rates among different task-on or task-off regions, as a group, task-on and task-off neurons had similar baseline discharge rates (task-on, 1.76 ± 0.31 Hz, n = 115; task-off, 1.95 ± 0.34 Hz, n = 118; t test, p = 0.8). Next, we examined how the firing rates of task-on and task-off neurons fluctuated in the same sensory discrimination task as with the LFP analyses. These analyses were performed on a subset of 79 task-on and 76 task-off neurons recorded during sessions where the behavioral performance of the animals met our criteria (see above). We observed unexpected dissociations between firing rates and the LFP alterations described above. In particular, no significant changes in firing rates were seen among task-on neurons (Fig. 7A,B, empty circles) when comparing unit activity during the CS+ and CS− (percentage change of −2.8 ± 1.3%; paired t test, p = 0.28). Moreover, task-off neurons (Fig. 7A,B, filled circles) displayed a significant increase in firing rate from the CS− to the CS+ (average change of 17.1 ± 2.2%; paired t test, p < 0.001) (Fig. 7B, inset).
Figure 7.

LFP power and firing rates change in opposite directions in task-off regions during the CS+. Graphs plotting difference in total (A) or theta (B) power (y-axis) as a function of difference in firing rate (x-axis) during the CS+ versus CS− in task-on (empty circles) and task-off (filled circles) regions. B (inset), Normalized difference in firing rates during the CS− versus CS+ for neurons recorded in task-on (white bar) and task-off (black bar) regions. C, Average firing rate of a task-off neuron (y-axis, data normalized to baseline values) as a function of time (x-axis) during trials where a CS+ (red line, n = 25) or a CS− (black line, n = 47) were presented. D, Normalized difference in firing rates during the CS− versus CS+ for neurons recorded in different task-on (left, white bars) and task-off (right, black bars) regions. Area 7, n = 36; insula (INS), n = 13; area 5, n = 19; area 21, n = 11; medial prefrontal cortex (mPFC), n = 15; anterior cingulate (ACing), n = 29; posterior cingulate (PCing), n = 26; retrosplenial (Retrospl), n = 6.
An example of this phenomenon is shown in Figure 7C for a task-off neuron recorded in the posterior cingulate cortex. Here, the perievent histogram illustrates average fluctuations in firing rate during CS− (Fig. 7C, black line) and CS+ trials (Fig. 7C, red line), normalized to baseline values. Note that during the CS+, this neuron exhibited a sustained and significant increase in firing rate (average increase of 48.5 ± 7.2% calculated over the entire CS+; t test, p = 0.002). Moreover, repeating this analysis for all available cells revealed that a much higher proportion of task-off neurons (48.7%, n = 76) significantly increased their firing rate during the CS+ than task-on neurons (15.2%, n = 79; χ2, p < 0.00001).
Finally, to test if there were inter-regional differences in the proportion of task-off neurons with increased firing rates during the CS+ compared with the CS−, we used a χ2 test. This test failed to reject the null hypothesis, namely that the incidence of task-off neurons with increased firing rates during the CS+ was the same in different task-off regions (χ2 test: 0.2, p = 0.9). Identical results were obtained in task-on regions (χ2 test: 2.9, p = 0.4). Consistent with this, plotting the average difference in firing rates between the CS+ and CS− separately for neurons recorded in different task-on or task-off regions (Fig. 7D), confirmed that CS-related changes in unit activity were uniform across different areas of the same networks. Indeed, computing separate two-tailed paired t tests for each area revealed that differences in firing rates between CS+ and CS− were not significant in all task-on regions (range of p values, 0.11–0.68), whereas all task-off regions exceeded the 0.05 significance threshold (range of p values, 0.04–0.00003).
Since many cortical interneurons are intrinsically more excitable than principal cells (McCormick et al., 1985; Llinas et al., 1991; Azouz et al., 1997; Kawaguchi and Kondo, 2002; Hasenstaub et al., 2005), it is conceivable that our sample of task-off cells showing attention-related increases in firing rates includes a higher proportion of inhibitory interneurons that the other group of task-off cells or task-on cells in general. This would explain the dissociation between the attention-related increases in firing rate and decreases in LFP power seen in task-off regions. In search of evidence that might betray such a sampling bias, we next compared the baseline firing rates of task-off cells that showed significant increases in discharge rates during the CS+ (n = 37) to task-off (n = 39) or task-on (n = 67) cells that did not. At odds with this possibility, however, no difference in baseline firing rates was found between three groups (ANOVA F(2,140) = 0.025, p = 0.97; task-off with increase, 1.59 ± 0.21 Hz; task-off without increase, 1.62 ± 0.25 Hz; task-on without increase, 1.55 ± 0.19 Hz). Moreover, action potential durations were identical in the three groups (ANOVA F(2,140) = 0.03, p = 0.97; task-off with increase, 657 ± 25 μs; task-off without increase, 649 ± 31 μs; task-on without increase, 650 ± 19 μs).
Another possible explanation for the paradoxical increase in the firing rate of task-off neurons during the CS+ might be that, by chance, more of them were directly activated by the sensory properties of the CS+, not by attention-related effects. To test this possibility, we analyzed how CS+ and CS− presentations affected firing rates in early stages of training, when the animals performed the task at chance level. At odds with this possibility, whether we considered only the first 500 ms of the CS+ or CS− or their entire duration, we found that a similarly negligible proportion of task-off and task-on neurons displayed significant changes in firing rates in response to either CS (task-off, 4.88%, n = 82; task-on, 4.99%, n = 59).
Thus to summarize this section, although LFP power augmented from the CS− to CS+ in task-on regions, this change was not associated with a corresponding increase in the firing rate of neurons recorded in the same regions (Fig. 7A,B, empty circles). Conversely, whereas LFP power decreased in task-off regions from the CS− to the CS+, this change was associated with increased firing rates in neurons recorded in the same regions (Fig. 7A,B, filled circles).
Discussion
Previous fMRI studies have identified two sets of cortical areas that display reciprocal changes in activity, with one group showing higher and the second lower BOLD signals when attentional demands increase (Binder et al., 1999; Greicius et al., 2003; McKiernan et al., 2003; Fransson, 2006; Dosenbach et al., 2007). The present study was undertaken to shed light on the electrophysiological correlates of these inverse fluctuations.
Because combining electrophysiology, behavior, and fMRI constitutes a technical challenge that so far has not been overcome, we addressed this question in a feline model that allows more invasive electrophysiological techniques than practical in primates. The validity of this approach resides in the following. First, previous electrophysiological studies of attentional effects in primates and cats have yielded remarkably similar results (Wörgötter and Eysel, 2000; Buia and Tiesinga, 2006). Second, we found a close correspondence between human fMRI findings and LFP activity in cats. For instance, using the bipartite classification of cortical areas in task-on and task-off regions based on human fMRI studies, we found that the cat homologs of these areas could similarly be classified in two groups by simply considering LFP power. Moreover, consistent with the reciprocal BOLD fluctuations seen at rest in human task-on and task-off regions, we have observed periods of anticorrelated LFP power oscillations between task-on and task-off regions, in the same low frequency range as seen in human studies. Finally, closely paralleling the results of human fMRI studies, when attentional demands increased, LFP power in task-on and task-off regions changed in opposite directions, augmenting and decreasing, respectively. Below, we consider the origin and significance of these findings for the large-scale coordination of activity in cortical networks.
In all states of vigilance, LFP power is lower in task-off than task-on regions
An unexpected finding to emerge from this study is that LFP power is significantly lower in task-off than task-on regions in all behavioral states of vigilance. What could account for this observation? Because many task-off regions are located on the midline, it is conceivable that when synchronized synaptic events occur, the inversely oriented dipoles generated in the two hemispheres annul each other, resulting in lower LFP amplitude. Although this factor may contribute, it cannot account for the fact that low LFP powers were also seen in task-off regions that are not located on the midline such as the SMA and entorhinal cortex. In fact, the observation that low or high LFP power could be seen in task-off or task-on regions with a superficial (SMA vs areas 5–7), deep (entorhinal vs insula), or lateral (entorhinal vs area 21) location, suggests that dipole attenuation or amplification due to positional effects is not the sole contributing factor.
It is also unlikely that the difference in LFP power is due to a systematic bias in the exact cortical layers sampled by our electrodes. While it is true that for task-off sites near the midline, the electrodes tracks were parallel to the lamination and thus tended to stay in one layer, this was not the case of the retrosplenial or entorhinal recordings that also displayed low LFP power. Moreover, for all recording sites where the electrode tracks were perpendicular to the lamination, this explanation predicts that the difference in LFP power would depend on the exact depth of the recordings. Yet, the difference between LFP power of task-on and task-off regions was seen in all recording sessions although the electrodes were moved 100 μm each session.
Thus, it appears that positional or methodological factors cannot account for the systematic difference in LFP powers observed between task-off and task-on regions. Only neuronal explanations remain. These include the possibility of differences in the synchrony and frequency of afferent impulses to the two sets of cortical regions. Another possibility is that neuromodulatory cell groups of the basal forebrain and brainstem exert different effects in task-on and task-off regions.
Spontaneous activity fluctuations in task-on and task-off regions at rest
Previous fMRI studies have revealed that task-on and task-off cortical regions exhibit slow (<0.2 Hz) inversely correlated fluctuations in BOLD signal at rest (Greicius et al., 2003; Fox et al., 2005; Fransson, 2005; Fox et al., 2006). Consistent with these earlier findings and with a recent electrophysiological study in humans (Nir et al., 2008), we observed that task-on and task-off regions exhibit extremely slow cyclical variations in LFP power (<0.2 Hz), in all frequency bands and behavioral states. At odds with the possibility that these fluctuations resulted from mechanical artifacts, LFP power fluctuations in the high (gamma and fast) and low (delta, theta) range of frequencies consistently showed an opposite relation to unit activity, being positively versus negatively correlated with firing rates, respectively. Moreover, when we compared the timing of the power fluctuations in task-on and task-off regions, we observed large and variable phase differences such that they were often anticorrelated. Intriguingly, the incidence of these anticorrelated LFP power fluctuations was state-dependent in that they were much more frequent in waking and REM sleep than in slow-wave sleep. Nevertheless, even during wakefulness and REM sleep, anticorrelated power fluctuations accounted for only 20% of the time. At present, it is unclear whether these power fluctuations represent the electrophysiological counterpart of the previously reported inverse BOLD fluctuations of task-on and task-off regions. Indeed, in earlier fMRI studies, such as in Fox et al. (2005), task-on and task-off regions were reported to display nearly perfect anticorrelated BOLD fluctuations. However, in other studies (Fransson, 2005) the inverse relationship was not constant. A complete statistical characterization of these inverse BOLD fluctuations will be required before we can determine whether our LFP observations match the fMRI results.
Dissociation between attention-related changes in LFP power and unit activity
The observation that BOLD signals respectively augment and decrease in task-on and task-off regions when attentional demands increase, has led to the view that the engagement of task-off regions is reduced during cognitive tasks and the opposite in task-on regions. Although the present study revealed changes in LFP power that are consistent with this view, the unit data is not. Indeed, we observed striking dissociations between changes in LFP power and unit activity when attentional demands increased.
Although our observations may seem counter-intuitive, there are numerous examples of dissociations between LFP power and firing rates in the literature. For instance, although cortical LFP power is much lower in the waking state than during slow-wave sleep, the firing rates of cortical cells are generally higher in waking (for review, see Steriade and Hobson, 1976). Similarly, low or variable coupling between firing rates and LFP power was also reported when the analysis was restricted to the gamma band, a range of frequencies thought to be tightly related to the BOLD signal (Logothetis et al., 2001; Mukamel et al., 2005; Niessing et al., 2005; Nir et al., 2007).
These considerations underscore the ambiguous relationship that exists between neuronal function and the indices available to us to monitor neuronal activity. As shown here, there can be changes in LFP power with no alteration in firing rates and instances where LFP power and unit activity change in opposite direction. Moreover, other studies have documented how there can be useful coding in the absence of change in firing rates, only firing pattern and synchrony (Paz et al., 2006, 2007). Finally, one can conceive of situations where a change in the spectral composition of LFPs would not alter energy requirements and thus leave the BOLD signal unchanged, yet be associated to functionally important modifications in neuronal operations.
Engagement of task-off regions as a function of attentional demands
Because the BOLD signal correlates positively with metabolic demands, it was logical to interpret the negative BOLD responses of task-off regions as a reflection of their decreased engagement in conditions of increased cognitive load. However, the present study indicates that neurons in task-off regions show task-related increases in firing rates. Although our results are inconsistent with this earlier interpretation, it remains that our study was performed in cats and there might be species differences in this respect. Yet, support for the notion that task-off regions might in fact perform useful task-related coding also comes from human work. Indeed, a previous fMRI study in human subjects reported a positive correlation between performance on a working memory task and coupling strength between different task-off regions (Hampson et al., 2006). Moreover, there is a vast literature indicating that task-off regions are involved in a diverse array of functions that are an integral part of adaptative interactions with the environment including sensory integration, visceral control, visuospatial cognition, and declarative memory (for review, see Vogt, 2005).
Conclusions
Consistent with previous fMRI studies, the present report provides evidence for the large-scale coordination of activity in two widely distributed sets of cortical regions. Across various behavioral states of vigilance, these two groups of cortical regions display marked differences in LFP power but not firing rates. When attentional demands augment, differences in LFP power are further increased. At the same time however, LFP power and firing rates can change in opposite directions. An important question for future studies will be to identify the mechanisms underlying the differential regulation of neuronal activity in task-on and task-off regions and probe the functional significance of their contrasting activity patterns.
Footnotes
This work was supported by National Institutes Health RO1 Grant MH-073610 to D. Paré. We thank the members of the Paré laboratory for comments on an earlier version of this manuscript and Anton Sirota for help with the analysis of power spectra.
The authors declare no competing financial interests.
References
- Arvesen JN. Jackknifing U-statistics. Ann Math Stat. 1969;40:2076–2100. [Google Scholar]
- Azouz R, Gray CM, Nowak LG, McCormick DA. Physiological properties of inhibitory interneurons in cat striate cortex. Cereb Cortex. 1997;7:534–545. doi: 10.1093/cercor/7.6.534. [DOI] [PubMed] [Google Scholar]
- Binder JR, Frost JA, Hammeke TA, Bellgowan PS, Rao SM, Cox RW. Conceptual processing during the conscious resting state. A functional MRI study. J Cogn Neurosci. 1999;11:80–95. doi: 10.1162/089892999563265. [DOI] [PubMed] [Google Scholar]
- Buia C, Tiesinga P. Attentional modulation of firing rate and synchrony in a model cortical network. J Comput Neurosci. 2006;20:247–264. doi: 10.1007/s10827-006-6358-0. [DOI] [PubMed] [Google Scholar]
- Buschman TJ, Miller EK. Top-down versus bottom-up control of attention in the prefrontal and posterior parietal cortices. Science. 2007;315:1860–1862. doi: 10.1126/science.1138071. [DOI] [PubMed] [Google Scholar]
- Buzsáki G, Kaila K, Raichle M. Inhibition and brain work. Neuron. 2007;56:771–783. doi: 10.1016/j.neuron.2007.11.008. [DOI] [PMC free article] [PubMed] [Google Scholar]
- Castelo-Branco M, Goebel R, Neuenschwander S, Singer W. Neural synchrony correlates with surface segregation rules. Nature. 2000;405:685–689. doi: 10.1038/35015079. [DOI] [PubMed] [Google Scholar]
- Dosenbach NU, Fair DA, Miezin FM, Cohen AL, Wenger KK, Dosenbach RA, Fox MD, Snyder AZ, Vincent JL, Raichle ME, Schlaggar BL, Petersen SE. Distinct brain networks for adaptive and stable task control in humans. Proc Natl Acad Sci U S A. 2007;104:11073–11078. doi: 10.1073/pnas.0704320104. [DOI] [PMC free article] [PubMed] [Google Scholar]
- Fox MD, Snyder AZ, Vincent JL, Corbetta M, Van Essen DC, Raichle ME. The human brain is intrinsically organized into dynamic, anticorrelated functional networks. Proc Natl Acad Sci U S A. 2005;102:9673–9678. doi: 10.1073/pnas.0504136102. [DOI] [PMC free article] [PubMed] [Google Scholar]
- Fox MD, Snyder AZ, Zacks JM, Raichle ME. Coherent spontaneous activity accounts for trial-to-trial variability in human evoked brain responses. Nat Neurosci. 2006;9:23–25. doi: 10.1038/nn1616. [DOI] [PubMed] [Google Scholar]
- Fransson P. Spontaneous low-frequency BOLD signal fluctuations: an fMRI investigation of the resting-state default mode of brain function hypothesis. Hum Brain Mapp. 2005;26:15–29. doi: 10.1002/hbm.20113. [DOI] [PMC free article] [PubMed] [Google Scholar]
- Fransson P. How default is the default mode of brain function? Further evidence from intrinsic BOLD signal fluctuations. Neuropsychologia. 2006;44:2836–2845. doi: 10.1016/j.neuropsychologia.2006.06.017. [DOI] [PubMed] [Google Scholar]
- Fukunaga M, Horovitz SG, van Gelderen P, de Zwart JA, Jansma JM, Ikonomidou VN, Chu R, Deckers RH, Leopold DA, Duyn JH. Large-amplitude, spatially correlated fluctuations in BOLD fMRI signals during extended rest and early sleep stages. Magn Reson Imaging. 2006;24:979–992. doi: 10.1016/j.mri.2006.04.018. [DOI] [PubMed] [Google Scholar]
- Greicius MD, Krasnow B, Reiss AL, Menon V. Functional connectivity in the resting brain: a network analysis of the default mode hypothesis. Proc Natl Acad Sci U S A. 2003;100:253–258. doi: 10.1073/pnas.0135058100. [DOI] [PMC free article] [PubMed] [Google Scholar]
- Gusnard DA, Raichle ME. Searching for a baseline: functional imaging and the resting human brain. Nat Rev Neurosci. 2001;2:685–694. doi: 10.1038/35094500. [DOI] [PubMed] [Google Scholar]
- Hampson M, Driesen NR, Skudlarski P, Gore JC, Constable RT. Brain connectivity related to working memory performance. J Neurosci. 2006;26:13338–13343. doi: 10.1523/JNEUROSCI.3408-06.2006. [DOI] [PMC free article] [PubMed] [Google Scholar]
- Harel N, Lee SP, Nagaoka T, Kim DS, Kim SG. Origin of negative blood oxygenation level-dependent fMRI signals. J Cereb Blood Flow Metab. 2002;22:908–917. doi: 10.1097/00004647-200208000-00002. [DOI] [PubMed] [Google Scholar]
- Hasenstaub A, Shu Y, Haider B, Kraushaar U, Duque A, McCormick DA. Inhibitory postsynaptic potentials carry synchronized frequency information in active cortical networks. Neuron. 2005;47:423–435. doi: 10.1016/j.neuron.2005.06.016. [DOI] [PubMed] [Google Scholar]
- Hoffman KL, McNaughton BL. Coordinated reactivation of distributed memory traces in primate neocortex. Science. 2002;297:2070–2073. doi: 10.1126/science.1073538. [DOI] [PubMed] [Google Scholar]
- Holm SA. A simple sequentially rejective multiple test procedure. Scand J Stat. 1979;6:65–70. [Google Scholar]
- Huang W, Plyka I, Li H, Eisenstein EM, Volkow ND, Springer CS., Jr Magnetic resonance imaging (MRI) detection of the murine brain response to light: temporal differentiation and negative functional MRI changes. Proc Natl Acad Sci U S A. 1996;93:6037–6042. doi: 10.1073/pnas.93.12.6037. [DOI] [PMC free article] [PubMed] [Google Scholar]
- Isomura Y, Sirota A, Ozen S, Montgomery S, Mizuseki K, Henze DA, Buzsáki G. Integration and segregation of activity in entorhinal-hippocampal subregions by neocortical slow oscillations. Neuron. 2006;52:871–882. doi: 10.1016/j.neuron.2006.10.023. [DOI] [PubMed] [Google Scholar]
- Kawaguchi Y, Kondo S. Parvalbumin, somatostatin and cholecystokinin as chemical markers for specific GABAergic interneuron types in the rat frontal cortex. J Neurocytol. 2002;31:277–287. doi: 10.1023/a:1024126110356. [DOI] [PubMed] [Google Scholar]
- Kiviniemi VJ, Haanpää H, Kantola JH, Jauhiainen J, Vainionpää V, Alahuhta S, Tervonen O. Midazolam sedation increases fluctuation and synchrony of the resting brain BOLD signal. Magn Reson Imaging. 2005;23:531–537. doi: 10.1016/j.mri.2005.02.009. [DOI] [PubMed] [Google Scholar]
- Llinás RR, Grace AA, Yarom Y. In vitro neurons in mammalian cortical layer 4 exhibit intrinsic oscillatory activity in the 10- to 50-Hz frequency range. Proc Natl Acad Sci U S A. 1991;88:897–901. doi: 10.1073/pnas.88.3.897. [DOI] [PMC free article] [PubMed] [Google Scholar]
- Logothetis NK, Wandell BA. Interpreting the BOLD signal. Annu Rev Physiol. 2004;66:735–769. doi: 10.1146/annurev.physiol.66.082602.092845. [DOI] [PubMed] [Google Scholar]
- Logothetis NK, Pauls J, Augath M, Trinath T, Oeltermann A. Neurophysiological investigation of the basis of the fMRI signal. Nature. 2001;412:150–157. doi: 10.1038/35084005. [DOI] [PubMed] [Google Scholar]
- Lu H, Zuo Y, Gu H, Waltz JA, Zhan W, Scholl CA, Rea W, Yang Y, Stein EA. Synchronized delta oscillations correlate with the resting-state functional MRI signal. Proc Natl Acad Sci U S A. 2007;104:18265–18269. doi: 10.1073/pnas.0705791104. [DOI] [PMC free article] [PubMed] [Google Scholar]
- McCormick DA, Connors BW, Lighthall JW, Prince DA. Comparative electrophysiology of pyramidal and sparsely spiny stellate neurons of the neocortex. J Neurophysiol. 1985;54:782–806. doi: 10.1152/jn.1985.54.4.782. [DOI] [PubMed] [Google Scholar]
- McKiernan KA, Kaufman JN, Kucera-Thompson J, Binder JR. A parametric manipulation of factors affecting task-induced deactivation in functional neuroimaging. J Cogn Neurosci. 2003;15:394–408. doi: 10.1162/089892903321593117. [DOI] [PubMed] [Google Scholar]
- Mukamel R, Gelbard H, Arieli A, Hasson U, Fried I, Malach R. Coupling between neuronal firing, field potentials, and FMRI in human auditory cortex. Science. 2005;309:951–954. doi: 10.1126/science.1110913. [DOI] [PubMed] [Google Scholar]
- Niessing J, Ebisch B, Schmidt KE, Niessing M, Singer W, Galuske RA. Hemodynamic signals correlate tightly with synchronized gamma oscillations. Science. 2005;309:948–951. doi: 10.1126/science.1110948. [DOI] [PubMed] [Google Scholar]
- Nir Y, Fisch L, Mukamel R, Gelbard-Sagiv H, Arieli A, Fried I, Malach R. Coupling between neuronal firing rate, gamma LFP, and BOLD fMRI is related to interneuronal correlations. Curr Biol. 2007;17:1275–1285. doi: 10.1016/j.cub.2007.06.066. [DOI] [PubMed] [Google Scholar]
- Nir Y, Mukamel R, Dinstein I, Privman E, Harel M, Fisch L, Gelbard-Sagiv H, Kipervasser S, Andelman F, Neufeld MY, Kramer U, Arieli A, Fried I, Malach R. Interhemispheric correlations of slow spontaneous neuronal fluctuations revealed in human sensory cortex. Nat Neurosci. 2008;11:1100–1108. doi: 10.1038/nn.2177. [DOI] [PMC free article] [PubMed] [Google Scholar]
- Northoff G, Walter M, Schulte RF, Beck J, Dydak U, Henning A, Boeker H, Grimm S, Boesiger P. GABA concentrations in the human anterior cingulate cortex predict negative BOLD responses in fMRI. Nat Neurosci. 2007;10:1515–1517. doi: 10.1038/nn2001. [DOI] [PubMed] [Google Scholar]
- Paz R, Pelletier JG, Bauer EP, Paré D. Emotional enhancement of memory via amygdala-driven facilitation of rhinal interactions. Nat Neurosci. 2006;9:1321–1329. doi: 10.1038/nn1771. [DOI] [PubMed] [Google Scholar]
- Paz R, Bauer EP, Paré D. Learning-related facilitation of rhinal interactions by medial prefrontal inputs. J Neurosci. 2007;27:6542–6551. doi: 10.1523/JNEUROSCI.1077-07.2007. [DOI] [PMC free article] [PubMed] [Google Scholar]
- Raichle ME, MacLeod AM, Snyder AZ, Powers WJ, Gusnard DA, Shulman GL. A default mode of brain function. Proc Natl Acad Sci U S A. 2001;98:676–682. doi: 10.1073/pnas.98.2.676. [DOI] [PMC free article] [PubMed] [Google Scholar]
- Reinoso-Suárez F. Topographischer hirnatlas der katze für experimental-physiologische untersuchungen. Darmstadt: E Merck AG; 1961. [Google Scholar]
- Steriade M, Hobson JA. Neuronal activity during the sleep-waking cycle. Prog Neurobiol. 1976;6:155–376. [PubMed] [Google Scholar]
- Vincent JL, Patel GH, Fox MD, Snyder AZ, Baker JT, Van Essen DC, Zempel JM, Snyder LH, Corbetta M, Raichle ME. Intrinsic functional architecture in the anaesthetized monkey brain. Nature. 2007;447:83–86. doi: 10.1038/nature05758. [DOI] [PubMed] [Google Scholar]
- Viswanathan A, Freeman RD. Neurometabolic coupling in cerebral cortex reflects synaptic more than spiking activity. Nat Neurosci. 2007;10:1308–1312. doi: 10.1038/nn1977. [DOI] [PubMed] [Google Scholar]
- Vogt BA. Pain and emotion interactions in subregions of the cingulate gyrus. Nat Rev Neurosci. 2005;6:533–544. doi: 10.1038/nrn1704. [DOI] [PMC free article] [PubMed] [Google Scholar]
- Wörgötter F, Eysel UT. Context, state and the receptive fields of striatal cortex cells. Trends Neurosci. 2000;23:497–503. doi: 10.1016/s0166-2236(00)01632-5. [DOI] [PubMed] [Google Scholar]
- Zhao F, Zhao T, Zhou L, Wu Q, Hu X. BOLD study of stimulation-induced neural activity and resting-state connectivity in medetomidine-sedated rat. Neuroimage. 2008;39:248–260. doi: 10.1016/j.neuroimage.2007.07.063. [DOI] [PMC free article] [PubMed] [Google Scholar]