

Abstract
Background: Cancer cachexia–associated weight loss is poorly understood; energetically demanding tissues (eg, organ and tumor mass) and resting energy expenditure (REE) are reported to increase with advanced cancer.
Objective: The objective was to quantify the potential contribution of increasing masses of energetically demanding tissues to REE with colorectal cancer cachexia progression.
Design: A longitudinal computed tomography (CT) image review was performed to quantify organ size (liver, including metastases, and spleen) and peripheral tissues (skeletal muscle and adipose tissue) during colorectal cancer cachexia progression (n = 34). Body composition was prospectively evaluated by CT and dual-energy X-ray absorptiometry, and REE was determined by indirect calorimetry in advanced colorectal cancer patients (n = 18).
Results: Eleven months from death, the liver (2.3 ± 0.7 kg) and spleen (0.32 ± 0.2 kg) were larger than reference values. One month from death, liver weight increased to 3.0 ± 1.5 kg (P = 0.010), spleen showed a trend to increase (P = 0.077), and concurrent losses of muscle (4.2 kg) and fat (3.5 kg) (P < 0.05) were observed. The estimated percentage of fat-free mass (FFM) occupied by the liver increased from 4.5% to 7.0% (P < 0.001). The most rapid loss of peripheral tissues and liver and metastases gain occurred within 3 mo of death. A positive linear relation existed between liver mass and measured whole-body REE (r2 = 0.35, P = 0.010); because liver accounted for a larger percentage of FFM, measured REE · kg FFM−1 · d−1 increased (r2 = 0.35, P = 0.010).
Conclusions: Increases in mass and in the proportion of high metabolic rate tissues, including liver and tumor, represented a cumulative incremental REE of ≈17,700 kcal during the last 3 mo of life and may contribute substantially to cachexia-associated weight loss.
INTRODUCTION
The etiology of cancer cachexia and other wasting syndromes is not clearly understood, but several hypotheses exist (1–4). One theory is that peripheral stores of fat and protein are mobilized from adipose tissue and skeletal muscle to be used as a fuel for energetically demanding visceral organs, which have increased activity in the tumor-bearing state. The energetic demands of the liver are particularly substantial. Liver represents ≈2% of body weight in healthy individuals, but its specific metabolic rate is high (200 kcal · kg−1 · d−1) (5); consequently, it represents ≈20% of whole-body resting energy expenditure (REE). Organ mass has been used to model and predict REE (6, 7), and liver size is a significant predictor of REE (7).
The potential significance of the mass of high-metabolic-rate organs on REE and the development of cancer cachexia has only been suggested (4); however, we suspect that it could be important in colorectal cancer. The presence of hepatomegaly and splenomegaly is common knowledge to oncologists; however, the changes in size of these organs has only been directly quantified in case reports (8). Tumors, as unresectable hepatic metastases, may represent an additional burden of tissue with a high metabolic rate; importantly, ≈50% of all colorectal cancer patients develop this complication (9), which has been associated with weight loss (10, 11). There are currently very few quantitative data on the contribution of high-metabolic-rate organs to cancer cachexia–associated weight loss (4, 8, 12); this would require extensive body composition and REE measurements. However, we know that small changes in organ mass have the potential to account for a substantial quantity of energy expenditure over time. If liver mass increased by only 500 g and this change persisted, it would add an incremental REE of 100 kcal/d.
We hypothesized that patients with colorectal cancer may be especially affected by a viscerally driven cachexia syndrome originating from increasing masses of high-metabolic-rate tissues, especially liver, spleen, and tumor. Several approaches were used to investigate this question. A retrospective serial computed tomography (CT) image analysis was completed to assess longitudinal body-composition changes (ie, liver, spleen, skeletal muscle, and adipose tissue) in subjects with colorectal cancer. Using data from this cohort, we used a computational model of human metabolism (13, 14) to estimate the effect of organ changes on whole-body REE. In a second cross-sectional cohort, we evaluated the relation between REE determined by indirect calorimetry and organ mass.
SUBJECTS AND METHODS
Retrospective cohort
The study was approved by the Alberta Cancer Board Research Ethics Board (Edmonton, Canada). Our region encompassed northern Alberta, Canada. A database of all cancer cases in the region (Alberta Cancer Registry) codes primary cancers by their site and morphology along with clinical and demographic information. We searched the database using the following criteria: 1) death from colorectal cancer (ICD-9-CM codes: 153.x, 154.0, 154.1) between 1 June 2001 and 31 August 2004, and 2) evaluation by CT imaging at least twice between the time of colorectal cancer diagnosis and death. With the understanding that cachexia is most prominent at the end of life and to take advantage of the statistical power of repeated measures, we focused on patients with ≥4 CT scans on record during the year preceding death.
CT image analysis
Muscle and adipose tissue surface areas were evaluated at a standard vertebral landmark (the third lumbar vertebrae; L3), because tissue areas in this region are significantly related to whole-body muscle and fat masses (15–17). Tissues were analyzed on 2 consecutive transverse CT images extending inferiorly from L3 with Slice-O-Matic V4.3 (Tomovision, Montreal, Canada), which permitted specific tissue demarcation by using Hounsfield unit thresholds of −29 to 150 for skeletal muscles (psoas, erector spinae, quadratus lumborum, transversus abdominus, external and internal obliques, and rectus abdominus) (18), −150 to −50 for visceral adipose tissue (19), and −190 to −30 for subcutaneous and intermuscular adipose tissues (18). Thresholds were manually adjusted as necessary. Cross-sectional areas (cm2) were computed for each tissue by summing tissue pixels and multiplying by the pixel surface area. Mean tissue areas for 2 consecutive images were calculated; the mean CV of paired images was 1.5% for skeletal muscle and 2.7% for adipose tissue areas.
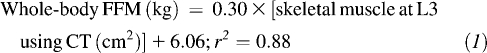
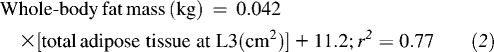
Regression equations derived from an advanced cancer patient cohort were used to estimate whole-body fat-free mass (FFM) and fat mass from L3 skeletal muscle and total adipose tissue surface areas (17):
 |
 |
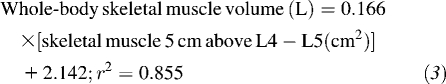
Muscle surface area was also used to estimate whole-body muscle with the use of an algorithm derived from a healthy population (15), because no equation currently exists to predict this compartment from L3 muscle surface area in patients with advanced cancer.
 |
A density of 1.04 g/cm3 was used to convert muscle volume to mass (20).
Liver and spleen volumes (cm3) were also measured with CT images. Because the images encompassed the entire liver and spleen, the organ tissue surface area on each image was analyzed. Liver and spleen surface areas on each consecutive image, the image thickness (usually 6.5 mm) and separation (usually 5mm) were then used by the Slice-O-matic db volumes function to calculate volume. Liver volume included metastases if present. To estimate organ mass from volume, a density of 1.05 g/cm3 was used for liver and 1.054 g/cm3 was used for spleen (20, 21).
Prospective cohort
We investigated the relation between organ mass and measured REE in a second cohort of patients with metastatic colorectal cancer (n = 18). Subjects were recruited from the Cross Cancer Institute (Edmonton, Canada) between 1 April 2005 and 31 October 2006 and provided written informed consent. Each participant had an REE measurement by indirect calorimetry (VMax 29N; SensorMedics, Yorba Linda, CA). Before the REE assessment, subjects were asked to fast for 12 h and to refrain from strenuous exercise and alcohol for 24 h. Participants rested for 30 min, after which a canopy was placed over their head and shoulders for 30 min to analyze oxygen consumption and carbon dioxide production. Breath samples were measured until a steady state was reached for 15 min. The Weir equation was used to calculate REE (22). On the same morning as the REE assessment, all participants also underwent a dual-energy X-ray absorptiometry (DXA) scan (LUNAR Prodigy High Speed Digital Fan Beam X-Ray-Based Densitometer with enCORE 9.20 software; General Electric, Madison, WI) (23) to measure whole-body FFM. All subjects also had a CT scan performed 14 ± 7 d from this date which was used to quantify organ mass as described above.
Mathematical model simulations
A mathematical model was developed that simulates the dynamics of whole-body metabolism, body-composition changes, and REE during semistarvation and refeeding (13). This model was also used to integrate data on the metabolic changes in patients with cancer cachexia to show how these derangements synergize with reduced energy intake to result in progressive loss of body constituents and alterations in energy metabolism (14). The initial conditions of the cachexia simulation (14) were selected to represent a typical cancer patient before disease onset: a 69-y-old male with an initial body weight of 77.7 kg, 32% body fat, a dietary intake of 2400 kcal/d, and an REE of 1606 kcal/d (30.6 kcal · kg FFM−1 · d−1). In the previously reported simulation (15), we applied several reported metabolic derangements defining cancer cachexia, including an increase in the rates of lipolysis (50 ± 30%), proteolysis (40 ± 10%), and Cori cycle (300 ± 100%); a tumor mass of 200 ± 100 g; and an energy intake that linearly decreased to 1700 kcal/d by the end of the 12-mo simulation. We also assumed that the liver and spleen remained the same as those of healthy adults (1.8 kg for liver, 250 g for spleen), rather than shrinking in response to reduced energy intake (8, 13). In all simulations, the liver- and spleen-specific metabolic rates were 200 (5) and 80 kcal · kg−1 · d−1 (24), respectively. Direct measures of tissue-specific metabolic rates are calculated by pairing blood flow with the arteriovenous oxygen concentration difference over a tissue of interest (5).
In the current study, we modified the original cancer cachexia simulation (14) using the directly determined liver and spleen masses, in place of our prior assumptions. Furthermore, we adjusted the decline in dietary energy intake to match the average measured body-composition changes of the retrospective cohort. We found that a linear decrease in energy intake from 2400 to 2150 kcal/d at the end of the 62-wk simulation allowed the model to match the retrospective body-composition changes.
Data analysis
Statistical analysis was completed by using SPSS version 15.0 (SPSS Inc, Chicago, IL) and Stata version 10.0 (Stata Corp, College Station, TX). All values are presented as means ± SDs, significance was set at α = 0.05, and all tests were 2-sided. Two-sample t tests and chi-square tests were used to compare patient cohorts. For the statistical analysis of absolute tissue masses in the retrospective cohort, we conducted repeated-measures analysis of variance (ANOVA) with Bonferroni pairwise comparisons. Simple linear regression was used to examine relations in the prospective cohort.
Tissue rates of change were calculated for the retrospective cohort. Tissue changes in each scan interval were expressed as a percentage and divided by the number of days in each interval because the timing of CT imaging was unique for each individual. The daily rate of loss or gain was multiplied by 100 to form a standard unit, % change/100 d to allow for comparisons.
RESULTS
Retrospective cohort
Our initial search criteria identified 262 patients. There were 1108 CT scans available in this cohort (range: 2–16 per patient), which had been conducted for diagnosis, staging, or follow-up. We focused on a subset of 34 patients who had ≥4 CT scans in the year preceding death. This subset was 35% female and died at 60 ± 8 y after surviving a median of 22 mo. The distribution of primary tumor sites was 68% colon (ICD-9-CM: 153.x), 6% rectosigmoid junction (ICD-9-CM: 154.0), and 26% rectum (ICD-9-CM: 154.1); 91% of this group had adenocarcinomas. In total, this group had 156 scans available for assessment; all images were analyzed with the exception of subcutaneous adipose tissue data from 2 obese patients, which was not fully visible in the image field of view. In addition, liver and spleen could not be accurately identified in 2 different patients, and liver was not assessed in 2 additional individuals because of either a resection or images not covering the entire organ. Selection bias was not apparent in this subset (n = 34); we found that the sex distribution, age at death, survival time, primary tumor site, tumor morphology, and body-composition features (ie, muscle and adipose tissues) in the last 2 mo of life were not different from the overall cohort (P > 0.1).
The changes in liver, spleen, muscle, and adipose tissue over time are shown (Table 1). Representative cases of liver and spleen gain (Figure 1A) and muscle and adipose tissue loss (Figure 1B) are illustrated. At the earliest studied time point (10.7 ± 2.7 mo from death), the liver and spleen of the cancer patients (Table 1) were larger than those reported for healthy adults (ie, liver: 1.4–1.8 kg; spleen: 0.15–0.25 kg) (8, 20). Liver increased thereafter (mean gain: 0.74 kg) over 9.5 mo (P = 0.010); there was a trend toward increased spleen mass (P = 0.077). Over the same period, ≈4.2 kg muscle (P < 0.001) and ≈3.5 kg fat (P = 0.004) were lost, and the percentage of estimated FFM occupied by the liver increased from 4.5% to 7.0% (P < 0.001). The range of liver masses 1.2 ± 0.5 mo from death was considerable (interquartile range: 2.0–3.8 kg), and many patients had evidence of liver metastases (Figure 1A).
TABLE 1.
Absolute tissue masses quantified with computed tomography (CT) imaging in patients who died of colorectal cancer1
| Visceral organ mass + tumor2 |
Peripheral tissues3 |
|||
| Mean time to death at time of CT image | Liver + metastases volume (estimated mass) (n = 30) | Spleen volume (estimated mass) (n = 32) | Skeletal muscle, L3 surface area (estimated whole-body mass) (n = 34) | Fat mass, L3 adipose tissue surface area (estimated whole-body mass) (n = 32) |
| cm3 (kg) | cm2 (kg) | |||
| 10.7 ± 2.7 mo | 2153 ± 629b,4 (2.3 ± 0.7) | 302 ± 204 (0.32 ± 0.2) | 151 ± 38b,c (28.3 ± 6.6) | 339 ± 206b (25.4 ± 8.7) |
| 7.1 ± 1.3 mo | 2245 ± 692b (2.4 ± 0.7) | 326 ± 220 (0.34 ± 0.2) | 149 ± 37b (28.0 ± 6.4) | 345 ± 208b (25.7 ± 8.7) |
| 4.2 ± 1.2 mo | 2291 ± 771b (2.4 ± 0.8) | 345 ± 237 (0.36 ± 0.3) | 144 ± 37c (27.0 ± 6.4) | 330 ± 214b (25.1 ± 9.0) |
| 1.2 ± 0.5 mo | 2857 ± 1435a (3.0 ± 1.5) | 366 ± 238 (0.39 ± 0.3) | 127 ± 36a (24.1 ± 6.3) | 255 ± 190a (21.9 ± 8.0) |
| Overall change in 9.5 mo | 704 (0.74) | 64 (0.067) | −24 (−4.2) | −84 (−3.5) |
| P5 | 0.010 | 0.077 | 0.001 | 0.004 |
The number of subjects varies because of missing data, as outlined in Results. Means in the same column with different superscript letters are significantly different, P < 0.05 (repeated-measures ANOVA with Bonferroni pairwise comparisons).
Liver and spleen masses were quantified as outlined in Subjects and Methods.
L3 tissue cross-sectional areas (cm2) were used to estimate whole-body skeletal muscle and fat mass from regression equations reported by Shen et al (15) and Mourtzakis et al (17), respectively.
Mean ± SD (all such values).
P value for change between 10.7 and 1.2 mo from death (repeated-measures ANOVA with Bonferroni pairwise comparison).
FIGURE 1.

Representative patients showing change in (A) liver and spleen and (B) skeletal muscle and adipose tissue. Transverse computed tomography images from (A) a 54-y-old woman at the 12th thoracic vertebrae (i) 10.0 and (ii) 1.5 mo from death [the liver with metastases (LM) increased by 1.3 kg to 3.1 kg, and spleen (SP) increased by 0.30 kg to 0.50 kg], and (B) a 52-y-old man at the 3rd lumbar vertebrae (i) 7.7 and (ii) 0.8 mo from death [estimated whole-body muscle (SM) decreased by 8.8 kg to 17.0 kg, and whole-body adipose tissue (AT) decreased by 2.0 kg to 16.7 kg].
The largest tissue changes occurred in the last interval studied; 80% of the mean gain in liver, 69% of the mean loss in muscle, and 91% of the mean loss in adipose tissue occurred during this time. The rates of tissue loss or gain over time (%change/100 d) are shown in Figure 2; maximal rates were observed close to death. Mean skeletal muscle tissue loss accelerated logarithmically (r2 = 0.99) to −13%/100 d at 2 mo from death. Mean adipose tissue loss also accelerated logarithmically (r2 = 0.95) to −41%/100 d at 2 mo from death. Mean liver gain followed a polynomial relation (r2 = 0.90) to 39%/100 d at 2 mo from death.
FIGURE 2.

Time course rates of gain or loss for liver (including metastases), muscle, and adipose tissue from the retrospective colorectal cancer patient cohort (n = 34). Scan intervals were categorized relative to the time of death and divided into 5 categories. Mean rates of change were determined for each tissue at each time point. Best-fit regression lines were used to determine the overall rate of change relation over time. The rate of change in liver followed a polynomial relation: liver %change/100 d = 0.0017(time to death, in d)2 − 0.7316(time to death, in d) + 75.56 (r2 = 0.90) (▴ and dotted curve). The loss of skeletal muscle was logarithmic: skeletal muscle %change/100 d = 8.8303ln(time to death, in d) − 50.746 (r2 = 0.99) (♦ and solid curve). Loss of adipose tissue was also logarithmic: adipose tissue %change/100 d = 32.029ln(time to death, in d) − 172.92 (r2 = 0.95) (▪ and dashed curve).
Prospective cohort
The cohort (n = 18) was 45% female and aged 60 ± 11 y at the time of assessment. On average, participants had 46.2 ± 12 kg FFM, which included a 1.9 ± 0.5 kg liver (range: 1.1–3.2 kg) and 0.31 ± 0.1 kg spleen (range: 0.12–0.71 kg). Participants had a measured REE of 1503 ± 295 kcal/d (33 ± 6 kcal · kg FFM−1 · d−1). REE was higher in patients with larger livers (r2 = 0.35, P = 0.010) (Figure 3A). Moreover, because liver occupied a larger percentage of whole-body FFM, REE (as kcal · kg FFM−1 · d−1) increased (r2 = 0.35, P = 0.010) (Figure 3B; dashed line).
FIGURE 3.

Relation between measured resting energy expenditure (REE) and liver mass in the prospective colorectal cancer patient cohort (n = 18). Liver mass (including metastases) was determined by computed tomography image analysis. REE was determined by indirect calorimetry, and fat-free mass (FFM) was determined by dual-energy X-ray absorptiometry. Simple linear regression was used to assess relations. A: REE (kcal/d) = 343.52(liver mass, in kg) + 841.49 (r2 = 0.35, P = 0.010). B: REE (kcal · kg FFM−1 · d−1) = 3.0011(%FFM occupied by the liver) + 20.513 (r2 = 0.35, P = 0.010) (dashed line). The solid line indicates a similar relation occurring in the new cancer cachexia simulation incorporating the measured liver masses from the retrospective cohort (Table 1).
The slope of the regression between liver mass and REE (Figure 3A) is a value of interest, which potentially indicates a high composite metabolic rate of the liver and metastases (ie, 343 kcal for each 1-kg increase). This is considerably higher than the value of 200 kcal · kg−1 · d−1 reported for healthy human liver in situ. However, this must be considered with caution because no data exist for the metabolic rate in situ of liver with metastases. Although this awaits direct measurement, done by pairing blood flow with the arteriovenous oxygen concentration difference over the tissue of interest (5), a high metabolic rate can be inferred from the relatively high rates of glucose uptake; this is the basis for detecting metastases by imaging with 18F-deoxyglucose (Figure 4).
FIGURE 4.

18F-Deoxyglucose positron emission tomography scan of a patient with extensive liver metastases.
Simulation results
Key assumptions in our earlier model (stable liver mass, tumor mass ≤200 g) appear to have been quite conservative relative to the directly determined values (Table 1), which we used to refine the model. Model simulations of the healthy reference condition (dotted curves) compared with reduced energy intake alone (dashed dotted curves), our previous cachexia simulation (14) (dashed curves), and the new cachexia simulation based on the directly determined liver and spleen masses of our retrospective colorectal cancer cohort are illustrated in Figure 5 (from Table 1; solid curves). The new cachexia simulation culminated at an REE of 1900 kcal/d (39.7 kcal · kg FFM−1 · d−1), which is 294 kcal/d (9.3 kcal · kg FFM−1 · d−1) above the healthy reference condition, 331 kcal/d (9.7 kcal · kg FFM−1 · d−1) above the reduced energy intake simulation, and 144 kcal/d (3.8 kcal · kg FFM−1 · d−1) above the previous cachexia simulation. Notably, the late rapid increase in liver mass measured in the retrospective colorectal cancer patient cohort was related to a steep increase in estimated metabolic rate during the last 3 mo of the simulation. The estimated contribution of spleen was negligible, because of the small overall size, lower specific metabolic rate, and relative constancy in size of this organ. During the last 3 mo of the simulation, the cumulative energy expended by the liver was estimated to be 31,900 kcal for the healthy reference condition, 31,400 kcal for reduced energy intake alone, and 49,600 kcal for the new cachexia simulation (ie, an increment of 17,700 kcal in the liver).
FIGURE 5.

A, B: Simulation of resting energy expenditure (REE) over 62 wk based on measured liver and spleen masses from the retrospective colorectal cancer patient cohort (n = 34). All calculations are based on an assumed liver-specific metabolic rate of 200 kcal · kg−1 · d−1 and a spleen-specific metabolic rate of 80 kcal · kg−1 · d−1. The original cachexia simulation (constant: 1.8 kg liver and 250 g spleen) (14) (dashed curve) can be contrasted with the cachexia simulation specifying the organ masses match the data at different time points from the retrospective cohort computed tomography images (Table 1) (solid curve). The healthy reference simulation in energy balance (constant: 1.8 kg liver and 250 g spleen) (dotted curve) and the reduced energy intake simulation (dashed dotted curve) are also shown (13).
We also plotted the relation between the percentage of FFM occupied by the liver and REE (kcal · kg FFM−1 · d−1) from the cachexia simulation incorporating the changes in organ mass from Table 1 (Figure 3B; solid line); this appeared to follow a relation similar to the prospective cohort.
DISCUSSION
Our study captured detailed progressive body-composition changes occurring in patients with colorectal cancer during disease progression until death. These changes were typified by exponential increases in the size of the liver and hepatic metastases, with concurrent accelerations of muscle and fat loss. The longitudinal CT image review provides a basis for a quantitative estimation of the contribution of visceral organs and metastases to REE. Our results suggest that a considerable catabolic influence underlying colorectal cancer cachexia is exerted by the energetic demands of liver and metastases and to a lesser extent the spleen. This is supported by estimates based on a computational model of human metabolism as well as direct measures of REE and body composition in patients with advanced colorectal cancer. In patients with extensive metastatic disease and organomegaly, these visceral changes could exert a quantitatively important catabolic effect by virtue of their size and consumption of energy. This increased energy expenditure occurs during the period of most rapid weight loss, but importantly, also in the end stages of anorexia and hence very low food intake, which likely results in a substantial energy deficit. In a healthy individual, energy balance is maintained by an increase in energy intake, but, in patients with advanced cancer, it may be difficult to envisage an increased energy expenditure being covered by an incremental oral intake in a population with reduced energy intakes sometimes less than basal metabolism (25). This increased energy expenditure and consequent energy imbalance should be included among the major causes of colorectal cancer cachexia in individuals with metastatic disease.
Cachexia has often been attributed to the catabolic actions of humoral mediators (ie, cytokines, proteolysis-inducing or lipolytic factors), insulin resistance, and low dietary intakes, as outlined in current review articles (1–3); consequently, most treatments have focused on these factors. In patients with substantial tumor burden and organomegaly, these treatments may have limited efficacy, because the primary problem (extensive disease burden) is not corrected by these agents. Quantitative analysis of disease burden may be included in future studies to help to explain why some treatments are ineffective in certain individuals.
Methodologic considerations
A longitudinal retrospective CT image review was a realistic approach to evaluate body-composition changes; patients had frequent scans throughout their illness and were not required to undergo additional testing for this research. Prospective studies of body composition using other methods are comparatively difficult to conduct because participation rates are low and withdrawal rates are high in patients with very advanced disease (26, 27). The group studied in the present study was not different from a regional cohort of patients who died of colorectal cancer with respect to disease characteristics, demographics, and body composition, and is thus likely a representative sample.
CT imaging allows discrimination between different FFM components (ie, muscle, liver, spleen), which appears important because we saw that different constituents change in opposite directions. These distinctions cannot be made with other methods, such as DXA or bioelectrical impedance. The quantification of organ volume with CT images is reasonably precise, and our interobserver CV values (3.6% for liver and 4.0% for spleen) are similar to previously reported values for organs (28). Muscle and adipose tissue areas determined from CT images have a typical CV of 1–2% (17), and whole-body tissue masses estimated from the CT images are correct to the nearest 3.5 kg for fat mass and 3.0 kg for FFM (17). One limitation of our analysis is the inability to quantitatively discriminate liver tissue and metastases. We suspect that the majority of progressive increases in liver were metastases; however, liver parenchyma has been reported to increase in patients with colorectal cancer with liver metastases (29), which may be connected with increased gluconeogenesis and synthesis of acute-phase proteins (4).
Our study was strengthened by the use of a mathematical model (13, 14) that allowed us to estimate the effect of organ mass changes on REE (Figure 5). Computational modeling is a new tool that can integrate clinical data and help to build a conceptual framework for the understanding of altered energy balance states. This is especially useful in contexts in which patient vulnerability limits the use of invasive tests and compliance is limited by disease progression. Using this model, we showed that the range of increases in REE computed with the new cancer cachexia simulation (up to 1900 kcal/d, or 39.7 kcal · kg FFM−1 · d−1) (Figure 5; solid line) is consistent with values reported for patients with advanced cancer (26, 30).
A further strength of our study was the simultaneous measurement of different FFM components and REE in the prospective cohort to explore the relation between body composition and REE in advanced colorectal cancer. This also provided information to help authenticate the results from the model. These data suggest that liver mass is proportional to REE (Figure 4A). The metabolic rate of the liver and metastases merits further study, because our results suggest that 200 kcal · kg−1 · d−1 may be a conservative estimate. There are several possible reasons for an increased liver-specific metabolic rate in this population. The liver plays a pivotal role in systemic inflammation, acute phase protein synthesis, and gluconeogenesis, which have been documented in advanced cancer (1, 31–33). Moreover, increases in tumor are associated with higher substrate turnover and oxygen consumption (34).
Implications of high metabolic rate tissues on body composition and REE
The largest observed changes in body composition in the retrospective cohort occurred between 4.2 and 1.2 mo from death. Liver increased and muscle decreased especially rapidly during this time. This resulted in a shift to an increased proportion of FFM occupied by higher-metabolic-rate tissues. In healthy populations, the relation between the proportions of higher metabolic rate organ mass relative to FFM has been found to explain some of the variance in REE (6, 7, 28). Our study affirms that this relation is quantitatively important in colorectal cancer cachexia and perhaps in other cancers, for which organomegaly and liver metastases are common.
Acknowledgments
We thank Pierrette Pham and Abigail Tonkin for assistance with the CT image analysis.
The authors' responsibilities were as follows—JRL, MM, KDH, LJM, and VEB: responsible for the study design; JRL, MM, KDH, and CMMP: involved with the data collection; JRL, MM, KDH and VEB: responsible for the data analysis; and JRL and VEB: drafted the manuscript. All of the authors approved the final manuscript. None of the authors had any conflicts of interest.
REFERENCES
- 1.Delano MJ, Moldawer LL. The origins of cachexia in acute and chronic inflammatory diseases. Nutr Clin Pract 2006;21:68–81 [DOI] [PubMed] [Google Scholar]
- 2.Laviano A, Meguid MM, Inui A, Muscaritoli M, Rossi-Fanelli F. Therapy insight: cancer anorexia-cachexia syndrome—when all you can eat is yourself. Nat Clin Pract Oncol 2005;2:158–65 [DOI] [PubMed] [Google Scholar]
- 3.Baracos VE. Cancer-associated cachexia and underlying biological mechanisms. Annu Rev Nutr 2006;26:435–61 [DOI] [PubMed] [Google Scholar]
- 4.Elia M. Tissue distribution and energetics in weight loss and undernutrition. Kinney J, Tucker H, eds Physiology, stress, and malnutrition: functional correlates, nutritional intervention. Philadelphia, PA: Lippincott-Raven, 1997:383–411 [Google Scholar]
- 5.Elia M. Organ and tissue contribution to metabolic rate. Kinney J, Tucker H, eds Energy metabolism: tissue determinants and cellular corollaries. New York, NY: Raven Press, 1992:61–77 [Google Scholar]
- 6.Gallagher D, Belmonte D, Deurenberg P, et al. Organ-tissue mass measurement allows modeling of REE and metabolically active tissue mass. Am J Physiol 1998;275:E249–58 [DOI] [PubMed] [Google Scholar]
- 7.Illner K, Brinkmann G, Heller M, Bosy-Westphal A, Muller MJ. Metabolically active components of fat free mass and resting energy expenditure in nonobese adults. Am J Physiol Endocrinol Metab 2000;278:E308–15 [DOI] [PubMed] [Google Scholar]
- 8.Heymsfield SB, McManus CB. Tissue components of weight loss in cancer patients: a new method of study and preliminary observations. Cancer 1985;55((suppl 1):)238–49 [DOI] [PubMed] [Google Scholar]
- 9.Taylor I. Adjuvant chemotherapy after resection of liver metastases from colorectal cancer. Eur J Cancer 2008;44:1198–201 [DOI] [PubMed] [Google Scholar]
- 10.Fordy C, Glover C, Henderson DC, Summerbell C, Wharton R, Allen-Mersh TG. Contribution of diet, tumour volume and patient-related factors to weight loss in patients with colorectal liver metastases. Br J Surg 1999;86:639–44 [DOI] [PubMed] [Google Scholar]
- 11.Zibari GB, Riche A, Zizzi HC, et al. Surgical and nonsurgical management of primary and metastatic liver tumors. Am Surg 1998;64:211–20(discussion 220–1) [PubMed] [Google Scholar]
- 12.Jebb SA, Osborne RJ, Dixon AK, Bleehen NM, Elia M. Measurements of resting energy expenditure and body composition before and after treatment of small cell lung cancer. Ann Oncol 1994;5:915–9 [DOI] [PubMed] [Google Scholar]
- 13.Hall KD. Computational model of in vivo human energy metabolism during semistarvation and refeeding. Am J Physiol Endocrinol Metab 2006;291:E23–37 [DOI] [PMC free article] [PubMed] [Google Scholar]
- 14.Hall KD, Baracos VE. Computational modeling of cancer cachexia. Curr Opin Clin Nutr Metab Care 2008;11:214–21 [DOI] [PMC free article] [PubMed] [Google Scholar]
- 15.Shen W, Punyanitya M, Wang Z, et al. Total body skeletal muscle and adipose tissue volumes: estimation from a single abdominal cross-sectional image. J Appl Physiol 2004;97:2333–8 [DOI] [PubMed] [Google Scholar]
- 16.Shen W, Punyanitya M, Wang Z, et al. Visceral adipose tissue: relations between single-slice areas and total volume. Am J Clin Nutr 2004;80:271–8 [DOI] [PMC free article] [PubMed] [Google Scholar]
- 17.Mourtzakis M, Prado CM, Lieffers JR, Reiman T, McCargar LJ, Baracos VE. A practical and precise approach to quantification of body composition in cancer patients using computed tomography images acquired during routine care. Appl Physiol Nutr Metab 2008;33:997–1006 [DOI] [PubMed] [Google Scholar]
- 18.Mitsiopoulos N, Baumgartner RN, Heymsfield SB, Lyons W, Gallagher D, Ross R. Cadaver validation of skeletal muscle measurement by magnetic resonance imaging and computerized tomography. J Appl Physiol 1998;85:115–22 [DOI] [PubMed] [Google Scholar]
- 19.Miller KD, Jones E, Yanovski JA, Shankar R, Feuerstein I, Falloon J. Visceral abdominal-fat accumulation associated with use of indinavir. Lancet 1998;351:871–5 [DOI] [PubMed] [Google Scholar]
- 20.Snyder WS, Cooke MJ, Manssett ES, Larhansen LT, Howells GP, Tipton IH. Report of the task group on reference man. Oxford, United Kingdom: Pergamon, 1975 [Google Scholar]
- 21.Duck FA. Physical properties of tissue: a comprehensive reference book. London, United Kingdom: Academic Press, 1990 [Google Scholar]
- 22.Weir JB. New methods for calculating metabolic rate with special reference to protein metabolism. J Physiol 1949;109:1–9 [DOI] [PMC free article] [PubMed] [Google Scholar]
- 23.Heymsfield SB, Wang Z, Baumgartner RN. Human body composition: advances in models and methods. Annu Rev Nutr 1997;17:527–58 [DOI] [PubMed] [Google Scholar]
- 24.Vaupel P, Wendling P, Thome H, Fischer TJ. Respiratory gas exchange and glucose uptake by the human spleen in situ (author's transl). Klin Wochenschr 1977;55:239–42 (in German) [DOI] [PubMed] [Google Scholar]
- 25.Hutton JL, Martin L, Field CJ, et al. Dietary patterns in patients with advanced cancer: implications for anorexia-cachexia therapy. Am J Clin Nutr 2006;84:1163–70 [DOI] [PubMed] [Google Scholar]
- 26.Harvie MN, Howell A, Thatcher N, Baildam A, Campbell I. Energy balance in patients with advanced NSCLC, metastatic melanoma and metastatic breast cancer receiving chemotherapy: a longitudinal study. Br J Cancer 2005;92:673–80 [DOI] [PMC free article] [PubMed] [Google Scholar]
- 27.Fouladiun M, Korner U, Bosaeus I, Daneryd P, Hyltander A, Lundholm KG. Body composition and time course changes in regional distribution of fat and lean tissue in unselected cancer patients on palliative care: correlations with food intake, metabolism, exercise capacity, and hormones. Cancer 2005;103:2189–98 [DOI] [PubMed] [Google Scholar]
- 28.Muller MJ, Bosy-Westphal A, Kutzner D, Heller M. Metabolically active components of fat-free mass and resting energy expenditure in humans: recent lessons from imaging technologies. Obes Rev 2002;3:113–22 [DOI] [PubMed] [Google Scholar]
- 29.Purkiss SF, Williams NS. Growth rate and percentage hepatic replacement of colorectal liver metastases. Br J Surg 1993;80:1036–8 [DOI] [PubMed] [Google Scholar]
- 30.Barber MD, Ross JA, Voss AC, Tisdale MJ, Fearon KC. The effect of an oral nutritional supplement enriched with fish oil on weight-loss in patients with pancreatic cancer. Br J Cancer 1999;81:80–6 [DOI] [PMC free article] [PubMed] [Google Scholar]
- 31.Falconer JS, Fearon KC, Ross JA, et al. Acute-phase protein response and survival duration of patients with pancreatic cancer. Cancer 1995;75:2077–82 [DOI] [PubMed] [Google Scholar]
- 32.Falconer JS, Fearon KC, Plester CE, Ross JA, Carter DC. Cytokines, the acute-phase response, and resting energy expenditure in cachectic patients with pancreatic cancer. Ann Surg 1994;219:325–31 [DOI] [PMC free article] [PubMed] [Google Scholar]
- 33.Fearon KC, Barber MD, Falconer JS, McMillan DC, Ross JA, Preston T. Pancreatic cancer as a model: inflammatory mediators, acute-phase response, and cancer cachexia. World J Surg 1999;23:584–8 [DOI] [PubMed] [Google Scholar]
- 34.Koea JB, Shaw JH. The effect of tumor bulk on the metabolic response to cancer. Ann Surg 1992;215:282–8 [DOI] [PMC free article] [PubMed] [Google Scholar]