Abstract
Microfilaments have been reported to be polarized in a number of cell types based both on function and isoform composition. There is evidence that microfilaments are involved in the movement of vesicles and the polarized delivery of proteins to specialized membrane domains. We have investigated the composition of actin microfilaments in gastrointestinal epithelial cells and their role in the delivery of the cystic fibrosis transmembrane conductance regulator (CFTR) into the apical membrane using cultured T84 cells as a model. We identified a specific population of microfilaments containing the tropomyosin (Tm) isoforms Tm5a and/or Tm5b, which are polarized in T84 cell monolayers. Polarization of this microfilament population occurs very rapidly in response to cell-cell and cell-substratum contact and is not inhibited by jasplakinolide, suggesting this involves the movement of intact filaments. Colocalization of Tm5a and/or Tm5b and CFTR was observed in long-term cultures. A reduction in Tm5a and Tm5b expression, induced using antisense oligonucleotides, resulted in an increase in both CFTR surface expression and chloride efflux in response to cAMP stimulation. We conclude that Tm isoforms Tm5a and/or Tm5b mark an apical population of microfilaments that can regulate the insertion and/or retention of CFTR into the plasma membrane.
INTRODUCTION
The establishment and maintenance of cell polarity is intrinsic to the function of an epithelial cell. The creation of these distinct functional domains relates to their role in providing a barrier and controlling ion and solute transport. Events leading to the development of this functional polarization include cell-cell contact mediated by E-cadherin and cell-extracellular matrix adherence mediated by integrins (Yeaman et al., 1999). The actin cytoskeleton, by virtue of its direct interaction with both integrin- and cadherin-containing complexes, plays a pivotal role in the establishment of epithelial cell polarity (Ku et al., 1999). Similarly, the actin filament system is responsible for targeting secretion in budding yeast (Pruyne et al., 1998). Thus, the actin cytoskeleton appears to play a role in the establishment of polarity in different phylla.
Polarized function of the actin cytoskeleton may go beyond specific interactions of actin filaments with integrin- and cadherin-containing complexes. There is increasing evidence that the isoform composition of actin filaments themselves can differ at different sites in a cell (Gunning et al., 1998). In gastric parietal cells, the β and γ actin isoforms are differentially distributed in the cell with β actin located predominantly at the more metabolically active apical surface (Yao et al., 1995). Similar polarization of β and γ actin is observed in adult neurons (Weinberger et al., 1996).
Polarization has been seen more extensively with the other major component of microfilaments, tropomyosin (Tm). Tm is a rod-like dimer that forms polymers running along the helical groove of the actin filament. A polarized distribution of intracellular Tm isoforms has been observed in gastrointestinal epithelial cells (Percival et al., 2000), fibroblasts (Lin et al., 1988; Percival et al., 2000), and neurons (Hannan et al., 1995; Schevzov et al., 1997). Gene transfection studies in neuroepithelial cells have demonstrated that Tm isoforms differentially regulate actin filament organization and cell shape (Bryce et al., 2003). It therefore appears that Tm isoform segregation can provide spatial specialization of actin filament function.
Polarization is also seen with yeast Tms (Pruyne et al., 1998), indicating that this may be an intrinsic property of the actin filament system in most if not all species. Genetic manipulation has further demonstrated that specific Tms are involved in the formation of yeast buds through involvement with vesicle movement (Pruyne et al., 1998). This provides support for a direct role of Tm isoforms in the generation and maintenance of polarity.
The cell cytoskeleton plays a role in the vectorial movement of chloride through epithelial cells (Matthews et al., 1992, 1995, 1997; Fuller et al., 1994; Prat et al., 1995; Tousson et al., 1996). This is particularly true of the apical chloride channel CFTR. The CFTR chloride channel contains sequences similar to the actin-binding domains found on the actin-binding proteins filamin and α actinin (Prat et al., 1995). Factors such as cytochalasin D that disrupt the actin cytoskeleton increase chloride currents through CFTR, whereas factors that prevent filament formation inhibit CFTR activity (Prat et al., 1995). In contrast, microtubular disruption causes a reduction in chloride efflux (Fuller et al., 1994) and prevents apical recruitment of CFTR (Tousson et al., 1996).
We have investigated the role of specific actin microfilament populations characterized by their association with specific Tm isoforms in the polarized delivery and function of the CFTR chloride channel. We report that segregation of Tm isoforms involves apical localization of Tm5a and Tm5b, which in turn impacts on CFTR insertion in the apical membrane.
MATERIALS AND METHODS
Reagents and Antibodies
Cytochalasin D, forskolin, 6-Methoxyquinolinium 1-acetic acid ethyl ester (MQAE), nocodazole, 3′3′5′5′ tetra methyl benzidine, 1,4-diazabicyclo[2.2.2.]octane (DABCO), poly-d-lysine, and 1% collagen were purchased from Sigma (St. Louis, MO). Lipofectin reagent and antisense oligonucleotides were purchased from Invitrogen (Mulgrave, Vic, Australia). Jasplakinolide was purchased from BioScientific (Gymea, NSW, Australia). Nitroblue tetrazolium chloride and 5-bromo-4-chloro-3-indolylphosphate p-toluidine salt (NBT and BCIP), tissue culture medium and reagents were purchased from Life Technologies (Mulgrave, Vic, Australia). The bicinchoninic acid (BCA) protein assay kit was purchased from Pierce (Rockford, IL). Thermanox coverslips and glass chamber slides were purchased from Medos (Mt. Waverley, Vic, Australia). Tissue culture plasticware was purchased from Interpath (Morrisville, NC). Western Lightening chemiluminescence reagent was purchased from Perkin Elmer-Cetus Life Sciences Inc (Boston, MA).
Rhodamine Red X conjugate and rhodamine goat anti-sheep IgG were from Jackson Immunoresearch (West Grove, PA). Horseradish peroxidase (HRP) anti-mouse and anti-rabbit IgG were from Amersham Life Sciences (Buckinghamshire, UK). The mouse monoclonal Tm antibodies 311 and the secondary antibody fluorescein isothiocyanate (FITC)-Donkey anti-mouse were from Sigma Aldrich (St. Louis, MO). Tm antibody CG3 was a gift from J.C. Lin (University of Iowa, Iowa City, IA). CFTR antibody (MA1–935) was from Affinity Bioreagents Inc. (Golden, CO). The mouse monoclonal antihuman, c-terminus specific, CFTR antibody was from BioScientific.
Cell Culture
Human T84 colonic carcinoma cells were seeded onto 2 chamber glass slides, 24- or 96-well plates, or glass coverslips coated with poly-d-lysine and 1% collagen. The T84 cells were obtained from the American Tissue Culture Laboratory (passage 60) and as a kind gift from Kim Barrett (San Diego, CA; passage 20). During the course of the research, they were subcultured to passage 80 and 30, respectively. T84 cells were cultured using the method of Li et al. (1999). They were incubated at 37°C with 5% CO2 in Dulbecco's modified Eagle medium-F12 (DMEM-F12; 1:1 mixture) medium containing l-glutamine and 15 mM HEPES and supplemented with 10% fetal bovine serum (FBS) and 1% penicillin-streptomysin. Confluent monolayers were subcultured every 7–10 d using trypsin-EDTA in Ca2+- and Mg2+-free phosphate-buffered saline (PBS).
The viability of T84 cells after treatments was assessed using a trypan blue exclusion assay. Posttreatment, the T84 cell monolayers were washed gently with PBS and stained with 1% trypan blue for 10 min. The cells were examined immediately by phase contrast microscopy. Treated and control monolayers were compared by counting the number of cells with trypan blue uptake in random microscopy fields.
Immunofluorescence Analysis
Cells were washed in 2% fetal bovine serum (FBS) in PBS and then fixed with 4% paraformaldehyde. They were permeabilized with 100% methanol chilled to -80°C, for 20 min. Cells were incubated at room temperature with primary and secondary antibodies for 1 h with washes performed with 2% FBS in PBS three times for 10 min after each incubation. Coverslips were mounted onto the slides with the antifade reagent DABCO (2.6 g of DABCO added to 90 ml of glycerol and 10 ml of PBS).
Fluorescence Microscopy
Fluorescence was examined with a confocal laser scanning microscope (Leica Microsystems, Wetzler, Germany) using a 63× oil immersion objective. The distribution of fluorophores was measured by scanning at 488 nm for FITC and 568 nm for rhodamine using 8 line averages to eliminate noise. Images were taken in the vertical (xz) and horizontal (xy) plane. Images in the horizontal plane were constructed by overlaying sections taken at 1-μm steps from the apical to the basal region of the cells.
The pixel intensity of Tm antibody staining was measured on images obtained by confocal microscopy. Measurements were made across the apical region and across the central region of monolayers using a line scan and averaged to obtain the mean pixel intensity for individual monolayers. The areas to be scanned were determined at random using the 311 image and the identical areas were then scanned in the αf9d image in order to maintain objectivity. The line of measurement included up to 10 cells in the monolayer. The distribution of antibody staining within individual monolayers is described as the ratio of the mean pixel intensity in the apical region to the mean pixel intensity in the central region of that monolayer. To determine the relative distribution of αf9d and 311 antibody staining, the apical:central mean pixel intensity ratios for αf9d and 311 were compared in costained monolayers, using Student's t test for paired samples.
The apical pixel intensity of αf9d staining of monolayers treated with antisense and nonsense oligonucleotides was determined using a line scan across the apical region of the cell. The area to be scanned was determined using the costained 311 image in order to maintain objectivity. All measurements were undertaken in the same session using identical confocal microscope intensity settings to allow comparison of absolute pixel intensity values. The mean pixel intensities were compared using Student's t test for unpaired samples.
Antibody Staining of Histological Specimens
Rat duodenal tissue specimens were fixed in 4% paraformaldehyde saline and stored in 70% ethanol at 4°C until embedded in paraffin. Sections were dewaxed in xylol and rehydrated stepwise in graded ethanols (100%, 100%, 70%, water). Antigen retrieval was performed by boiling the specimens in 1× citrate buffer (10× citrate buffer: 5g/l EDTA, 2.5g/l Tris base, and 3.2 g/l tri-sodium citrate; pH 8.0), microwaving on high for 12 min and then allowing to cool. The specimens were washed twice in PBS and blocked with 10% FBS in PBS for 10 min. Primary antibodies were then applied overnight at room temperature. Specimens were washed twice in PBS for 5 min before application of the secondary antibodies. Secondary antibodies were applied for 1 h after which the specimens were washed once in PBS for 5 min and once with alkaline phosphate buffer (10 ml of 0.1 M Tris, pH 9.5, 5 ml of 1 M MgCl, and 2 ml of 5 M NaCl) for 5 min. The substrate containing NBT and BCIP was then applied for 40–60 min after which specimens were washed once with PBS for 5 min. Specimens were then counterstained with Nuclear Fast Red for 1 min after which they were rinsed twice in distilled water, dehydrated in increasing grades of ethanol (70%, 100%, 100%, 100%), cleared with xylol, and coverslipped.
Cell Treatment with Jasplakinolide, Cytochalasin, and Nocodazole during Monolayer Formation
Epithelial cell monolayers were trypsinized using trypsin/EDTA and centrifuged to form a cell pellet. The cells were then resuspended in medium containing either 1 μM jasplakinolide (Matthews et al., 1997), 20 μM cytochalasin D, or 33 μM nocodazole and seeded into poly-d-lysine and collagen-coated glass chamber slides. The developing monolayers were then fixed and stained at 10 min after seeding. The effect of nocodazole on microtubules was confirmed by staining with antibodies to β tubulin and comparing with untreated cells. Mature T84 cell monolayers were treated with medium containing 20 μM cytochalasin D for 3 h and then fixed and stained. Immunofluorescence analysis was then performed as described above.
Antisense Oligonucleotides
The sequence of the antisense and nonsense phosphorothioated oligonucleotides to Tm5a and Tm5b were 5′-CAC CGC CUC CAG CGA GCT and 5′-GCT CCA GCC ACG CCG ACT, respectively. These were designed from the exon 1b sequence of the αTMfast gene (Novy et al., 1993). T84 cell monolayers were grown to confluence on coverslips, in glass chamber slides or 24-well plates. The oligonucleotides were applied at a concentration of 2 μM with Lipofectin Reagent at 10 μg/ml according to the manufacturer's instructions. The T84 cell monolayers were then incubated with the oligonucleotide for 24 h at 37°C in 5% CO2 after which time they were used for experiments that required oligonucleotide pretreatment.
Immunoblot Analysis of Tropomyosin Isoforms
Proteins were extracted from T84 cells using the method of Wessel and Flugge (1984). The frozen cell pellet was thawed on ice and resuspended in 150 μl of DTT solubilization buffer. After 5 min incubation at 95°C, the solution was cooled on ice and then centrifuged at 15,000 rpm for 30 s to remove cellular debris. Supernatant, 150 μl, was transferred to a new tube and 600 μl of methanol was added. The tube was vortexed and 150 μl chloroform was added, and the tube again vortexed. Water, 450 μl, was added to the solution and the tubes were centrifuged for 5 min at 15,000 rpm. The upper aqueous layer was discarded and 450 μl of methanol was added. The tubes were vortexed and then centrifuged for 5 min at 15,000 rpm. The supernatant was removed, and the pellets were air dried. DTT, 50–70 μl, solubilization buffer was added and the tubes were incubated at 37°C overnight to aid in solubilization. Proteins were stored at -20°C. Western blot was performed as described (Percival et al., 2000). In brief, proteins were fractionated by SDS-PAGE using 15% low bis acrylamide gels, transferred to polyvinylidene difluoride membranes, and probed with Tm antibodies. Bound antibody was detected using HRP-conjugated goat anti-rabbit or goat anti-mouse IgG. The bands were detected using Western Lightening chemiluminescence reagent and exposure to x-ray film.
Protein expression was measured as the density of protein bands on Western blot autoradiographs using the computer program Molecular Analyst (Version 1.5, Bio-Rad Laboratories, Richmond, CA). The protein band density is reported as the protein band density normalized to the protein band density for the control group within individual experiments. To determine the effects of treatment, normalized protein band density was compared with the null hypothesis value of 1 by the one-sided Student's t test.
MQAE Chloride Efflux Assay
T84 cell monolayers, cultured on 24- or 96-well plates, were incubated in medium containing 10 mM MQAE for 16 h. The monolayers were then washed three times in chloride buffer (2.4 mM Na2HPO4, 0.6 mM NaH2PO4, 1 mM K2SO4, 1 mM MgSO4, 3.4 mM KCl, 124.6 mM NaCl, 1 mM CaCl2, 10 mM glucose, and 10 mM HEPES). T84 cell monolayers were stimulated with forskolin by incubating with chloride buffer containing 10 μM forskolin for 10 min, after which the chloride buffer was removed and replaced with chloride-free buffer (2.4 mM Na2HPO4, 0.6 mM NaH2PO4, 1 mM K2SO4, 1 mM MgSO4, 3.4 mM KNO3, 1 mM Ca(NO3)2, 124.6 mM NaNO3, 10 mM glucose, and 10 mM HEPES) containing 10 μM forskolin. Repetitive fluorescence measurements were initiated immediately using a fluorescence plate reader (excitation, λ-360 nm; emission, λ-460 nm). Measurements were performed every 30– 60 s for 15 min.
Chloride efflux was measured as the percentage increase in fluorescence between baseline and the specified time point. The percentage increase in fluorescence was normalized within experiments to the mean percentage increase in fluorescence in the control group in that experiment. To determine the effects of treatments, the normalized percentage increase in fluorescence was compared between groups. Two group comparisons were made using the Student's t test.
Enzyme-linked Surface CFTR Assay
T84 cell monolayers cultured on collagen-coated glass coverslips were incubated in either chloride buffer with 10 μM forskolin or chloride buffer only for 30 min at 37°C in 5% CO2 and then fixed with 4% paraformaldehyde for 20 min at 4°C. The T84 cell monolayers were incubated for 1 h first with CFTR (MA1–935) antibody (Walker et al., 1995) diluted 1:500, followed by HRP anti-mouse IgG diluted 1: 1000. T84 cell monolayers were blocked before each incubation for 10 min in PBS containing 10% FBS and washed after each incubation four times in PBS. The coverslips were then placed into a clean 24-well plate and incubated for 30 min with 500 μl of 3′3′5′5′ tetra methyl benzidine. The supernatant from each well was transferred to a cuvette and absorbance determined at 655 nm in a Beckman DU650 spectrophotometer. Absorbance was also determined at 655 nm for primary antibody negative controls and that amount was subtracted from the absorbance in primary antibody positive monolayers to determine their assay result.
The CFTR surface expression is reported as the absorbance measured at 655 nm, normalized to the mean absorbance for the control group within individual experiments. To determine the effects of treatment, normalized absorbance at 655 nm was compared between groups. Two group comparisons were made using the Student's t test.
RESULTS
Tropomyosin Gene Expression and Antibody Specificity in T84 Cells
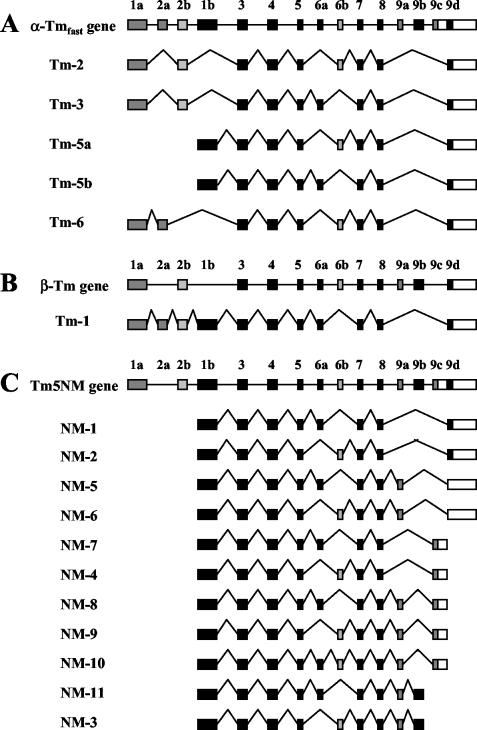
Tm proteins are encoded by four distinct genes. The antibodies used in this study were capable of detecting specific isoforms that are produced from three Tm genes. The exon/intron structure of these genes is shown in Figure 1. The αf9d antibody detects Tm 1, 2, 3, 5a, 5b, and 6 (Schevzov et al., 1997). The 311 antibody detects a subset of Tms detected by the αf9d antibody, namely Tm 1, 2, 3, and 6. The CG3 antibody detects Tm5NM1–11 (Novy et al., 1993; Dufour et al., 1998).
Figure 1.
Maps of three tropomyosin (Tm) genes and their nonmuscle, nonbrain product(s). Exons are shown as shaded boxes, the 3′ untranslated sequence as unshaded boxes and the introns are represented by lines. (A) The α gene (α-Tmf). Note that exon 1b is unique to Tm5a and Tm5b. (B) The β-Tm gene, (C) The γ gene (Tm5NM products). (Taken from Temm-Grove CJ et al., 1998 and Percival et al., 2000)
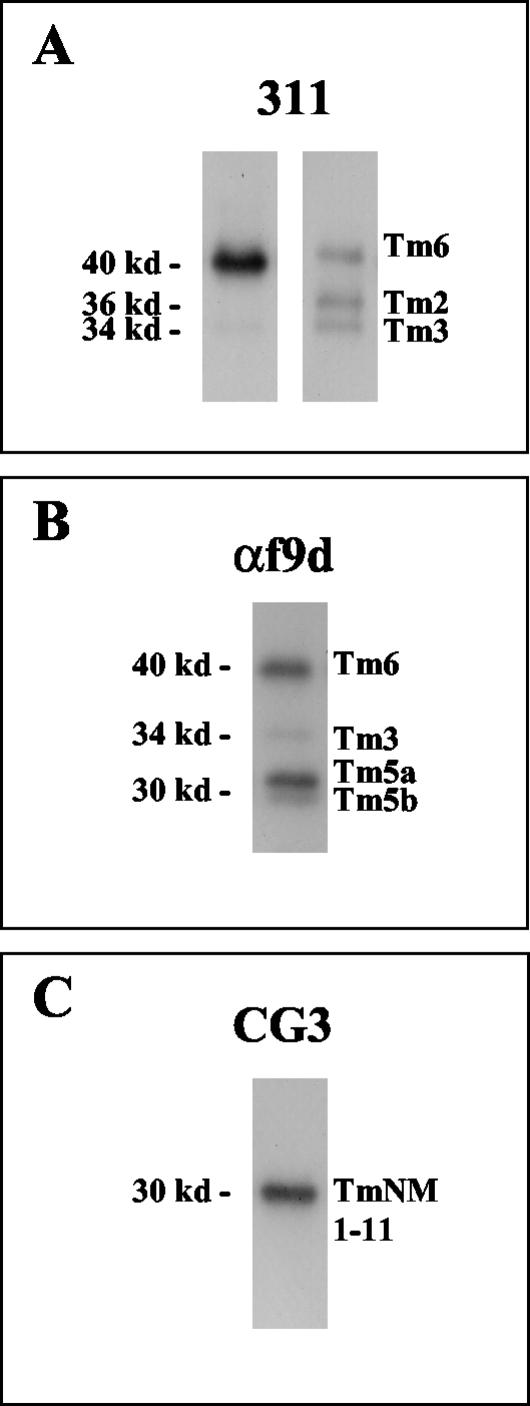
In human fibroblasts, the 311 antibody detected three bands. Bands were seen at 40, 36, and 34 kDa corresponding to Tm 6, 2, and 3, respectively (Figure 2A). In T84 cells, the 311 antibody detected only the bands at 40 and 34 kDa corresponding to Tm 6 and 3 (Figure 2A). The αf9d antibody detected four bands in T84 cells with bands seen at 40 and 34 kDa corresponding to Tm6 and Tm3 and a double band at 30 kDa corresponding to Tm's 5a and 5b (Percival et al., 2000; Figure 2B). The CG3 antibody detected a single band at 30 kDa corresponding to comigrating Tm5NM isoforms (Percival et al., 2000; Figure 2C).
Figure 2.
Tropomyosin antibody specificity. Tropomyosin antibody specificity in T84 cells and human fibroblasts are shown in Western blots. The specificities of 311 in T84 cells (left) and fibroblasts (right) are shown in A and the specificities of αf9d and CG3 antibodies are shown in B and C respectively. The 311 antibody detects Tm6 (40 kDa), Tm2 (36 kDa) and Tm3 (34 kDa) in human fibroblasts. Tm2 is absent and Tm3 is quite minor in T84 cells. Tm1 (36 kDa) was absent from both T84 cells and human fibroblasts (A). αf9d detects Tm6 (40 kDa), Tm3 (34 kDa), Tm5a (30 kDa) and Tm5b (30 kDa) in T84 cells (B). CG3 antibody detects 11 possible isoforms (Tm5NM1–11) that comigrate at 30 kDa and shows a single band in T84 cells composed of an unknown number of isoforms (C).
T84 Cell Monolayers Express a Polarized Distribution of Tm5a and Tm5b
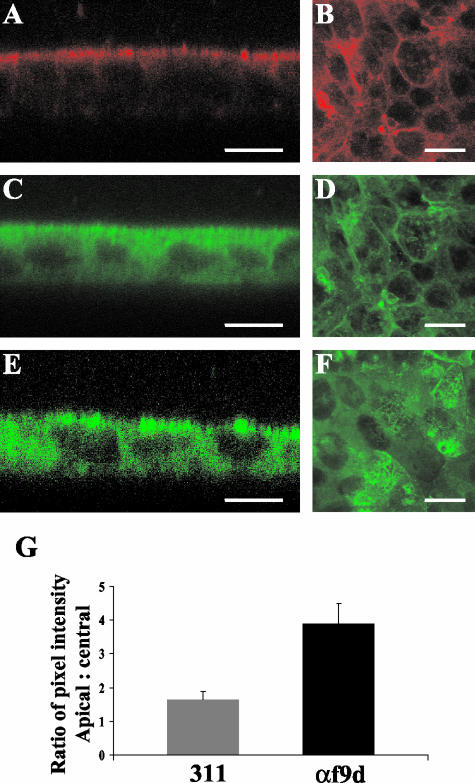
To determine the distribution of the separate microfilament populations in T84 cells, eight monolayers stained with each antibody were examined in both the vertical and horizontal planes by confocal microscopy. Representative images are presented in Figure 3. The αf9d antibody, which detects Tm 3, 5a, 5b, and 6, was found to have predominant staining at the apical pole of the cells (Figure 3A). However, the 311 antibody, which recognizes Tm 3 and 6, was found to have a more uniform distribution from the apical to basal pole of the same cells (Figure 3C). This differential staining pattern can only be explained by the existence of a highly polarized distribution of the two isoforms detected by αf9d, which are not detected by 311 (i.e., Tm5a and Tm5b). We therefore conclude that Tm5a and Tm5b are highly enriched at the apical surface. The antibody CG3, which stains Tm5NM 1–11, was distributed throughout the cell (Figure 3E).
Figure 3.
T84 cell monolayers express a polarized distribution of Tm5a and Tm5b. (A–F) Mature T84 cell monolayers were labeled with αf9d (A and B), 311 (C and D) and CG3 (E and F) antibodies. A-D is the same monolayer costained with αf9d and 311. The antibody distribution was analyzed by Confocal Laser Scanning Microscopy. Images in the vertical plane (xz) are shown on the left and images in the horizontal plane (xy) are shown on the right. The differential staining pattern between αf9d and 311 represents Tm5a and/or Tm5b. Bar, 10 μm. (G) The mean apical and central pixel intensity was measured across the apical and central region of the individual monolayers. The apical:central mean pixel intensity ratios for αf9d and 311 were compared in costained monolayers and are represented as the mean ± SD for each group. Results represent the average of 8 costained monolayers.
In sections through the epithelial monolayer taken in the horizontal plane, the distribution of αf9d (Figure 3B) and 311 (Figure 3D) were found to be associated with the lateral cell membrane and a paucity of staining was seen in the cytoplasm. CG3 was found to be located in the cytoplasm surrounding the cell nucleus (Figure 3F).
The quantitative analysis of the relative distribution of αf9d and 311 antibody staining, which is depicted in Figure 3G, confirmed the qualitative differences described above. Because the nuclei occupy a large portion of the cell, measurement of the central region across nuclei could not be avoided. Because this was the same for both the 311 and αf9d antibodies, it was felt not to affect the validity of the comparison. The mean ratio of apical to central pixel intensity for the αf9d antibody was significantly higher than that of the 311 antibody (3.88 ± 0.60 vs. 1.64 ± 0.23; p < 0.001).
The Polarized Distribution of Specific Microfilament Populations Varies with Epithelial Cell Differentiation in the Rat Duodenum
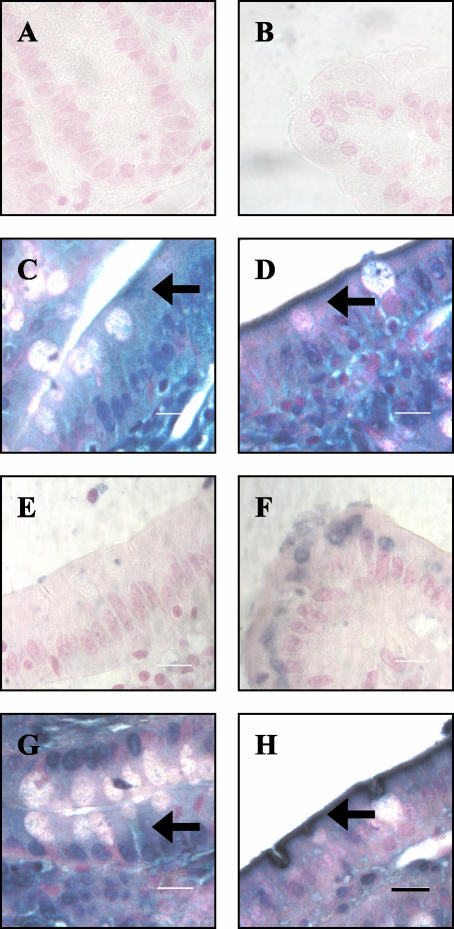
To determine whether the distribution of Tm isoforms observed in T84 cells differed from that seen in vivo in both crypt and villus gastrointestinal epithelial cells, rat duodenal tissue specimens were stained for Tm isoforms and examined with brightfield microscopy. Representative sections are shown in Figure 4. Staining with the αf9d antibody showed diffuse staining in the crypt epithelium (Figure 4C, arrow). The staining in the more differentiated villus epithelium was highly enriched in the apical region but also was seen throughout the cytoplasm (Figure 4D, arrow). Staining with the 311 antibody (Tm 3 and 6) was sparse in the crypt epithelium (Figure 4E). In the villus epithelium, the blue staining was seen in a circular area located above the nucleus (Figure 4F). Staining with the CG3 antibody (Tm5NM 1–11) showed a distribution similar to that seen with the αf9d antibody. In the crypt epithelial cells, the staining was diffuse throughout the cell (Figure 4G), whereas in the villus epithelial cells there was strong enrichment of staining in the apical region (Figure 4H). In the goblet cells, which are predominantly found in the crypts, the staining was diffuse outside of the characteristic mucinous vacuole (Figure 4G).
Figure 4.
Localization of tropomyosin isoforms in the crypts and villi of the rat duodenum. Sections of rat duodenal tissue were fixed and stained with αf9d (C and D), 311 (E and F) and CG3 (G and H) antibodies. Sections through the crypts are on the left and sections through the villi are on the right. A and B represent antibody negative controls. Arrows indicate gastrointestinal epithelial cells. Immunoreactivity is indicated by the blue staining and slides were counterstained with Nuclear fast red. Bar, 10 μm.
These results demonstrate that Tm isoforms are polarized in the more differentiated villus epithelial cells and are not polarized in the less differentiated crypt epithelial cells. Importantly, the relative distributions of αf9d antibody and 311 antibody staining in duodenal villus epithelial cells indicates that Tm5a and Tm5b are polarized in vivo in the same way they are polarized in the T84 cell model.
Polarized Distribution of Specific Microfilament Populations Occurs in the Early Phases of Monolayer Formation
The time sequence over which the polarized distribution of αf9d staining occurs was examined at 10 min, 1, 2, and 24 h after seeding T84 cells. Three experiments were performed for each time point. Tm isoform expression was examined by performing Western blots on protein extracted from T84 cells collected at 1, 2, 4, and 24 h and 7 d postseeding. Four experiments were performed at each time point.
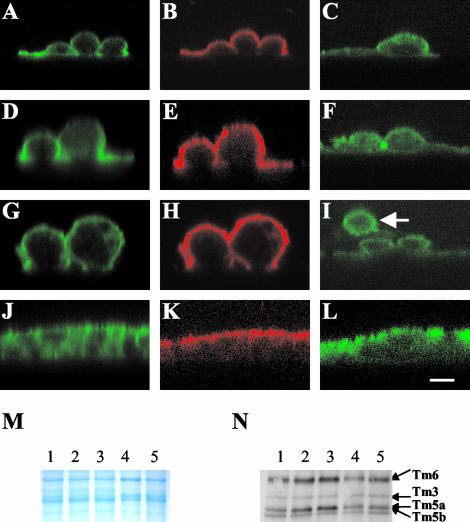
Representative confocal microscopy images are shown in Figure 5. In T84 cells seen in suspension, αf9d, 311, and CG3 (Figures 6, A and B, and 5I, arrow and our unpublished results) antibody staining was circumferential. Ten minutes after seeding (Figure 5, A–C), the T84 cells were generally observed to make cell-cell contact and cell-slide contact. For all antibodies, there was reduced staining at the site of cell-slide contact at this initial time point, although staining is more apparent for CG3 and 311 than for αf9d. Further, αf9d antibody staining appeared to be limited to the free surface, whereas 311 antibody staining was more prominent at the site of cell-cell contact. In contrast, CG3 antibody staining was more evenly distributed over both the free surface and sites of cell-cell contact. Over time, the distribution of αf9d staining was basically unchanged (Figure 5, E, H, and K), with enriched staining at the free surface (reflecting Tm5a and Tm5b) and lower level diffuse staining resembling that of 311 (reflecting Tm6 and Tm3). In contrast, the distribution of 311 antibody staining (Figure 5, D, G, and J) and CG3 antibody staining (Figure 5, F, I, and L) both became more evenly distributed throughout the cell to include all surfaces and the cytoplasm.
Figure 5.
The development of polarization of tropomyosin isoforms. (A-L) immunofluorescence confocal microscopy images of T84 cells stained for tropomyosin isoforms at various time points after seeding. All images are in the vertical (xz) plane. At each time point, the images on the left and in the center are of the same costained cells. On the left (A, D, G, and J) the 311 antibody (Tm 3, 6) staining is shown. In the center (B, E, H, and K) the αf9d antibody (Tm 3, 5a, 5b, 6) staining is shown. The cells on the right (C, F, I, L) are stained with CG3 antibody (TmNM1–11). (A, B, and C) 10 min; (D, E, and F) 1 h; (G, H, and I) 2 h; (J, K, and L) 24 h. The arrows indicates a T84 cell in suspension with circumferential staining. Bar, 10 μm. (M and N) Total protein and specific tropomyosin isoform expression during T84 cell monolayer development. Protein was extracted from T84 cells 1, 2, 4, and 24 h and 7 d after seeding. (M) Gel stained with Coomassie blue showing total protein. (N) Western blot immunoblotted with αf9d antibody (Tm 3, 5a, 5b, 6).
Figure 6.
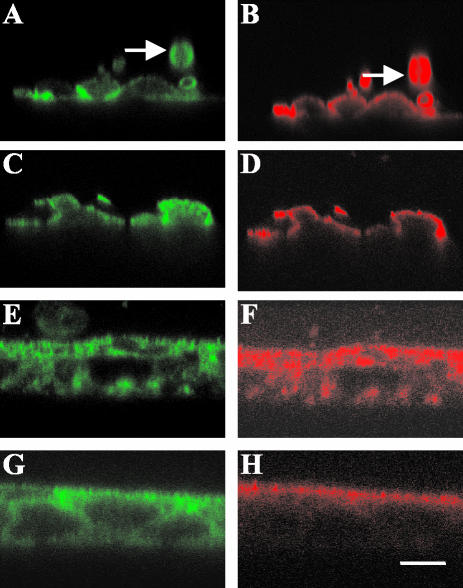
Localization of tropomyosin isoforms in T84 cells after treatment with jasplakinolide or nocodazole. Immunofluorescent confocal microscopy images of T84 cells stained for tropomyosin isoforms 10 min (A–D)or 7 d (E–H) after cell seeding. All images are in the vertical (xz) plane. Cells on the left (A, C, E, and G) are stained with 311 antibody (Tm 3,6) and cells on the right (B, D, F, and H) are stained with αf9d antibody (Tm 3, 5a, 5b, 6). (A and B) Cells treated with 1 μM jasplakinolide 10 min before plating. (C and D) Cells treated with 33 μM nocodazole 10 min before plating. (E and F) T84 cell monolayers treated with 20 μM cytochalasin D for 3 h. The arrows indicate a T84 cell in suspension with circumferential staining of both 311 and αf9d antibody. (G and H) T84 cell monolayers treated with DMSO alone. Bar, 10 μm.
Western blot analysis did not show any significant differences in protein expression levels during monolayer formation (Figure 5N). Therefore, changes in levels of these isoforms cannot account for the alterations in staining of the αf9d and 311 antibodies. These alterations in isoform distribution are therefore most likely to result from altered targeting of these proteins.
The Early Polarized Distribution of Tm5a and Tm5b Does Not Involve Filament Turnover and Is Not Microtubule Dependent
Possible mechanisms for the development of microfilament polarization were explored by drug manipulation of the cytoskeleton during seeding. Jasplakinolide was used to stabilize actin filaments, cytochalasin D was used to fragment actin filaments, and nocodazole was used to disrupt microtubules. These drugs were applied to the T84 cells while they were in suspension, 10 min before plating. Cells were examined 10 min after plating.
Pretreatment of T84 cells with jasplakinolide before seeding altered cell morphology. The T84 cells had a flattened appearance (Figure 6A) compared with untreated cells (Figure 5A). In the T84 cells pretreated with jasplakinolide, the distribution of both αf9d (Figure 6B) and 311 (Figure 6A) antibody staining 10 min postseeding was similar to that of the control T84 cells (Figure 5, A and B). The distribution of αf9d antibody remained apical, whereas the 311 antibody distribution appeared more prominent at the sites of cell-cell contact. Pretreatment of T84 cells with cytochalasin D before seeding prevented cell-slide adherence, and no images were obtained. However, treatment of established monolayers with cytochalasin D eliminated the polarized distribution of αf9d staining, indicating that its maintenance requires an intact actin cytoskeleton (Figure 6F).
Pretreatment of the T84 cells with nocodazole before seeding altered cell morphology. The T84 cells changed from having a curved surface (Figure 5A) to having an irregular appearance (Figure 6C). The distribution of the αf9d (Figure 6D) antibody staining in nocodazole-treated T84 cells 10 min postseeding was similar to that of untreated T84 cells. Staining with the 311 antibody appeared similar to that of the αf9d antibody with enrichment at the apical surface and paucity of staining at the site of cell contact with the slide (Figure 6C), in contrast to enrichment at sites of cell-cell contact in untreated cells (Figure 5A). Staining for β tubulin confirmed that nocodazole had disrupted normal microtubule structure (our unpublished results).
These results suggest that the early polarization of Tm5a and Tm5b does not involve filament turnover because the actin-stabilizing agent jasplakinolide did not affect the early development of polarization. In addition, intact microtubules are not required because polarization of Tm5a and Tm5b occurred despite microtubule disruption with nocodazole. However, microtubules may be involved in relocation of Tm3 and Tm6 to sites of cell-cell contact or their stabilization at that site.
Tm5a and Tm5b Colocalize with Membrane Inserted CFTR But Not CFTR Contained in Subapical Vesicles
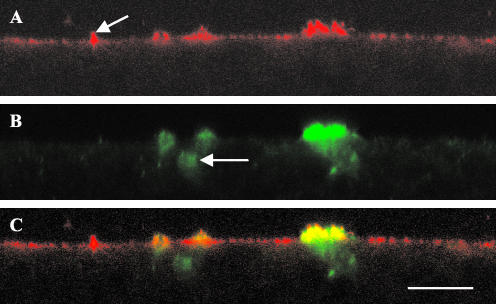
Staining of T84 cells with the CFTR antibody (Figure 7B) demonstrated variable expression of CFTR across the monolayers with cells expressing CFTR consistently seen in clusters. CFTR was seen in two forms. Some cells demonstrated prominent apical staining, with the CFTR appearing to protrude at the apical membrane. However, we cannot conclude that the apical membrane is different at these sites because we have not specifically stained for the apical membrane. CFTR was also seen as smaller dots (Figure 7B, arrow) located in the cell cytoplasm, giving the appearance of a location within vesicle-like structures. Costaining with the αf9d antibody revealed the typical polarized appearance of apical enrichment in addition to sites of very intense apical staining projecting above the surrounding level of staining. These highly enriched sites of αf9d staining were coincident with the sites of apparent membrane incorporation of CFTR (Figure 7C). The Tm's therefore appeared to be associated with a structure containing CFTR. All sites of membrane staining of CFTR were associated with these intense sites of αf9d staining. However, not all sites of intense αf9d staining showed significant CFTR staining, suggesting that αf9d antibody staining is associated with sites available for CFTR insertion. The αf9d antibody did not colocalize with the CFTR contained within the cytoplasm.
Figure 7.
immunofluorescence confocal microscopy images of T84 cell monolayers costained for tropomyosin isoforms and CFTR. All images are in the vertical plane. (A) αf9d antibody (Tm 3, 5a, 5b, and 6). The arrow indicates an area of enriched αf9d staining in the apical membrane not associated with CFTR; (B) CFTR antibody; (C) Overlay of image A and image B. Yellow highlights areas of colocalization. Bar, 10 μm.
Tm5a and Tm5b Antisense Oligonucleotides Alter the Intensity of Apical Staining of αf9d in T84 Cell Monolayers
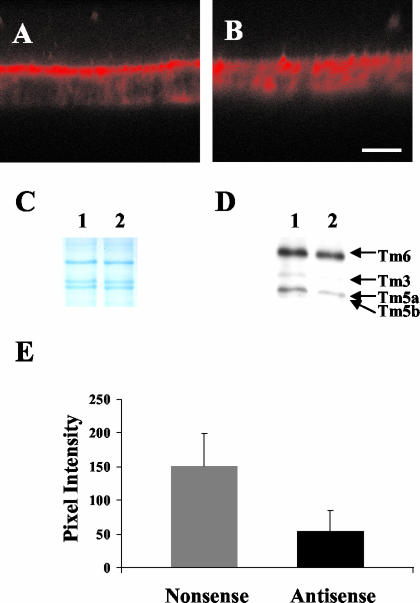
Previous studies have shown that cytochalasin D–induced disruption of actin filaments increase chloride currents through CFTR (Prat et al., 1995), and we have observed that cytochalasin D also disrupts the polarized distribution of αf9d staining (Figure 6F). We therefore reasoned that the actin filaments marked by αf9d, which colocalize with CFTR might inhibit chloride secretion through CFTR. To test this, we treated T84 cell monolayers with an antisense oligonucleotide or a scrambled nonsense control. Western blot analysis showed a substantial reduction in Tm5a and Tm5b levels after 24-h exposure to the oligonucleotide (Figure 8D). Relative to nonsense treatment, the antisense produced a mean reduction in Tm5a and Tm5b levels of 54 ± 13% (p = 0.02). Although Figure 8D appears to also show a small difference in Tm3 expression, this is not statistically significant. On trypan blue exclusion assay, no difference in cell viability was observed between treated and control monolayers, with <1% cell death found.
Figure 8.
Effect of antisense and nonsense oligonucleotides against Tm5a and Tm5b on the distribution of αf9d antibody staining in T84 cell monolayers. Immunofluorescent confocal microscopy images of T84 cell monolayers. Both images are in the vertical plane. Both monolayers have been stained with αf9d (Tm3, 5a, 5b, and 6). (A) Nonsense oligonucleotide 2 μM for 24 h; (B) Antisense oligonucleotide 2 μM for 24 h. Bar, 10 μm. (C and D) Western blot showing the effect of antisense and nonsense oligonucleotides against Tm5a and Tm5b on T84 cells. Protein was extracted from T84 cell monolayers following treatment with either 2 μM antisense or nonsense oligonucleotides against Tm5a and Tm5b for 24 h. (C) Gel stained with Coomassie blue showing total protein. (D) Western blot immunoblotted with the αf9d antibody (Tm3, 5a, 5b, and 6). (E) Effect of antisense and nonsense oligonucleotides against Tm5a and Tm5b on intensity of apical staining with αf9d antibody in T84 cell monolayers. The apical αf9d antibody staining pixel intensity was determined by confocal microscopy in T84 cell monolayers treated with either 2 μM antisense or nonsense oligonucleotides for 24 h. The area to be scanned was determined using the costained 311 image in order to maintain objectivity. All measurements were undertaken in the same session using identical confocal microscope intensity settings to allow comparison of absolute pixel intensity values. The mean ± 1SD for each group is depicted. (Nonsense 150.86 ± 48.28, Antisense 53.62 ± 31.62; p < 0.001)
The treatment of T84 cultures with antisense oligonucleotide eliminated the polarized distribution of αf9d staining, which became largely even throughout the cell (Figure 8B). In contrast, the nonsense oligonucleotide had essentially no effect on the distribution of staining with αf9d (Figure 8A). The redistribution of staining induced by the antisense oligonucleotide was paralleled by a reduction in pixel intensity of αf9d staining at the apical surface (Figure 8E). This is consistent with a decrease in the level of polarized Tms detected by the αf9d antibody.
In conclusion, treatment with an antisense oligonucleotide to exon 1b of the α tropomyosin gene resulted in a significant reduction in apical staining with the αf9d antibody. These results further support the conclusion that the prominent apical αf9d antibody staining in untreated T84 cell monolayers is due to a polarized distribution of Tm5a and Tm5b.
Tm5a and Tm5b Antisense Oligonucleotides Increase CFTR Surface Expression and Chloride Efflux
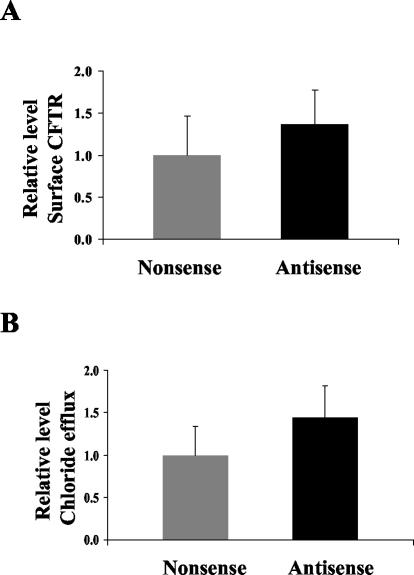
Antisense reductions of Tm5a and Tm5b levels and elimination of the polarized distribution of αf9d staining provided the opportunity to assess the role of these molecules in CFTR surface expression. On immunohistochemistry the appearance of CFTR at the apical surface and within the cytoplasm did not vary with antisense treatment compared with control. The variable expression of CFTR across each monolayer made it difficult to use immunohistochemistry to objectively assess CFTR expression levels. Using the CFTR surface expression assay, we found that antisense oligonucleotide treatment resulted in a 50% increase in CFTR surface expression (1.49 ± 0.78 vs. 1 ± 0.42; p < 0.001; Figure 9A). This suggests that the presence of Tm5a and Tm5b is acting as a barrier to CFTR insertion into the apical membrane.
Figure 9.
Effect of antisense and nonsense oligonucleotides against Tm5a and Tm5b on cell surface expression of CFTR and chloride efflux in T84 cell monolayers. (A) Enzyme linked CFTR surface expression assays were performed on T84 cell monolayers treated with either 2 μM antisense or nonsense oligonucleotides for 24 h. CFTR expression is represented by absorbance at 655 nm, normalized to the mean absorbance of the nonsense treated group within individual experiments. Fourteen monolayers were examined in each group. The mean ± 1 SD for each group is depicted. (Nonsense 1 ± 0.42, Antisense 1.49 ± 0.78; p < 0.001). (B) MQAE chloride efflux assays were performed on T84 cell monolayers treated with either 2 μM antisense or nonsense oligonucleotides against Tm5a and Tm5b. Cumulative chloride efflux at 15 min is represented by the mean percentage increase in fluorescence from baseline, normalized to the mean percentage increase of the nonsense group, within individual experiments. Twenty nine monolayers were examined in each group. The mean ± 1 SD for each group is depicted. (Nonsense 1 ± 0.36, Antisense 1.47 ± 0.41; p < 0.001)
The increase in CFTR surface expression was paralleled by an increase in chloride efflux from antisense treated cells. In total, 29 T84 cell monolayers were treated with 2 μM antisense for 24 h and were compared with 29 T84 cell monolayers treated with 2 μM nonsense for 24 h. After antisense and nonsense treatment, an MQAE chloride efflux assay was performed. The results are depicted in Figure 9B. The T84 cell monolayers treated with antisense had significantly higher relative fluorescence measurement than T84 cell monolayers treated with nonsense after 15 min of 10 μM forskolin stimulation (1.47 ± 0.41 vs. 1 ± 0.36; p < 0.001). This increase in chloride efflux quantitatively parallels the increase in surface CFTR.
Microtubule Disruption Has No Effect on CFTR Surface Expression in T84 Cell Monolayers
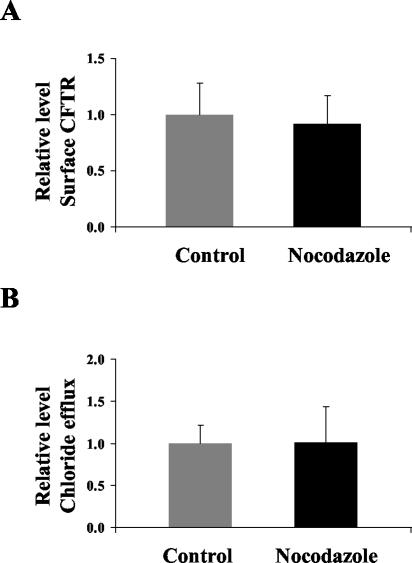
The impact on CFTR surface levels and chloride efflux by antisense treatment of Tms was not paralleled by disruption of microtubules. Incubation of T84 cells with nocodazole failed to elicit any significant change in either CFTR surface expression (Figure 10A) or any chloride efflux (Figure 10B). We conclude that these parameters are sensitive to disruption of the microfilament but not microtubule systems when assayed under short-term conditions. This correlates well with a more important role for actin filaments rather than microtubules in regulating either the insertion of vesicle cargoes into the apical membrane or their recycling from the membrane.
Figure 10.
Effect of nocodazole treatment on cell surface expression of CFTR and chloride efflux in T84 cell monolayers. Enzyme linked CFTR surface expression assays were performed on forskolin stimulated T84 cell monolayers with and without treatment with 33 μM nocodazole for 3 h. CFTR expression is represented by absorbance at 655 nm, normalized to the mean absorbance of the control group within individual experiments. Six monolayers were examined in each group. The mean ± SD for each group is depicted. (Control 1.00 ± 0.29, Nocodazole 0.92 ± 0.25; p = 0.64). (B) MQAE chloride efflux assays were performed on control T84 cell monolayers and T84 cell monolayers treated with nocodazole 33 μM for 3 h. Cumulative chloride efflux at 15 min is represented by the mean percentage increase in fluorescence from baseline, normalized to the mean percentage increase of the control group, within individual experiments. Ten monolayers were examined in each group. The mean ± SD for each group is depicted. (Control 1.00 ± 0.22, Nocodazole 1.01 ± 0.43; p = 0.93)
DISCUSSION
Tropomyosin Isoform Sorting in Establishing Epithelial Cell Polarity
The actin cytoskeleton is known to play a role in the generation of cytoskeletal polarity in epithelial cells (Yeaman et al., 1999). Within the developing epithelial cell monolayer, the actin cytoskeleton strengthens the cellsubstratum interaction and forms a scaffold for signaling networks that include kinases and protein-tyrosine phosphatases (Drubin and Nelson, 1996). These spatial cues result in separation of proteins into contacting and noncontacting membrane domains. The actin cytoskeleton varies in its composition within these domains, thus giving rise to specialized functions. In parallel with the results of Temm-Grove et al. (1998), we found that Tm isoforms become more polarized with increasing differentiation. Tm isoforms are more polarized in the highly differentiated villus epithelium compared with the less differentiated crypt epithelium in rat duodenal tissue. The sorting of Tm isoforms into microfilaments with differing functional properties in different cell types suggests this is a mechanism involved in both the creation and maintenance of cellular compartments (Gunning et al., 1998).
Drugs that interact with the cytoskeleton are widely used to examine cellular processes. By using these techniques, we were able to examine the mechanism by which epithelial cells were rapidly able to sort Tm isoforms. In the developing monolayer jasplakinolide, a drug that prevents the breakdown and turnover of actin filaments, did not affect the early polarization of Tm5a and Tm5b. In mature monolayers cytochalasin D, which fragments actin filaments, disrupted the polarized distribution of Tm5a and Tm5b. These findings are supported by those of other investigators. Studies in neurons using cytochalasin B have also confirmed the need for intact microfilaments to maintain tropomyosin isoform segregation between neurites and growth cones (Schevzov etal., 1997). Percival et al. (2000) observed differential disruption of stress fibers containing different Tms in fibroblasts. Low-dose cytochalasin D resulted in disruption of stress fibers containing Tm 1, 2, 3, 6, 5a, and 5b but not those containing Tm5NM isoforms. These data are all consistent with an association of different Tms with different actin filament populations and that it is the resulting microfilaments that are required to maintain sorting into different compartments.
The sorting of Tm isoforms found in our study occurred very rapidly. Within 10 min, specific Tm isoforms became polarized in their distribution. Other investigators have also found that changes in Tm and actin structure and composition occurs early in the development of cell structure. In a study by Temm-Grove et al. (1998), specific Tm isoform localization occurred as soon as 15 min after being microinjected into an epithelial cell. They found that Tm5 localized rapidly to the adhesion belt between adjacent cells. Other studies have examined expression levels with time. In G0 syncronized fibroblasts, segregation of Tm5NM isoforms from Tm 1, 2, 3, 6, 5a, and 5b occurs in <1 h after plating (Percival et al., 2000). In developing neurones, Tm5NM 1/2 mRNA was found to localize to the pole of the cell, which later elaborates the axon, thus forming an early marker of neuronal polarity (Hannan et al., 1995). We therefore conclude that cells of various types are capable of rapidly altering the Tm composition of microfilaments at different intracellular sites. These findings implicate Tm isoform segregation in early stages of cell attachment and the development of polarization.
Role of Tm5a and Tm5b in Regulating CFTR Function
The actin cytoskeleton is closely linked with CFTR function. Not only does the structure of membrane bound CFTR depend on actin and its binding proteins (Chasan et al., 2002), but interaction with actin regulates cAMP-stimulated chloride secretion through CFTR (Prat et al., 1995; Chasan et al., 2002). The actin disrupting agent Cytochalasin D results in activation of CFTR, whereas prevention of filament formation using DNAse 1 inhibits cAMP-stimulated chloride secretion via CFTR (Prat et al., 1995). Prat et al. (1999) have subsequently demonstrated that the three-dimensional nature of actin induced by the interaction of the actin cross-linking protein ABP-280 and actin is necessary for cAMP induced activation of CFTR.
Although links between the function of CFTR and actin are well established, the role of the actin cytoskeleton in the recruitment of CFTR into the apical membrane is not as clear. In the present study we found that reduction in expression of Tm5a and Tm5b resulted in increased surface expression of CFTR. This was supported by our in vivo observation that Tm5a and Tm5b were highly polarized in rat duodenal epithelial cells of the villus but not the crypts. It is known that expression of CFTR on the apical surface is higher in epithelial cells of the crypts compared with those of the villus (Ameen et al., 1995). Others have shown that filamentous actin (F actin) is not rearranged in the process of recruitment of subapical CFTR into the apical membrane (Ameen et al., 1999) and that cytochalasin D, which fragments large actin filaments, does not interfere with this process (Tousson et al., 1996). Tm5a and Tm5b may, however, be associated with a subpopulation of smaller actin filaments, which are directly involved in subapical CFTR recruitment into the apical membrane rather than with all actin filaments in this location.
There are three possible mechanisms that may explain how Tm5a and Tm5b regulate CFTR insertion into the apical membrane. First, Tm5a and Tm5b containing microfilaments may act as a physical barrier to vesicle movement toward the apical surface of the epithelial cell. We have recently shown that the Tm isoform composition of actin filaments can regulate the activity of actin depolymerizing factor/cofilin (ADF; Bryce et al., 2003). Removal of Tm5a and Tm5b may change the susceptibility of actin filaments to cleavage by ADF and in turn promote vesicle movement and insertion of CFTR into the membrane. Second, Tm5a and Tm5b containing microfilaments may not act as a physical barrier to vesicle movement but may inhibit the movement of vesicles along actin filaments. The movement of vesicles along actin filaments is an active process that requires the interaction of actin and myosin. Tm5a and Tm5b may inhibit this interaction. If this were the case, the presence of Tm5a and Tm5b in the apical region may inhibit the delivery of CFTR vesicles to the apical membrane. Conversely, depolarization of Tm5a and Tm5b would be expected to increase the delivery of CFTR to the apical membrane. There is in vitro evidence that Xtm4, the Xenopus homologue of Tm5b, inhibits the actin and myosin interaction in an isoform-specific manner (Fanning et al., 1994). Similarly, Pelham et al. (1996) have also shown that Tm3, but not Tm5NM1, stimulates retrograde organelle transport (Pelham et al., 1996). Finally, Tm5a and Tm5b associated microfilaments may be involved in the process of endocytic cycling of surface proteins. A study by Gottlieb et al. (1993) found that microfilaments play a role in the endocytosis of proteins at the apical membrane of epithelial cells. From their observations, they hypothesized that microfilaments form part of a mechanochemical motor that is involved in either moving microvillar membrane components toward the intervillar spaces or providing the force to convert membrane pits into endocytic vesicles. If the microfilaments involved in these processes contain Tm5a and Tm5b, then the removal of Tm5a and Tm5b may result in reduced ability to endocytose proteins such as CFTR from the apical membrane.
Of the possible underlying mechanisms, a role for Tm isoforms in the recruitment of subapical vesicles containing CFTR into the apical membrane is strongly supported by the growing body of evidence that Tms contribute to vesicle transport. The most convincing evidence comes from the study of budding yeast cells, which contain two Tm isoforms (Pruyne et al., 1998). In these cells, the polarized delivery of secretory vesicles are directed by Tm containing actin cables (Pruyne et al., 1998). It has been postulated that myosin motors, which are known to actively transport secretory vesicles (Schott et al., 2002), move along these Tm-containing actin filaments (Evangilista et al., 2002). Less direct evidence of a role for Tms in vesicle transport comes from a number of observations that link Tm with myosin. Nonmuscle Tm isoforms have been reported to modulate myosin function (Strand et al., 2001). Bryce et al. (2003) found that hTm5NM1 recruited myosin heavy chain isoform IIA into stress fibers causing changes to lamellipodia and cellular migration in the neuronal cell line B35. More specific to epithelial cells such as those used in the present study is the findings by Fanning et al. (1994) that high and low molecular weight Tms differentially regulated myosins found in the epithelial cell brush border. These along with the findings in the present study support the view that the actin cytoskeleton plays a role in the local delivery of vesicle cargo to the apical membrane (Nelson, 2003).
Acknowledgments
We thank Zhe Li, Janelle Mercieca, Sandra Cooper, and members of the Oncology Research Unit especially Ron Weinberger, Geraldine O'Neil, and Nicole Bryce for their advice and technical assistance. We also thank Jim Lin (University of Iowa, Iowa City, IA) for the CG3 antibody. This work was supported by the Australian National Health and Medical Research Council (NHMRC) grants to P.G. and T.O. J.D.-P. was supported by a NHMRC Medical Postgraduate Research Scholarship. P.G. is a Principal Research Fellow of the NHMRC.
References
- Ameen, N.A., Ardito, T., Kashgarian, M., and Marino, C.R. (1995). A unique subset of rat and human intestinal villus cells express the cystic fibrosis transmembrane conductance regulator. Gastroenterology 108, 1016-1023. [DOI] [PubMed] [Google Scholar]
- Ameem. N.A., Martensson, B., Bourguinon, L., Marino, C., Isenberg, J., McLaughlin, G. E. CFTR. (1999). channel insertion to the apical surface in rat duodenal villus epithelial cells is upregulated by VIP in vivo. J. Cell Sci. 112, 887-894. [DOI] [PubMed] [Google Scholar]
- Bryce, N.S., et al. (2003). Specification of actin filament function and molecular composition by tropomyosin isoforms. Mol. Biol. Cell. 14, 1002-1016. [DOI] [PMC free article] [PubMed] [Google Scholar]
- Chasan, B., Geisse, N.A., Pedatella, K. Wooster, D.G., Teintze, M., Carattino, M.D., Goldmann, W.H., Cantiello, H.F. (2002). Evidence for direct interaction between actin and the cystic fibrosis transmembrane conductance regulator. Eur. Biophys. J. 30, 617-624. [DOI] [PubMed] [Google Scholar]
- Drubin, D.G., and Nelson, W.J. (1996). Origins of cell polarity. Cell 84, 335-344. [DOI] [PubMed] [Google Scholar]
- Dufour, C., Weinberger, R.P., Schevzov, G., Jeffrey, P.L., and Gunning, P. (1998). Splicing of two internal and four carboxyl-terminal alternative exons in nonmuscle tropomyosin 5 pre-mRNA is independently regulated during development. J. Biol. Chem. 273, 18547-18555. [DOI] [PubMed] [Google Scholar]
- Evangelista, M., Pruyne, D., Amberg, D.C., Boone, C., and Bretscher, A. (2002). Formins direct Arp2/3-independent actin filament assembly to polarize cell growth in yeast. Nat. Cell Biol. 4, 32-41. [DOI] [PubMed] [Google Scholar]
- Fanning, A.S., Wolenski, J.S., Mooseker, M.S., and Izant, J.G. (1994). Differential regulation of skeletal muscle myosin-II and brush border myosin-I enzymology and mechanochemistry by bacterially produced tropomyosin isoforms. Cell Motil. Cytoskel. 29, 29-45. [DOI] [PubMed] [Google Scholar]
- Fuller, C.M., Bridges, R.J., and Benos, D.J. (1994). Forskolin- but not ionomycin-evoked Cl-secretion in colonic epithelia depends on intact microtubules. Am. J. Physiol. 266, C661-C668. [DOI] [PubMed] [Google Scholar]
- Gottlieb, T.A., Ivanov, I.E., Adesnik, M., and Sabatini, D.D. (1993). Actin microfilaments play a critical role in endocytosis at the apical but not the basolateral surface of polarized epithelial cells. J. Cell Biol. 120, 695-710. [DOI] [PMC free article] [PubMed] [Google Scholar]
- Gunning, P., Hardeman, E., Jeffrey, P., and Weinberger, R. (1998). Creating intracellular structural domains: spatial segregation of actin and tropomyosin isoforms in neurons. Bioessays 20, 892-900. [DOI] [PubMed] [Google Scholar]
- Hannan, A.J., Schevzov, G., Gunning, P., Jeffrey, P.L., and Weinberger, R.P. (1995). Intracellular localization of tropomyosin mRNA and protein is associated with development of neuronal polarity. Mol. Cell Neurosci. 6, 397-412. [DOI] [PubMed] [Google Scholar]
- Ku, N.O., Zhou, X., Toivola, D.M., and Omary, M.B. (1999). The cytoskeleton of digestive epithelia in health and disease. Am. J. Physiol. 277, G1108-G1137. [DOI] [PubMed] [Google Scholar]
- Li, Z., Elliot, E., Payne, J., Isaacs, J., and Gunning, P. (1999). O'Loughlin, E. V. Shiga Toxin-Producing Escherichia coli can impair T84 cell structure and function without inducing attaching/effacing lesions. Infect. Immun. 67, 5938-5945. [DOI] [PMC free article] [PubMed] [Google Scholar]
- Lin, J.J.-C., Hegmann, T.E., and Lin, J.L.-C. (1988). Differential localization of tropomyosin isoforms in cultured nonmuscle cells. Mol. Biol. Cell 107, 563-572. [DOI] [PMC free article] [PubMed] [Google Scholar]
- Matthews, J.B., Awtrey, C.S., and Madara, J.L. (1992). Microfilament-dependent activation of Na+/K+/Cl- cotransport by cAMP in intestinal epithelial monolayers. J. Clin. Invest. 90, 1608-1613. [DOI] [PMC free article] [PubMed] [Google Scholar]
- Matthews, J.B., Tally, K.J., and Smith, J.A. (1995). Activation of intestinal Na-K-2Cl contransport by 5′-AMP requires F-actin remodeling. Am. J. Surg. 169, 50-55. [DOI] [PubMed] [Google Scholar]
- Matthews, J.B., Smith, J.A., and Hrnjez, B.J. (1997). Effects of F-actin stabilization or disassembly on epithelial Cl- secretion and Na-K-2Cl cotransport. Am. J. Physiol. 272, C254-C262. [DOI] [PubMed] [Google Scholar]
- Nelson, W.J. (2003). Adaptation of core mechanisms to generate cell polarity. Nature 422, 766-774. [DOI] [PMC free article] [PubMed] [Google Scholar]
- Novy, R.E., Lin, J.L., Lin, C.S., and Lin, J.J. (1993). Human fibroblast tropomyosin isoforms: characterization of cDNA clones and analysis of tropomyosin isoform expression in human tissues and in normal and transformed cells. Cell Motil. Cytoskel. 25, 267-281. [DOI] [PubMed] [Google Scholar]
- Pelham, R.J., Jr., Lin, J.J.-C., and Wang, Y. (1996). A high molecular mass non-muscle tropomyosin isoform stimulates retrograde organelle transport. J. Cell Sci. 109, 981-989. [DOI] [PubMed] [Google Scholar]
- Percival, J.M., Thomas, G., Cock, T.A., Gardiner, E.M., Jeffrey, P.L., Lin, J.J., Weinberger, R.P., Gunning, P. (2000). Sorting of tropomyosin isoforms in synchronised NIH 3T3 fibroblasts: evidence for distinct microfilament populations. Cell Motil. Cytoskel. 47, 189-208. [DOI] [PubMed] [Google Scholar]
- Prat, A.G., Xiao, Y.F., Ausiello, D.A., and Cantiello, H.F. (1995). cAMP-independent regulation of CFTR by the actin cytoskeleton. Am. J. Physiol. 268, C1552-C1561. [DOI] [PubMed] [Google Scholar]
- Prat, A.G., Cunningham, C.C., Jackson, G.R., Borkan, S.C., Wang, Y., Ausiello, D.A., and Cantiello, H.F. (1999). Actin filament organization is required for proper cAMP-dependent activation of CFTR. Am. J. Physiol. 277, C1160-C1169. [DOI] [PubMed] [Google Scholar]
- Pruyne, D.W., Schott, D.H., and Bretscher, A. (1998). Tropomyosin-containing actin cables direct the Myo2p-dependent polarized delivery of secretory vesicles in budding yeast. J. Cell Biol. 143, 1931-1945. [DOI] [PubMed] [Google Scholar]
- Schevzov, G., Gunning, P., Jeffrey, P.L., Temm-Grove, C., Helfman, D.M., Lin, J.J., and Weinberger, R.P. (1997). Tropomyosin localization reveals distinct populations of microfilaments in neurites and growth cones. Mol. Cell. Neurosci. 8, 439-454. [DOI] [PubMed] [Google Scholar]
- Schott, D.H., Collins, R.N., and Bretscher, A. (2002). Secretory vesicle transport velocity in living cells depends on the myosin-V lever arm length. J. Cell Biol. 156, 35-39. [DOI] [PMC free article] [PubMed] [Google Scholar]
- Strand, J., Nili, M., Homsher, E., and Tobacman, L.S. (2001). Modulation of myosin function by isoform-specific properties of Saccharomyces cerevisiae and muscle tropomyosins. J. Biol. Chem. 276, 34832-34839. [DOI] [PubMed] [Google Scholar]
- Temm-Grove, C.J., Jockusch, B.M., Weinberger, R.P., Schevzov, G., and Helfman, D.M. (1998). Distinct localizations of tropomyosin isoforms in LLC-PK1 epithelial cells suggests specialized function at cell-cell adhesions. Cell Motil. Cytoskel. 40, 393-407. [DOI] [PubMed] [Google Scholar]
- Tousson, A., Fuller, C.M., and Benos, D.J. (1996). Apical recruitment of CFTR in T-84 cells is dependent on cAMP and microtubules but not Ca2+ or microfilaments. J. Cell Sci. 109, 1325-1334. [DOI] [PubMed] [Google Scholar]
- Walker, J., Watson, J., Holmes, C., Edelman, A., and Banting, G. (1995). Production and characterisation of monoclonal and polyclonal antibodies to different regions of the cystic fibrosis transmembrane conductance regulator (CFTR): detection of immunologically related proteins. J. Cell Sci. 108, 2433-2444. [DOI] [PubMed] [Google Scholar]
- Weinberger, R., Schevzov, G., Jeffrey, P., Gordon, K., Hill, M., and Gunning, P. (1996). The molecular composition of neuronal microfilaments is spatially and temporally regulated. J. Neurosci. 16, 238-252. [DOI] [PMC free article] [PubMed] [Google Scholar]
- Wessel, D., and Flugge, U.I.A. (1984). method for the quantitative recovery of protein in dilute solution in the presence of detergents and lipids. Anal. Biochem. 138, 141-143. [DOI] [PubMed] [Google Scholar]
- Yao, X., Chaponnier, C., Gabbiani, G., and Forte, J.G. (1995). Polarized distribution of actin isoforms in gastric parietal cells. Mol. Biol. Cell 6, 541-557. [DOI] [PMC free article] [PubMed] [Google Scholar]
- Yeaman, C., Grindstaff, K.K., and Nelson, W.J. (1999). New perspectives on mechanisms involved in generating epithelial cell polarity. Physiol. Rev. 79, 73-98. [DOI] [PubMed] [Google Scholar]


