

Abstract
The Ovarian Cancer Association Consortium selected 7 candidate single nucleotide polymorphisms (SNPs), for which there is evidence from previous studies of an association with variation in ovarian cancer or breast cancer risks. The SNPs selected for analysis were F31I (rs2273535) in AURKA, N372H (rs144848) in BRCA2, rs2854344 in intron 17 of RB1, rs2811712 5′ flanking CDKN2A, rs523349 in the 3′ UTR of SRD5A2, D302H (rs1045485) in CASP8 and L10P (rs1982073) in TGFB1. Fourteen studies genotyped 4,624 invasive epithelial ovarian cancer cases and 8,113 controls of white non-Hispanic origin. A marginally significant association was found for RB1 when all studies were included [ordinal odds ratio (OR) 0.88 (95% confidence interval (CI) 0.79-1.00) p = 0.041 and dominant OR 0.87 (95% CI 0.76-0.98) p = 0.025]; when the studies that originally suggested an association were excluded, the result was suggestive although no longer statistically significant (ordinal OR 0.92, 95% CI 0.79-1.06). This SNP has also been shown to have an association with decreased risk in breast cancer. There was a suggestion of an association for AURKA, when one study that caused significant study heterogeneity was excluded [ordinal OR 1.10 (95% CI 1.01-1.20) p = 0.027; dominant OR 1.12 (95% CI 1.01-1.24) p = 0.03]. The other 5 SNPs in BRCA2, CDKN2A, SRD5A2, CASP8 and TGFB1 showed no association with ovarian cancer risk; given the large sample size, these results can also be considered to be informative. These null results for SNPs identified from relatively large initial studies shows the importance of replicating associations by a consortium approach.
Keywords: association study, neoplasms, ovarian cancer, replication, single nucleotide polymorphism
Known high penetrance susceptibility genes such as BRCA1 and BRCA2 explain less than 40% of the excess familial risk of epithelial ovarian cancer.1 The unexplained familial risk could be due to common low or moderately penetrant alleles.2 To identify these alleles, genetic association studies comparing frequencies of single nucleotide polymorphisms (SNPs) between cases and controls have been widely used, leading to the identification of several moderate risk alleles for some cancer types.3-5 However, most reported associations have not been replicated by subsequent studies,6,7 demonstrating that large sample sizes are needed to both identify and characterize as well as to refute genetic associations at convincing levels of statistical significance.8,9 A consortium approach, in which several different studies are combined for the analysis of candidate disease-associated alleles offers a possible solution with improved power and protection from publication bias.10
We have established the Ovarian Cancer Association Consortium (OCAC) in an effort to clarify the role of previously reported candidate SNPs associated with ovarian cancer risk. The OCAC is an international collaboration comprising more than 5,000 ovarian cancer cases and 9,000 controls.11 An important role of the OCAC and other consortia is replication of findings from individual member studies. Here, we evaluated 7 SNPs that reportedly confer variable ovarian and breast cancer risks in the genes AURKA, BRCA2, CASP8, CDKN2A, RB1, SRD5A2 and TGFB1 (Table I).11-13,15,17,19
TABLE I.
PUBLISHED ODDS RATIOS FOR 7 CANDIDATE SNPS IN OVARIAN AND/OR BREAST CANCER
| Gene | SNP | DiseaseRef | Cases | Controls | Het OR (95% CI) | Hom OR (95% CI) | p value (2 d.f.) | Dom OR (95% CI) | p value (dominant) |
|---|---|---|---|---|---|---|---|---|---|
| AURKA | rs2273535 | Ovary12* | 1,821 | 2,467 | - | - | - | 1.17 (1.02-1.35) | p = 0.03 |
| BRCA2 | rs144848 | Ovary13* | 1,121 | 2,643 | 1.01 (0.87-1.18) | 1.36 (1.04-1.77) | p = 0.03 | - | - |
| Ovary serous13* | 480 | 2,643 | - | 1.66 (1.17-2.54) | p = 0.005 | - | - | ||
| Breast14 | 3,459 | 3,074 | 1.00 (0.93-1.08) | 1.31 (1.07-1.61) | p = 0.026 | - | - | ||
| RB1 | rs2854344 | Ovary15* | >1,500 | 4,800 | - | - | - | 0.73 (0.61-0.89) | p = 0.0009 |
| Breast16 | 4,199 | 4,426 | - | - | - | 0.86 (0.76-0.96) | p = 0.007 | ||
| CDKN2A | rs2811712 | Ovary11* | 1,493 | 2,494 | 0.98 (0.83-1.16) | 1.91 (1.07-3.42) | p = 0.42 | - | - |
| SRD5A2 | rs523349 | Ovary17* | 1,466 | 1,821 | 1.16 (1.00-1.36) | 1.70 (1.35-2.16) | p < 0.0001 | - | - |
| Ovary17* | 1,479 | 2,452 | 0.93 (0.80-1.07) | 1.12 (0.89-1.40) | p > 0.05 | - | - | ||
| CASP8 | rs1045485 | Breast18 | 5,708 | 6,351 | 0.90 (0.82-1.00) | 0.73 (0.52-1.02) | p = 0.016 | - | - |
| Breast19 | 16,000 | 17,000 | 0.89 (0.85-0.94) | 0.73 (0.60-0.90) | p = 1.1 × 10⁻⁷ | - | - | ||
| TGFB1 | rs1982073 | Breast18 | 5,587 | 6,863 | 1.06 (0.92-1.22) | 1.20 (1.07-1.43) | p = 0.088 | - | - |
| Breast19 | 13,000 | 15,000 | 1.07 (1.02-1.13) | 1.16 (1.08-1.25) | p = 2.8 × 10⁻⁵ | - | - |
Het OR, heterozygotes vs. common homozygotes; Hom OR, rare homozygotes vs. common homozygotes; Dom OR, heterozygotes and rare homozygotes vs. common homozygotes.
indicates that these data are included in current analyses.
Many types of cancers, including those of the breast, colon, prostate, endometrium and ovary show amplification and over-expression of AURKA, which encodes a serine/threonine kinase AURORA-A. A candidate SNP (rs2273535) in AURKA has been associated with an increased ovarian cancer risk12 and other cancers.20 This SNP causes a nonconservative amino acid substitution F31I in an evolutionary conserved region of the NH2 terminal domain of AURKA. This domain has been proposed to function in translocation of AURKA from cytoplasm to centrosome during mitosis.21 The I31 allele of AURKA has been shown to have reduced binding to UBE2N, and also transforms rat cells more potently than the F31 allele.22
Deleterious mutations in the BRCA2 gene confer high-risk susceptibility to ovarian cancer. BRCA2 is involved in DNA double strand break repair pathways and is critical to maintaining genomic integrity. The SNP rs144848 creates a nonconservative amino acid substitution (N372H) in a region of the protein that has been shown to interact with the histone acetyltransferase P/CAF.14 The HH genotype has been associated with increased risk of both ovarian and breast cancer.13,14 However, this latter result was not confirmed in a consortium study of more than 15,000 breast cancer cases and 15,000 controls.18
Retinoblastoma 1 (RB1) is somatically mutated and/or shows loss of function in many cancer types. Approximately 60% of epithelial ovarian cancers show abnormal RB1 function; and survival in ovarian cancer cases showing intact RB1 may be significantly better than for cases in which the RB1 pathway is abrogated.23,24 A SNP in intron 17 (rs2854344) is contained within an open reading frame that encodes a G protein coupled receptor P2RY5 in reverse orientation to the transcription of RB1.25 The rare allele of this SNP may confer a protection against both breast and ovarian cancer.15,16
The cyclin-dependent kinase inhibitor 2A (CDKN2A) gene, functions in the cell cycle control pathway, and a 5′ flanking SNP (rs2811712) was associated with a marginally increased risk of ovarian cancer for the rare homozygote group.11 This SNP is also of interest, because it may confer susceptibility to aging.26 There is substantial evidence of a role for CDKN2A in ovarian tumor development. The gene is frequently deleted in ovarian cancer cell lines and primary tumors, and shows loss of expression and hyper-methylation.27 Homozygous deletions of CDKN2A and the neighboring CDKN2B genes have been associated with a poor prognosis in ovarian cancer patients.28
The product of the steroid-5-α-reductase (SRD5A2) gene catalyses the conversion of testosterone to the more biologically active dihydrotestosterone. Testosterone may have a role in causing polycystic ovary disease (PCOS), a condition that is characterized by high levels of androgen29 and has been associated with ovarian cancer development.30 The nonsynonymous SNP V89L (rs523349) of SRD5A2 appears to affect the rate of testosterone conversion.31 In a recent study, rs523349 was associated with an increase in ovarian cancer risk although another SNP (rs632148; in the 3′ UTR) in linkage disequilibrium (r2 = 0.9) showed no association.17
There are known similarities in the genetic predisposition to both breast and ovarian cancer; for example, high risk mutations in the genes BRCA1 and BRCA2 as well as several SNPs showing associations with both breast and ovarian cancer risk.1,15,16 Therefore, we also selected 2 SNPs as candidates that had been shown to have a highly significant association with breast cancer risk in a large consortium study.19 CASP8 encodes caspase 8, one of the initiator caspases that transduce apoptotic signals from the death receptors at the cell surface. The SNP rs1045485 results in an amino acid change D302H in exon 12. This SNP is associated with a reduced risk in breast cancer in a dose-dependent manner,18,32-34 a result that was confirmed in a larger study.19 Finally,transforming growth factor β1(TGFB1) is a dimeric cytokine and a potent inhibitor of proliferation of epithelial, endometrial and hematopoietic cells. It acts as a tumor suppressor, but can also promote tumor progression.35-38 The rs1982073 SNP causes a L10P amino acid change that has been associated with increased secretion of TGFB1.39 It was shown to be associated with an increased risk of breast cancer,18 which was also confirmed in a larger study.19
The purpose of the current study was to evaluate the ovarian cancer risks associated with the 7 SNPs described above in a coordinated analysis of ovarian cancer case-control studies from USA, Europe and Australia. These studies provided data on up to 4,624 invasive cases and 8,113 controls of white non-Hispanic origin and up to 5,317 invasive epithelial ovarian cancer cases and 9,092 controls including all races and ethnicities.
Material and methods
Study subjects
In total, 14 different ovarian cancer case-control studies contributed data to this study (Table II; see also Supplementary Table 1 and Ref. 11). Twelve studies used population-based ascertainment for cases and controls, 1 study was clinic-based, and 1 was a case-control study nested within a cohort. All studies received ethical committee approval, and all study subjects provided informed consent. Key clinical and questionnaire data on study participants including case-control status, ethnicity/race, tumor behavior, histologic subtype, age at diagnosis/interview, history of prior cancers were merged into a common dataset. The data were checked for consistency and completeness, and followed-up with individual study investigators.
TABLE II.
CHARACTERISTICS OF STUDY PARTICIPANTS
| Study abbreviation | Study name | Cases invasive | Cases borderline | Controls | % White non-Hispanic | Source | Participation rates |
|---|---|---|---|---|---|---|---|
| NEC | NECC (New England based Case-Control study) | 638 (660) | 242 (261) | 1,151 (1,192) | 97 | USA: Population-based | Cases: 72% Controls: 69% |
| MAL | MALOVA (Malignant Ovarian Cancer study) Copenhagen | 446 (446) | 0 (0) | 1,221 (1,221) | 100 | Denmark: Population-based | Cases: 79% Controls: 67% |
| SEA | SEARCH Cambridge UK | 591 (627) | 1 (1) | 850 (854) | 97 | England: Population-based | Cases: 67% Controls: 84% |
| AUS | AOCS (Australian Ovarian Cancer Study) Australian Cancer Study (ovarian cancer) | 587 (644) | 191 (210) | 834 (863) | 94 | Australia: Population-based | Cases: 84%* Controls: 47% |
| NCO | NCOCS (North Carolina Ovarian Cancer Study) | 501 (595) | 135 (163) | 675 (827) | 83 | USA: Population-based | Cases: 70% Controls: 63% |
| USC | LAC-CCOC (Los Angeles County Case-Control Studies of Ovarian Cancer) | 417 (597) | 125 (201) | 552 (702) | 75 | USA: Population-based | Cases: 73% Controls: 73% |
| POL | POCS (Polish Ovarian Cancer Study) Warsaw and Lodz Poland | 253 (253) | 0 (0) | 625 (625) | 100 | Poland: Population-based | Cases: 71% Controls: 67% |
| STA | GEOCS (Genetic Epidemiology of Ovarian Cancer Study)** | 286 (324) | 1 (2) | 366 (427) | 87 | USA: Population-based family | Cases: 63% Controls: 85% |
| MAY | Mayo Clinic Rochester Minnesota | 308 (337) | 53 (62) | 389 (468) | 87 | USA: Clinic-based | Cases: 84% Controls: 65% |
| GER | GOCS (German Ovarian Cancer Study) | 225 (226) | 29 (29) | 432 (432) | 100 | Germany: Population-based | Cases: 58% Controls: 51% |
| NHS | Nurses' Health Study and Nurses' Health Study II | 129 (130) | 21 (21) | 442 (450) | 98 | USA: Population-based cohort | Estimate identifying >99% of cases in blood cohorts (n = 32,826 for NHS and 29,611 for NHSII). Follow-up of the blood cohorts was 98% in June 1, 2004 (NHS) or June 1, 2003 (NHSII). |
| UKO | UKOPS (United Kingdom Ovarian Cancer Population Study) | 109 (115) | 1 (1) | 274 (277) | 98 | England: Population-based | Cases: 86% Controls: 97% |
| HAW | Hawaii Ovarian Cancer Study | 70 (298) | 19 (62) | 158 (602) | 25 | Hawaii USA: Population-based | Cases: 66% Controls: 69% |
| HOP | HOPE (hormones and ovarian cancer prediction) study Pittsburgh | 64 (65) | 12 (12) | 144 (152) | 96 | USA: Population-based | Cases: 69% Controls: 81% |
| Total | 4,624 (5,317) | 830 (1,025) | 8,113 (9,092) | 88 |
Numbers shown are white non-Hispanic participants, followed in parentheses by total number including all races and ethnicities (including unknown). Studies listed in order of white non-Hispanic sample size. Participation rates are those taking part as proportion of those invited to participate.
indicates % of those invited to take part (after excluding any who had died were too sick, unable to give informed consent, etc).
formally entitled FROC (Family Registry for Ovarian Cancer Study) Stanford
Individuals missing age or tumor behavior and individuals with a prior history of ovarian cancer were excluded. The combined data set comprised 5,317 invasive epithelial ovarian cancer cases, 9,092 controls (Table II). Of these, 88% were of white non-Hispanic origin; 4,624 invasive cases and 8,113 controls. Other participants were white Hispanic (41 cases and 69 controls), black non-Hispanic (112 cases and 164 controls), Asian non-Hispanic (199 cases and 268 controls), other ethnicities (149 cases and 287 controls); 191 cases and 192 controls were missing ethnicity information. An additional 1,025 cases classified as having borderline/low malignant potential tumors were available, of which 830 were of white non-Hispanic origin.
Genotyping
Seven SNPs were analyzed; AUKRA F31I rs2273535, BRCA2 N372H rs144848, RB1 intron 17 rs2854344, CDKN2A 5′ flanking rs2811712, CASP8 D302H rs1045485, TGFB1 L10P rs1982073, SRD5A2 3′ UTR rs632148. For SRD5A2 a TaqMan™ assay could not be designed for the V89L rs523349 SNP that had shown an association with ovarian cancer and therefore a tagged SNP (r2 = 0.9) in the 3′ UTR (rs632148) was used instead.17 Genotyping was performed at 10 different centers on 384-well plates, and all but 1 study used TaqMan (Applied Biosystems, Warrington, UK) according to the manufacturer's instructions. Six of the seven assays were Assays-by-Design™ (Applied Biosystems), while one (CASP8) used custom primers and probes. Each assay was carried out using 10 ng DNA in a 5μl reaction volume as described previously.11 One study (AUS; Table II) used iPLEX technology (Sequenom) to perform genotyping. Genotype data that had been previously reported included AUKRA, CDKN2A, RB1 and SRD5A2 for the MAL, SEA and STA studies11,12,15,17 and BRCA2 for the AUS and SEA studies.13
Genotyping quality control
We compared genotype call rates and concordance between studies. We used the following criteria as measures of acceptable genotyping: (i) >3% sample duplicates included, (ii) concordance rate for duplicate samples ≥98%, (iii) overall call rate (by study) >95% and (iv) call rate >90% for each 384-well plate. Studies failing these criteria were excluded for particular SNPs. Hardy- Weinberg equilibrium (HWE) among white non-Hispanic controls was also used to assess quality of genotyping. The genotyping of any SNP in a study deviating significantly from HWE (p < 0.05) were assessed, and the data were excluded if the clustering was found to be suboptimal. Some studies with minor departures from HWE were included if genotype clustering was good. Hence, there is variation in the number of studies/samples successfully genotyped for each polymorphism.
We further assured the quality of genotyping between laboratories by requiring each of the 10 laboratories genotyping the 14 studies, to additionally genotype a panel of CEPH-Utah trios at each SNP (http://ccr.coriell.org/Sections/Search/Panel_Detail.aspx?PgId=202&Ref=HAPMAPPT01). The panel included 90 DNA samples from 30 trios, 5 duplicate samples and a negative template control in a 96-well plate format. This allowed for assessment of consistency across studies, with HapMap published genotypes, and with Mendelian inheritance. The average call rate for the HAPMAP plate was 97.8% (range 95.8%-98.9% across the 10 centers and 97.1%-99.3% across the 7 SNPs). The concordance of genotypes between the centers showed problems with calling of the CASp8 assay in the HAW study and the AURKA assay for NCO study. Therefore, these data were excluded for these SNPs, correcting concordance rates to 99.95%. When a study was not concordant (>1/90 discordant) for a SNP for the HAPMAP plate, the case-control data were also excluded.
Statistical analysis
Genotypes obtained from the study participants were used to estimate allele frequencies in cases and controls. We assessed departures from HWE in the control subjects using a Pearson goodness-of-fit test, or a Fisher exact test for SNPs with minor allele frequencies less than 0.05.40 Data were summarized using frequencies and percentages for categorical variables, and means and standard deviations for continuous variables. We assessed associations of each SNP with risk of ovarian cancer using multivariate logistic regression analysis to estimate odds ratios (ORs) and 95% confidence intervals (CIs). Primary analyses were carried out assuming an ordinal (log-additive) genotypic relationship, using simple tests for trend within the logistic regression models. However, we also examined associations between each SNP and ovarian cancer risk separately for heterozygote and rare homozygote subjects, with subjects homozygous for the major allele serving as the referent group. Analyses were carried out overall, as well as by study site and race. We conducted SNP-specific formal tests of heterogeneity of risk across study site by including study site, genotype and the corresponding interaction terms in a logistic regression model, and testing the statistical significance of the interaction term. Further analyses of subsets of cases stratified by cancer stage (local, regional and distant) and histology (serous, mucinous, endometrioid, clear cell, mixed cell and other/unknown epithelial) were performed. Study site-specific logistic regression analyses adjusted for the potential confounding effects of age. All other logistic models described above were adjusted for both age and study site. We adjusted for site using 2 different methods. First, we included study site as a fixed effect covariate in the logistic regression models. Second, we included site as a random effect using nonlinear mixed effects modeling approaches. Analyses were conducted both with and without the inclusion of previously reported data; when included, raw data were used rather than summary data or meta-analytic methods. All statistical tests were 2-sided, and all analyses were conducted using the SAS system (SAS Institute, Cary, NC).
Results
In total, we genotyped 4,624 invasive ovarian cancer cases, 8,113 controls and 830 cases with borderline/low malignant potential tumors of white non-Hispanic origin and 693 invasive cases, 979 controls and 195 borderline/low malignant potential cases of other races and ethnicities (Table II). Genotype frequencies and results for tests for deviation from HWE for each study are given in Supplementary Table 2. Minor allele frequencies for all controls were consistent across studies for white non-Hispanic participants, but differed among the other ethnicities.
The results presented in this article are based on analysis of white non-Hispanic individuals. Summary ordinal OR for all white non-Hispanic samples are given in Table III. For 5 of the SNPs (rs2811712 in CDKN2A, rs2854344 in RB1, rs144848 in BRCA2, rs2273535 in AURKA, rs632148 in SRD5A2), these data are a combination of new genotype data and the original genotyping data that suggested associations.11-13,15,17 The remaining 2 SNPs (rs2811712 in CASP8 and rs2811712 in TGFB1) have not previously been genotyped in OCAC studies.
TABLE III.
ASSOCIATIONS BETWEEN SNPs AND RISK OF INVASIVE OVARIAN CANCER FOR WHITE NON-HISPANIC PARTICIPANTS, WITH AND WITHOUT PREVIOUSLY PUBLISHED DATA
| Gene | SNP | Studies | Cases | Controls | MAF | Ordinal OR (95% CI) | p-value | Het OR (95% CI) | Hom OR (95% CI) | p-value |
|---|---|---|---|---|---|---|---|---|---|---|
| AURKA | rs2273535 | All | 2,855 | 4,963 | 0.22 | 1.05 (0.97-1.13) | 0.254 | 1.05 (0.95-1.16) | 1.09 (0.87-1.35) | 0.517 |
| Exclude MAL, SEA, STA | 1,560 | 2,563 | 0.22 | 0.96 (0.86-1.07) | 0.431 | 0.95 (0.83-1.09) | 0.94 (0.69-1.28) | 0.710 | ||
| BRCA2 | rs144848 | All | 4,174 | 7,402 | 0.28 | 1.00 (0.94-1.06) | 0.911 | 0.98 (0.90-1.06) | 1.02 (0.88-1.18) | 0.836 |
| Exclude AUS, SEA | 3,024 | 5,757 | 0.28 | 0.97 (0.90-1.04) | 0.362 | 0.94 (0.85-1.03) | 0.98 (0.83-1.17) | 0.413 | ||
| CASP8 | rs1045485 | All | 3,798 | 6,637 | 0.13 | 0.98 (0.90-1.07) | 0.707 | 1.02 (0.92-1.12) | 0.81 (0.59-1.12) | 0.406 |
| CDKN2A | rs2811712 | All | 4,208 | 7,468 | 0.11 | 1.00 (0.92-1.09) | 0.992 | 0.97 (0.88-1.07) | 1.25 (0.89-1.74) | 0.326 |
| Exclude MAL, SEA, STA | 2,891 | 5,038 | 0.11 | 0.96 (0.87-1.07) | 0.496 | 0.95 (0.84-1.07) | 1.03 (0.68-1.55) | 0.682 | ||
| RB1 | rs2854344 | All | 3,817 | 6,584 | 0.06 | 0.88 (0.79-1.00) | 0.041 | 0.86 (0.75-0.98) | 1.05 (0.62-1.80) | 0.062 |
| Exclude MAL, SEA, STA | 2,683 | 4,684 | 0.06 | 0.92 (0.79-1.06) | 0.233 | 0.92 (0.79-1.08) | 0.80 (0.40-1.61) | 0.487 | ||
| SRD5A2 | rs632148 | All | 2,982 | 5,201 | 0.31 | 1.00 (0.93-1.07) | 0.907 | 0.96 (0.87-1.05) | 1.04 (0.89-1.22) | 0.494 |
| Exclude MAL, SEA, STA | 1,681 | 2,811 | 0.30 | 1.00 (0.91-1.10) | 0.968 | 0.98 (0.86-1.12) | 1.02 (0.82-1.26) | 0.928 | ||
| TGFB1 | rs1982073 | All | 2,439 | 4,299 | 0.39 | 1.01 (0.94-1.09) | 0.775 | 1.00 (0.89-1.11) | 1.03 (0.88-1.20) | 0.904 |
Ordinal odds ratios and 95% confidence intervals estimate the odds of ovarian cancer associated with each extra copy of the minor allele; Het OR and Hom OR compare the risk of ovarian cancer in those heterozygous and those homozygous for the minor allele, relative to those homozygous for the major allele, respectively. The corresponding p-value is a 2 degree-of-freedom test assessing differences in risk across any of the 3 genotypes; All analyses carried out using logistic regression analyses, adjusting for age and study site. Bold highlighting shows p < 0.05. Case and control are the number of white non-Hispanics individuals analyzed for each SNP. MAF is minor allele frequency.
We found no evidence of association for AURKA, BRCA2, CASP8, CDKN2A, SRD5A2 and TGFB1 (Fig. 1). However, we did find a borderline-significant association with rs22854344 in RB1. With the ordinal model, the OR was 0.88 (95% CI 0.79-1.00; p = 0.041). This SNP was also suggestive using the dominant model (OR 0.87: 95% CI 0.76-0.98; p = 0.025) (Fig. 2 and Supplementary Table 3).
Figure 1.
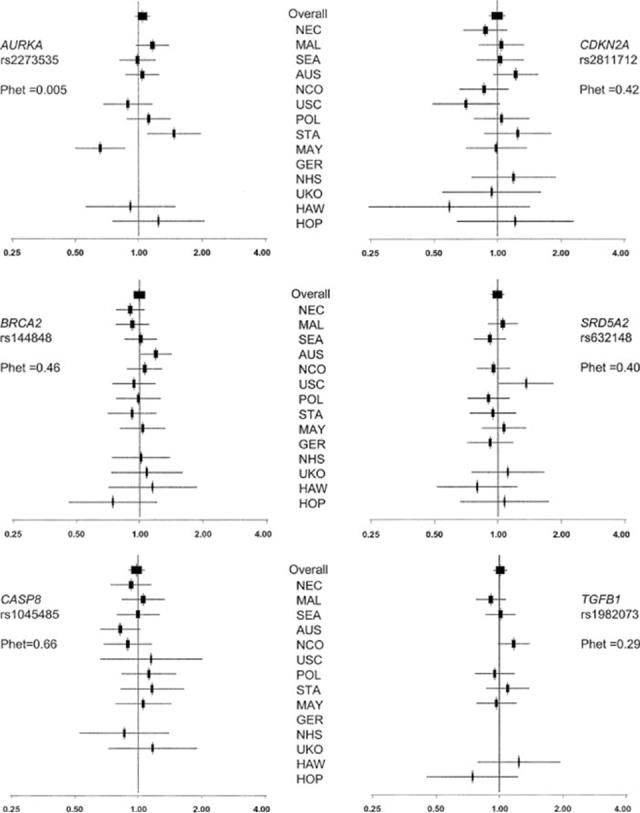
Study-specific and combined odds ratios for null SNPs. Forrest plot of the ordinal odd ratios by study and combined. The overall analyses are adjusted for age and study site, whereas site-specific analyses adjusted only for age. 95% confidence intervals and sizes of the boxes are proportional to size of each study (based on white non-Hispanic participants). Order of studies is in descending order of the total number of white non-Hispanic individuals. If a study did not genotype a particular SNP, or it failed our QC criteria, this is missing from the plot. Phet = p-value, test for heterogeneity across study sites. Coding of studies is as in Table II.
Figure 2.

Study-specific and combined odds ratios for RB1 rs2854344. As for Figure 1.
We performed tests for heterogeneity across studies for the white non-Hispanic subjects, and found evidence of heterogeneity for AURKA (p = 0.005). This was driven by 2 studies, which suggested associations in opposite directions, for the Mayo Clinic study (MAY, p = 0.004) and for the Stanford study (STA, p, = 0.04). Therefore, we reanalyzed the data excluding both or either of these studies. When both studies were excluded, the OR for AURKA was 1.06 (95% CI 0.97-1.16; p = 0.16; test for heterogeneity p = 0.72); when STA only was excluded, the OR was 1.01 (95% CI 0.93-1.10; p = 0.76; test for heterogeneity p = 0.03); when MAY only was excluded, the OR was 1.10 (95% CI 1.01- 1.20; p = 0.027; test for heterogeneity p = 0.31). The dominant model was also significant when MAY was excluded OR (1.12: 95% CI 1.01-1.24; p = 0.03).
For 5 SNPs that were previously genotyped in populations from the OCAC (AUKRA, CDKN2A, RB1 and SRD5A2 for MAL, SEA and STA11,12,15,17 and BRCA2 for AUS and SEA13), we repeated the analyses after excluding the original published data that had suggested evidence of an association. Summary ORs for the ordinal model with exclusion of these data are given in Table III. There was no association for any of these SNPs after exclusion of the initial data. For RB1, which had shown evidence of association in the combined analysis, the OR for the ordinal model was 0.92 (95% CI 0.79-1.06; p = 0.233), and for the dominant model was 0.92 (95% CI 0.79-1.07; p = 0.254). Thus there remains a suggestion of an association for this SNP.
We studied variation in the genotypic risks by clinical features of disease. Histological subtype data were available from 4,532 white non-Hispanic invasive cases; 2,508 (55.3%) were serous, 345 (7.6%) were mucinous, 737 (16.3%) were endometrioid, 381 (8.4%) were clear cell and 112 (2.5%) were mixed histological subtypes; 449 (9.9%) were described as other/unknown. Stage data were available for 3,400 invasive cases, of which 741 (21.8%) were classified as local, 640 (18.8%) as regional and 2,019 (59.3%) as distant. We found no significant differences in risk by either histological subtype or stage (data not shown). Finally, we looked for associations with borderline disease. There were 830 white non-Hispanic individuals with borderline/low malignant potential tumors. We found a marginally significant association for CASP8 [OR 1.18 (95% CI 1.00-1.39; p = 0.056)] (Supplementary Table 4).
All combined analyses reported above included study site as a fixed effect covariate. We ran a series of secondary analyses accounting for the effects of site by including it as a random effect term, and found nearly identical results (not shown).
Discussion
The OCAC has analyzed 7 candidate SNPs for ovarian cancer risk association in 14 case-control studies from USA, Europe and Australia. For 5 of these SNPs (in AURKA, BRCA2, CDKN2A, RB1 and SRD5A2), there is previous evidence from the published literature that they are associated with variable risks of epithelial ovarian cancer.11-13,15,17 The remaining 2 SNPs (CASP8 and TGFB1) were considered candidate ovarian cancer susceptibility alleles, because they have been significantly associated with breast cancer risk variation in a large consortium study.19
After combining the different studies, 4,624 ovarian cancer cases and 8,113 controls, all of whom were white non-Hispanic, were analyzed. This represents the largest pooled genotyping of ovarian cancer case-control studies yet published. We found borderline evidence of association for a SNP in intron 17 of RB1 (p = 0.025). This SNP has been shown to be associated with decreased risk of both breast and ovarian cancer.15,16 Many studies have found that RB1 and the pathways in which it functions, are frequently altered in ovarian cancers.23,24 We also found marginal evidence for a coding nonsynonymous SNP (F31I) in AURKA, when a single study responsible for causing heterogeneity between studies was removed from the analysis (p = 0.03). Contrary to the previously published data, there was no association with ovarian cancer risk for the 3 other SNPs; neither was there evidence that the SNPs in CASP8 and TGFB1, that are associated with breast cancer risk, have a similar effect in ovarian cancer.
The original reports for AURKA, BRCA2, CDKN2A, RB1 and SRD5A2 had been generated from the analysis of case-control populations that are part of the OCAC. It has been suggested that a combined analysis with adjustment for multiple testing has more power than a replication analysis.41 Neither RB1 nor AURKA were significantly associated with ovarian cancer risk after adjusting for multiple testing. Most polymorphisms that show moderately significant associations will be false positives, because the number of polymorphisms throughout the genome is very high and the prior probability that any polymorphism is associated with disease is very low. Thus, it has not been possible to validate many initial reportedly positive associations for disease.6,7,10,11,17 For the 2 putative associations we observed, neither RB1 nor AURKA were significant without the original data, although the trend for RB1 remained. The initial findings may, therefore, represent false positive associations identified by chance in studies of small sample size, they may be outlier associations that have “regressed to the mean,” or they may exemplify true population heterogeneity that only becomes apparent when several different study populations are analyzed.
This study highlights the importance of consortium-based approaches for validating suggested genetic associations from case-control studies, and for identifying novel susceptibility loci for disease. In addition to dramatically increasing the power of association studies, consortia must implement stringent data quality and genotyping guidelines; this is likely to minimize reports of false positive associations.10 The OCAC has established strict genotype quality control criteria for inclusion in consortium analyses. These include evaluating concordance of genotyping in 96 control DNA samples between different centers; setting thresholds for acceptable genotyping pass rates; and including sufficient numbers of duplicate DNA samples in arrays in order to gauge genotyping accuracy.
These data suggest that there is substantial evidence against a role in susceptibility to ovarian cancer for some of the SNPs analyzed in this study. The Breast Cancer Association Consortium have suggested guidelines for excluding SNPs as candidate susceptibility alleles for disease based on the range of 95% confidence limits.18 Based on the same criteria, this study can, with reasonable certainty, exclude SNPs in BRCA2, CASP8, CDKN2A, SRD5A2 and TGFB1 from having more than a small dominant effect; the upper CI limit of the heterozygous OR was less than 1.12 in all 5 cases. Moderate recessive effects can be excluded for BRCA2, CASP8, SRD5A2 and TGFB1 as the upper CI limits of the homozygous OR were less than 1.30 in all cases. The 95% CIs for CDKN2A were much wider (0.89-1.74), and so a moderate recessive effect cannot be ruled out.
A large body of evidence has emerged suggesting that particular genes and biological pathways are altered in the development of different histological subtypes of ovarian cancer. For example, mutations in the KRAS gene are more common in mucinous ovarian cancers; and germline BRCA1 and BRCA2 mutations appear to predispose to serous ovarian cancers.42 Several association studies have reported different ovarian cancer risks, albeit with borderline significance, for polymorphisms in candidate genes when cases are stratified by histological subtype.11,13,15 However, we found no evidence of an effect for any of the SNPs, when invasive ovarian cancers were stratified by histological subtype. There was limited power, however, for detecting moderate effects based on histological subtype. We found a marginal association for rs1045485 in CASP8 when we analyzed borderline ovarian cancer cases; but the numbers were small and so this may be a chance finding.
False positive results can be obtained due to hidden population stratification. Therefore, we restricted analysis to white non-Hispanic participants due to significantly different allele frequencies in different ethnic groups. The only SNP showing heterogeneity between studies using the white non-Hispanic samples was AURKA. Population heterogeneity has been seen in another study of this SNP, and it has been suggested to be due to either population stratification or population-specific linkage disequilibrium with functional variants.43 There was not, however, population heterogeneity for this SNP in the breast cancer consortium study.18
In summary, this OCAC analysis of ~4,600 invasive ovarian cancer cases and 8,000 controls of white non-Hispanic origin for 7 candidate SNPs found a marginally significant result for an intronic RB1 SNP (rs2854344). The greatly increased sample size of the international consortium approach to ovarian cancer has clarified the role of other potential candidates, and suggests that these do not have a significant effect on ovarian cancer risk.
Supplementary Material
Acknowledgements
The authors thank Ms. Joan MacIntosh, Ms. Hannah Munday, Ms. Barbara Perkins, Ms. Clare Jordan, Ms. Kristy Driver, Mr. Mitul Shah, the local general practices and nurses and the East Anglian Cancer Registry for recruitment of the UK cases: the EPIC-Norfolk investigators for recruitment of the UK controls; Mr. Craig Luccarini and Mr. Don Conroy for expert technical assistance. Prof. Neonila Szeszenia-Dabrowska and Dr. Beata Peplonska of the Nofer Institute of Occupational Medicine (Lodz, Poland) and Prof. Witold Zatonski of the Cancer Center and M. Sklodowska-Curie Institute of Oncology (Warsaw, Poland) for their contribution to the Polish Ovarian Cancer Study; Ms. Debby Bass, Ms. Shari Hutchison, Ms. Carlynn Jackson, Ms. Jessica Kopsic and Ms. Mary Hartley for the HOPE project. They thank Ms. Ursula Eilber for competent data management and programming for the German Ovarian Cancer Study. They also thank all members of the research team, including research nurses, research scientists, data entry personnel and consultant gynaecological oncologists for their help in establishing the UKOPS case-control collection. In particular, the authors thank Ms. Lydia Quaye and Ms. Eva Wozniak for the efforts in genotyping and data analysis and Dr. Andy Ryan and Mr. Jeremy Ford for data and sample management.
The AOCS gratefully acknowledges the cooperation of the New South Wales, Queensland, South Australian, Victorian and Western Australian Cancer Registries as well as all the collaborating institutions represented within the AOCS Study Group.
SJR is funded by the Mermaid component of the Eve Appeal, SAG is a HEFCE Funded Senior lecturer, HS is funded by a grant from WellBeing of Women, DFE is a Principal Research Fellow of Cancer Research UK, PDPP is a Senior Clinical Research Fellow, ELG is a Fraternal Order of Eagles Cancer Research Fellow, GCT and PW are supported by Fellowships from the NHMRC and Cancer Council of Queensland, respectively.
Genotyping and the Ovarian Cancer Association Consortium are funded by the Ovarian Cancer Research Fund thanks to generous donations from the family and friends of Kathryn Sladek Smith.
Finally, they express their profound thanks to all the study participants who contributed to this research.
Grant sponsor: Mermaid component of the Eve Appeal, HEFCE, Well-Being of Women, Mayo Foundation, Minnesota Ovarian Cancer Alliance, National Cancer Institute, Department of Health and Human Services, USA, Cancer Council Tasmania and Cancer Foundation of Western Australia, OAK Foundation; Grant sponsor: The Roswell Park Alliance and the National Cancer Institute; Grant numbers: CA71766, Core Grant CA16056; Grant sponsor: National Cancer Institute; Grant number: CA015083; Grant sponsor: U.S. Army Medical Research and Materiel Command; Grant number: CA122443; Grant sponsor: The National Cancer Institute; Grant number: DAMD17-01-1-0729; Grant sponsor: The National Health and Medical Research Council of Australia; Grant number: 199600; Grant sponsor: NCI; Grant numbers: K07-CA80668, R01CA095023; Grant sponsor: Department of Defence; Grant number: DAMD17-02-1-0669; Grant sponsor: California Cancer Research Program; Grant numbers: 00-01389V-20170, 2110200; Grant sponsor: U.S. Public Health Service; Grant numbers: CA14089, CA17054, CA61132, CA63464, N01-PC-67010, R03-CA113148; Grant sponsor: California Department of Health Services; Grant number: 050-E8709; Grant sponsor: National Cancer Institute; Grant numbers: CA58598, N01-CN-67001 (Hawaii); Grant sponsor: National Institutes of Health; Grant number: 1-R01-CA76016; Grant sponsor: Department of Defense (DOD); Grant number: DAMD17-02-1-0666; Grant sponsor: German Federal Ministry of Education and Research of Germany, Programme of Clinical Biomedical Research; Grant number: 01 GB 9401.
Footnotes
This article contains supplementary material available via the Internet at http://www.interscience.wiley.com/jpages/0020-7136/suppmat.
References
- 1.Antoniou AC, Easton DF. Risk prediction models for familial breast cancer. Future Oncol. 2006;2:257–74. doi: 10.2217/14796694.2.2.257. [DOI] [PubMed] [Google Scholar]
- 2.Pharoah PD, Antoniou A, Bobrow M, Zimmern RL, Easton DF, Ponder BA. Polygenic susceptibility to breast cancer and implications for prevention. Nat Genet. 2002;31:33–6. doi: 10.1038/ng853. [DOI] [PubMed] [Google Scholar]
- 3.Easton DF, Pooley KA, Dunning AM, Pharoah PD, Thompson D, Ballinger DG, Struewing JP, Morrison J, Field H, Luben R, Wareham N, Ahmed S, et al. Genome-wide association study identifies novel breast cancer susceptibility loci. Nature. 2007;447:1087–93. doi: 10.1038/nature05887. [DOI] [PMC free article] [PubMed] [Google Scholar]
- 4.Tomlinson I, Webb E, Carvajal-Carmona L, Broderick P, Kemp Z, Spain S, Penegar S, Chandler I, Gorman M, Wood W, Barclay E, Lubbe S, et al. A genome-wide association scan of tag SNPs identifies a susceptibility variant for colorectal cancer at 8q24.21. Nat Genet. 2007;39:984–8. doi: 10.1038/ng2085. [DOI] [PubMed] [Google Scholar]
- 5.Zanke BW, Greenwood CM, Rangrej J, Kustra R, Tenesa A, Farrington SM, Prendergast J, Olschwang S, Chiang T, Crowdy E, Ferretti V, Laflamme P, et al. Genome-wide association scan identifies a colorectal cancer susceptibility locus on chromosome 8q24. Nat Genet. 2007;39:989–94. doi: 10.1038/ng2089. [DOI] [PubMed] [Google Scholar]
- 6.Ioannidis JP, Trikalinos TA, Ntzani EE, Contopoulos-Ioannidis DG. Genetic associations in large versus small studies: an empirical assessment. Lancet. 2003;361:567–71. doi: 10.1016/S0140-6736(03)12516-0. [DOI] [PubMed] [Google Scholar]
- 7.Lohmueller KE, Pearce CL, Pike M, Lander ES, Hirschhorn JN. Meta-analysis of genetic association studies supports a contribution of common variants to susceptibility to common disease. Nat Genet. 2003;33:177–82. doi: 10.1038/ng1071. [DOI] [PubMed] [Google Scholar]
- 8.Dahlman I, Eaves IA, Kosoy R, Morrison VA, Heward J, Gough SC, Allahabadia A, Franklyn JA, Tuomilehto J, Tuomilehto-Wolf E, Cucca F, Guja C, et al. Parameters for reliable results in genetic association studies in common disease. Nat Genet. 2002;30:149–50. doi: 10.1038/ng825. [DOI] [PubMed] [Google Scholar]
- 9.Colhoun HM, McKeigue PM, Davey Smith G. Problems of reporting genetic associations with complex outcomes. Lancet. 2003;361:865–72. doi: 10.1016/s0140-6736(03)12715-8. [DOI] [PubMed] [Google Scholar]
- 10.Ioannidis JP. Common genetic variants for breast cancer: 32 largely refuted candidates and larger prospects. J Natl Cancer Inst. 2006;98:1350–3. doi: 10.1093/jnci/djj392. [DOI] [PubMed] [Google Scholar]
- 11.Gayther SA, Song H, Ramus SJ, Kjaer SK, Whittemore AS, Quaye L, Tyrer J, Shadforth D, Hogdall E, Hogdall C, Blaeker J, Dicioccio R, et al. Tagging single nucleotide polymorphisms in cell cycle control genes and susceptibility to invasive epithelial ovarian cancer. Cancer Res. 2007;67:3027–35. doi: 10.1158/0008-5472.CAN-06-3261. [DOI] [PubMed] [Google Scholar]
- 12.Dicioccio RA, Song H, Waterfall C, Kimura MT, Nagase H, McGuire V, Hogdall E, Shah MN, Luben RN, Easton DF, Jacobs IJ, Ponder BA, et al. STK15 polymorphisms and association with risk of invasive ovarian cancer. Cancer Epidemiol Biomarkers Prev. 2004;13:1589–94. [PubMed] [Google Scholar]
- 13.Auranen A, Spurdle AB, Chen X, Lipscombe J, Purdie DM, Hopper JL, Green A, Healey CS, Redman K, Dunning AM, Pharoah PD, Easton DF, et al. BRCA2 Arg372Hispolymorphism and epithelial ovarian cancer risk. Int J Cancer. 2003;103:427–30. doi: 10.1002/ijc.10814. [DOI] [PubMed] [Google Scholar]
- 14.Healey CS, Dunning AM, Teare MD, Chase D, Parker L, Burn J, Chang-Claude J, Mannermaa A, Kataja V, Huntsman DG, Pharoah PD, Luben RN, et al. A common variant in BRCA2 is associated with both breast cancer risk and prenatal viability. Nat Genet. 2000;26:362–4. doi: 10.1038/81691. [DOI] [PubMed] [Google Scholar]
- 15.Song H, Ramus SJ, Shadforth D, Quaye L, Kjaer SK, Dicioccio RA, Dunning AM, Hogdall E, Hogdall C, Whittemore AS, McGuire V, Lesueur F, et al. Common variants in RB1 gene and risk of invasive ovarian cancer. Cancer Res. 2006;66:10220–6. doi: 10.1158/0008-5472.CAN-06-2222. [DOI] [PubMed] [Google Scholar]
- 16.Lesueur F, Song H, Ahmed S, Luccarini C, Jordan C, Luben R, Easton DF, Dunning AM, Pharoah PD, Ponder BA. Single-nucleotide polymorphisms in the RB1 gene and association with breast cancer in the British population. Br J Cancer. 2006;94:1921–6. doi: 10.1038/sj.bjc.6603160. [DOI] [PMC free article] [PubMed] [Google Scholar]
- 17.Beesley J, Jordan SJ, Spurdle AB, Song H, Ramus SJ, Kjaer SK, Hogdall E, DiCioccio RA, McGuire V, Whittemore AS, Gayther SA, Pharoah PD, et al. Association between SNPs in hormone metabolism and DNA repair genes and epithelial ovarian cancer: results from two Australian studies and an additional validation set. Cancer Epidemiol Biomarkers Prev. 2007;16:2557–65. doi: 10.1158/1055-9965.EPI-07-0542. [DOI] [PMC free article] [PubMed] [Google Scholar]
- 18.Breast Cancer Association Consortium Commonly studied single-nucleotide polymorphisms and breast cancer: results from the Breast Cancer Association Consortium. J Natl Cancer Inst. 2006;98:1382–96. doi: 10.1093/jnci/djj374. [DOI] [PubMed] [Google Scholar]
- 19.Cox A, Dunning AM, Garcia-Closas M, Balasubramanian S, Reed MW, Pooley KA, Scollen S, Baynes C, Ponder BA, Chanock S, Lissowska J, Brinton L, et al. A common coding variant in CASP8 is associated with breast cancer risk. Nat Genet. 2007;39:352–8. doi: 10.1038/ng1981. [DOI] [PubMed] [Google Scholar]
- 20.Ewart-Toland A, Dai Q, Gao YT, Nagase H, Dunlop MG, Farrington SM, Barnetson RA, Anton-Culver H, Peel D, Ziogas A, Lin D, Miao X, et al. Aurora-A/STK15 T+91A is a general low penetrance cancer susceptibility gene: a meta-analysis of multiple cancer types. Carcinogenesis. 2005;26:1368–73. doi: 10.1093/carcin/bgi085. [DOI] [PubMed] [Google Scholar]
- 21.Cheetham GM, Knegtel RM, Coll JT, Renwick SB, Swenson L, Weber P, Lippke JA, Austen DA. Crystal structure of aurora-2, an oncogenic serine/threonine kinase. J Biol Chem. 2002;277:42419–22. doi: 10.1074/jbc.C200426200. [DOI] [PubMed] [Google Scholar]
- 22.Ewart-Toland A, Briassouli P, de Koning JP, Mao JH, Yuan J, Chan F, MacCarthy-Morrogh L, Ponder BA, Nagase H, Burn J, Ball S, Almeida M, et al. Identification of Stk6/STK15 as a candidate lowpenetrance tumor-susceptibility gene in mouse and human. Nat Genet. 2003;34:403–12. doi: 10.1038/ng1220. [DOI] [PubMed] [Google Scholar]
- 23.Hashiguchi Y, Tsuda H, Yamamoto K, Inoue T, Ishiko O, Ogita S. Combined analysis of p53 and RB pathways in epithelial ovarian cancer. Hum Pathol. 2001;32:988–96. doi: 10.1053/hupa.2001.27115. [DOI] [PubMed] [Google Scholar]
- 24.Hashiguchi Y, Tsuda H, Inoue T, Nishimura S, Suzuki T, Kawamura N. Alteration of cell cycle regulators correlates with survival in epithelial ovarian cancer patients. Hum Pathol. 2004;35:165–75. doi: 10.1016/j.humpath.2003.07.018. [DOI] [PubMed] [Google Scholar]
- 25.Herzog H, Darby K, Hort YJ, Shine J. Intron 17 of the human retinoblastoma susceptibility gene encodes an actively transcribed G protein-coupled receptor gene. Genome Res. 1996;6:858–61. doi: 10.1101/gr.6.9.858. [DOI] [PubMed] [Google Scholar]
- 26.Melzer D, Frayling TM, Murray A, Hurst AJ, Harries LW, Song H, Khaw K, Luben R, Surtees PG, Bandinelli SS, Corsi AM, Ferrucci L, et al. A common variant of the p16(INK4a) genetic region is associated with physical function in older people. Mech Ageing Dev. 2007;128:370–7. doi: 10.1016/j.mad.2007.03.005. [DOI] [PMC free article] [PubMed] [Google Scholar]
- 27.Milde-Langosch K, Ocon E, Becker G, Loning T. p16/MTS1 Inactivation in ovarian carcinomas: high frequency of reduced protein expression associated with hyper-methylation or mutation in endometrioid and mucinous tumors. Int J Cancer. 1998;79:61–5. doi: 10.1002/(sici)1097-0215(19980220)79:1<61::aid-ijc12>3.0.co;2-k. [DOI] [PubMed] [Google Scholar]
- 28.Kudoh K, Ichikawa Y, Yoshida S, Hirai M, Kikuchi Y, Nagata I, Miwa M, Uchida K. Inactivation of p16/CDKN2 and p15/MTS2 is associated with prognosis and response to chemotherapy in ovarian cancer. Int J Cancer. 2002;99:579–82. doi: 10.1002/ijc.10331. [DOI] [PubMed] [Google Scholar]
- 29.Goodarzi MO, Azziz R. Diagnosis, epidemiology, and genetics of the polycystic ovary syndrome. Best Pract Res Clin Endocrinol Metab. 2006;20:193–205. doi: 10.1016/j.beem.2006.02.005. [DOI] [PubMed] [Google Scholar]
- 30.Schildkraut JM, Schwingl PJ, Bastos E, Evanoff A, Hughes C. Epithelial ovarian cancer risk among women with polycystic ovary syndrome. Obstet Gynecol. 1996;88:554–9. doi: 10.1016/0029-7844(96)00226-8. [DOI] [PubMed] [Google Scholar]
- 31.Makridakis NM, di Salle E, Reichardt JK. Biochemical and pharmacogenetic dissection of human steroid 5 α-reductase type II. Pharmacogenetics. 2000;10:407–13. doi: 10.1097/00008571-200007000-00004. [DOI] [PubMed] [Google Scholar]
- 32.MacPherson G, Healey CS, Teare MD, Balasubramanian SP, Reed MW, Pharoah PD, Ponder BA, Meuth M, Bhattacharyya NP, Cox A. Association of a common variant of the CASP8 gene with reduced risk of breast cancer. J Natl Cancer Inst. 2004;96:1866–9. doi: 10.1093/jnci/dji001. [DOI] [PubMed] [Google Scholar]
- 33.Frank B, Bermejo JL, Hemminki K, Klaes R, Bugert P, Wappenschmidt B, Schmutzler RK, Burwinkel B. Re: association of a common variant of the CASP8 gene with reduced risk of breast cancer. J Natl Cancer Inst. 2005;97:1012. doi: 10.1093/jnci/dji178. [DOI] [PubMed] [Google Scholar]
- 34.Cox A, MacPherson G. Re: association of a common variant of the CASP8 gene with reduced risk of breast cancer. J Natl Cancer Inst. 2005;97:1012–13. doi: 10.1093/jnci/dji178. [DOI] [PubMed] [Google Scholar]
- 35.Rosfjord EC, Dickson RB. Growth factors, apoptosis, and survival of mammary epithelial cells. J Mammary Gland Biol Neoplasia. 1999;4:229–37. doi: 10.1023/a:1018789527533. [DOI] [PubMed] [Google Scholar]
- 36.Blobe GC, Schiemann WP, Lodish HF. Role of transforming growth factor b in human disease. N Engl J Med. 2000;342:1350–8. doi: 10.1056/NEJM200005043421807. [DOI] [PubMed] [Google Scholar]
- 37.Lehmann K, Janda E, Pierreux CE, Rytomaa M, Schulze A, McMahon M, Hill CS, Beug H, Downward J. Raf induces TGFβ production while blocking its apoptotic but not invasive responses: a mechanism leading to increased malignancy in epithelial cells. Genes Dev. 2000;14:2610–22. doi: 10.1101/gad.181700. [DOI] [PMC free article] [PubMed] [Google Scholar]
- 38.Dumont N, Arteaga CL. Transforming growth factor-β and breast cancer: tumor promoting effects of transforming growth factor-β. Breast Cancer Res. 2000;2:125–32. doi: 10.1186/bcr44. [DOI] [PMC free article] [PubMed] [Google Scholar]
- 39.Dunning AM, Ellis PD, McBride S, Kirschenlohr HL, Healey CS, Kemp PR, Luben RN, Chang-Claude J, Mannermaa A, Kataja V, Pharoah PD, Easton DF, et al. A transforming growth factorβ1 signal peptide variant increases secretion in vitro and is associated with increased incidence of invasive breast cancer. Cancer Res. 2003;63:2610–15. [PubMed] [Google Scholar]
- 40.Weir BS. II. Methods for discrete population genetic dataed. Sinauer Associates; Sunderland, MA: 1996. Genetic data analysis. [Google Scholar]
- 41.Skol AD, Scott LJ, Abecasis GR, Boehnke M. Joint analysis is more efficient than replication-based analysis for two-stage genome-wide association studies. Nat Genet. 2006;38:209–13. doi: 10.1038/ng1706. [DOI] [PubMed] [Google Scholar]
- 42.Matzuk MM. Gynecologic diseases get their genes. Nat Med. 2005;11:24–6. doi: 10.1038/nm0105-24. [DOI] [PubMed] [Google Scholar]
- 43.Fletcher O, Johnson N, Palles C, dos Santos Silva I, McCormack V, Whittaker J, Ashworth A, Peto J. Inconsistent association between the STK15 F31I genetic polymorphism and breast cancer risk. J Natl Cancer Inst. 2006;98:1014–18. doi: 10.1093/jnci/djj268. [DOI] [PubMed] [Google Scholar]
Associated Data
This section collects any data citations, data availability statements, or supplementary materials included in this article.