

Summary
During morphogenesis of mature HIV-1 cores, the viral capsid (CA) proteins assemble conical or tubular shells around the viral ribonucleoprotein complexes. This assembly step is mimicked in vitro through reactions in which CA proteins oligomerize to form long tubes, and this process can be modeled as consisting of a slow nucleation period followed by a rapid phase of tube growth. We have developed a novel fluorescence microscopy approach to monitor in vitro assembly reactions and have employed it, along with electron microscopy analysis, to characterize the assembly process. Our results indicate that temperature, salt concentration, and pH changes have differential effects on tube nucleation and growth steps. We also demonstrate that assembly can be unidirectional or bidirectional, that growth can be capped, and that proteins can assemble onto the surfaces of tubes, yielding multiwalled or nested structures. Finally, experiments show that a peptide inhibitor of in vitro assembly also can dismantle pre-existing tubes, suggesting that such reagents may possess antiviral effects against both viral assembly and uncoating. Our investigations help establish a basis for understanding the mechanism of mature HIV-1 core assembly, and avenues for antiviral inhibition.
Keywords: HIV, retrovirus, capsid, Gag, assembly
Introduction
The mechanisms by which HIV-1 capsid (CA) proteins assemble to form mature-type cores in vivo and in vitro are not known. Within virions, CA proteins assemble mostly conical but occasionally cylindrical cores using a CA N-terminal domain (NTD) hexamer organization that is similar to the one observed in sheets, spheres, and cylinders (tubes) assembled in vitro1-20. The structures of mature HIV-1 conical cores are compatible with modeling as a P=5,7 cone from a pentamer-hexamer (5/6) net, with five pentamers placed at the narrow cone end, and seven pentamers place at the wide one9,21. However, different electron microscopy (EM) tomography studies have led to alternative proposals as to whether cone growth proceeds from the narrow or wide cone ends17,19. Factors that may influence the initiation sites for cone assembly include the viral membranes, RNAs, enzymes, and envelope (Env) proteins; precursor Gag (PrGag) processing intermediates; specific Gag protein oligomeric forms; and cellular factors4.
As compared with intra-virion core morphogenesis, the in vitro assembly of mature-type cores from purified HIV-1 CA proteins is a simpler, but still poorly understood process. Wild type (WT) HIV-1 CA proteins, which dimerize via their C-terminal domains (CTDs) with a Kd of about 18 uM22, can be induced by salt treatment to assemble long tubes, as well as rare cone and sphere forms3,6-7,10-12,16,18,20. Experiments have demonstrated that a W184A mutation at the CTD dimer interface inhibits dimerization, and blocks salt-induced in vitro CA assembly16. In contrast, it has been shown that deletion of CA residues 87-97 (Δ87-97), within the NTD cyclophilin A (CypA) binding loop, dramatically increases the efficiency of in vitro tube assembly16,23-24. In vitro assembly reactions have been enlisted to examine the effects of potential HIV assembly inhibitors25-32. One such inhibitor, the peptide CAI (ITFEDLLDYYGP28-32), was shown to inhibit HIV-1 Gag and CA in vitro assembly reactions when present in a 5-fold molar excess relative to the viral proteins, but has been presumed to be ineffective against pre-assembled cores28-29. Interestingly, CAI binds to a CTD site that ordinarily interacts with NTD helix 4 residues, facilitating the alignment of NTDs and CTDs around hexamer rings20,33.
Although analysis of inhibitors and mutations has contributed to an improved understanding of the CA protein contacts required for core assembly3-4,6-8,10-11,16,25-32,34-40, much of the in vitro assembly pathway remains to be elucidated. A speculative model is depicted in Figure 1. As illustrated, the model shows a nucleation step (Figure 1, step 1), followed by a growth phase (steps 2 and 3). Because EM images of assembly incubations often show either no assembly products or a preponderance of reasonably long tube products2-3,6,8,10-13,16,18, we assume that the nucleation step is slow, relative to a rapid, energetically favored growth phase. However, it is important to emphasize that nucleation limited kinetics have not been demonstrated rigorously for the pathway, and that many other details are also uncertain. For instance, the subunits that form the nucleation complex and that are added during the growth phase could be CA monomers, dimers, or higher order oligomers. The composition of the nucleation complex also is unknown. Additional unresolved issues are whether tube growth is unidirectional or bidirectional, whether growing ends can be capped, and how tube lengths and widths are controlled.
Figure 1. HIV-1 core assembly model.
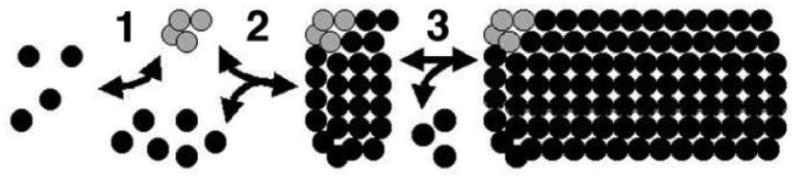
Shown is a model for the in vitro assembly from HIV-1 capsid proteins, in which nucleation limited kinetics are assumed, although this has not been proven rigorously. As illustrated in step 1, protein subunits oligomerize to form a nucleation complex (gray cluster of subunits) that serves to promote the rapid growth of tubes, depicted in steps 2 and 3. Note that although the model shows assembly in one direction, bidirectional assembly is not excluded. Note also that the nature of the subunits that combine to form the nucleation complex, the composition of the nucleation complex, and the sizes of the subunits that are added during the rapid growth phase are unknown.
One of the impediments to elucidation of the CA assembly pathway is the cumbersome nature of the available assays. For accurate qualitative characterization of assembly incubations, EM analysis frequently is employed2-19, although quantitation of results from the relatively small areas monitored by EM is problematic. In contrast, the efficiencies of CA assembly reactions can be followed via pelleting or turbidity assays25-26,28-29,39,41, but these methods are subject to the constraint that they can not distinguish tubes from non-specific aggregates or other off-pathway products. As a complementary approach, we have developed a novel fluorescence microscopy (FM) method for the analysis of in vitro assembly reactions. Utilizing our FM approach in conjunction with EM analysis, we have examined the in vitro assembly of WT and Δ87-97 CA proteins to help characterize the HIV-1 assembly pathway. Our analyses indicate that tube growth occurs unidirectionally and bidirectionally; that CAI not only inhibits assembly, but also dismantles CA tubes; and that tube surfaces serve as substrates for the elaboration of multiwalled tubes. We also show the differential effects of salt and heat on the initiation and growth phases of WT and Δ87-97 tube assembly. These results help establish a basis for understanding the mechanism of mature HIV-1 core assembly and avenues for antiviral inhibition.
Results
Characterization of HIV-1 CA assembly by fluorescence microscopy
The analysis of in vitro HIV-1 CA assembly reactions has been hampered by difficulties in quantitating EM results, and limitations in tracking results via pelleting or turbidity assays2-19,25-26,28-29,39,41. As an alternative, we have devised a FM-based assay for monitoring in vitro assembly products, which takes advantage of the fact that in vitro incubations yield tube products that can be many microns in length2-3,6,8,10-13,16,18, sufficient for light microscopy visualization. Our protocol is described in detail in the Materials and Methods section, and ordinarily involved the adherence of products assembled in vitro from C-terminally his-tagged CA proteins to glass coverslips, fixation, and then indirect immunofluorescence binding and wash steps to detect CA proteins. As shown in Figure 2A-B, our method permitted the convenient visualization of WT and Δ87-97 tubes assembled by salt induction at 4°C. The appearance of greater numbers of Δ87-97 versus WT tubes was reflected in EM images of parallel incubations (Figures 2C-D), and is consistent with previous observations16. As a control, we examined products obtained from assembly reactions using HIV-1 CA W184A proteins that are impaired for CA dimerization22. Tube products were not observed by FM or EM with W184A proteins (data not shown), again in agreement with expectations16.
Figure 2. Analysis of HIV CA assembly reactions by EM and FM.


Panels A-D show a comparison of EM and FM methods for visualization of HIV-1 in vitro assembly products. WT (A, C) or Δ87-97 (B, D) capsid proteins at 100 uM were induced to assemble at 4°C in 50 mM Tris pH 8, 1 M NaCl, 5 mM β-mercaptoethanol and then processed for viewing by FM using Hy183 as the primary antibody (A, B), or for viewing by EM, after negatively staining with uranyl acetate (C, D). Size bars for FM and EM images are provided in panels B and C respectively. Panels E and F give tube numbers as determined by FM (E) and EM (F) over a time course under the incubation conditions described above. WT or Δ87-97 capsid proteins were induced to assemble for the indicated amounts of time, after which they were processed for viewing by FM using NEA9306 as the primary antibody, or for EM. Tubes of at least 1.5 micron in length were counted in at least five 14370 micron2 fields of view for FM, and in a total of five 48.4 micron2 fields for EM. For FM tube tabulation, results are given as tubes per field with standard deviations, while for EM tube tabulation, total tube numbers in the five fields are given without standard deviations, due to the limited numbers of tubes observed. Note that for equivalent areas of view, 48 h FM Δ87-97 and WT tube counts were respectively 6.2 and 22.9 times lower than their EM counterparts.
To compare FM and EM approaches for tracking tube assembly, numbers of tubes assembled during 4°C incubations of WT and Δ87-97 proteins were tabulated at different timepoints by the two methods. As shown in Figure 2E, some tubes were observed by FM in our 0 h Δ87-97 incubation, but tube numbers increased more than 20-fold by 6 h after salt treatment, and remained relatively constant thereafter. In contrast, significant numbers of WT tubes were not observed by FM until our 48 h timepoint. EM observations (Figure 2E) were qualitatively similar to FM counts. Indeed, EM tabulation indicated a large increase in Δ87-97 tube numbers between 0 and 6 h. There also was a delay in the detection of WT tubes, which appeared at the 18 h timepoint, but showed a 3-fold jump between 24 and 48 h. One difference between EM and FM results was that higher numbers of tubes per unit area were observed by EM. We assume that the reduced counts of FM tubes may be a consequence of reduced substrate adherence, tube loss during incubation and wash steps, and/or lower detection efficiency. Nevertheless the qualitative agreement in FM and EM results (Figure 2), and the consistency of our FM results with previous studies on WT, Δ87-97 and W184A proteins indicate the utility of the FM approach.
One potential advantage of the FM approach is that the lengths of many tubes can be measured conveniently. Of course, the resolution of such analysis is limited theoretically by the wavelength of light used (approximately 500 nm) and the numerical aperture of the microscope objective (1.4) to about 220 nm. Nevertheless, tube length differences were evident in images (Figure 3A), and such differences were measured readily (Figure 3B). A methodological constraint iss that particulate contaminants may fluoresce as bright dots, and consequently we used a 1.5 micron length threshold for tube tabulation. Another consideration is that FM can not distinguish easily between protein tubes, ribbons, or tight strings of spheres, and because of this, tube morphologies were verified quantitatively by EM. Thus, subject to the caveats above, it proved possible to monitor the effects of incubation variations on tube assembly.
Figure 3. Examination of capsid tube lengths by FM.

HIV-1 capsid proteins were assembled and processed for FM as described in Figure 2. Panel A shows an enlarged image, in which tubes of various sizes are evident. Panel B is a black and white binary version of panel A, in which the measured tube lengths (in microns) are shown. Note that the theoretical resolution limit under our imaging conditions was approximately 220 nm, and that our threshold for tube tabulation was 1.5 microns, so as to exclude small fluorescent artifacts from our analyses.
Because pH alterations have been shown to exert strong effects on the in vitro assembly properties of several viral proteins1,13, and given that HIV-1 CA assembly may be regulated by a pH-dependent switch1,13,40, we used our FM method to examine the pH dependence of tube assembly. In these experiments, tube numbers and lengths were tabulated in a semi-automated fashion (see Materials and Methods section), permitting us to analyze pH effects on the distributions of WT and Δ87-97 tube lengths (Figure 4). Two observations from these studies were that shorter tubes (1.5-2.5 microns) were observed more frequently than long tubes, and that tube assembly was more efficient in the pH 7-8 range than at lower or higher pHs. Interestingly, for both WT and Δ87-97 tubes, pH 7 incubations yielded distributions with higher proportions of longer tubes. For example, for our WT incubations, 13% of pH 8 tubes were >3.5 microns long, whereas 25% of pH 7 tubes were in those size bins. These results suggest that relative to pH 8, pH 7 skews reactions towards growth (versus nucleation) steps (Figure 1), perhaps via lowering the energy threshold required for subunit addition, or by stabilization of the addition step.
Figure 4. pH dependence of in vitro assembly reactions.
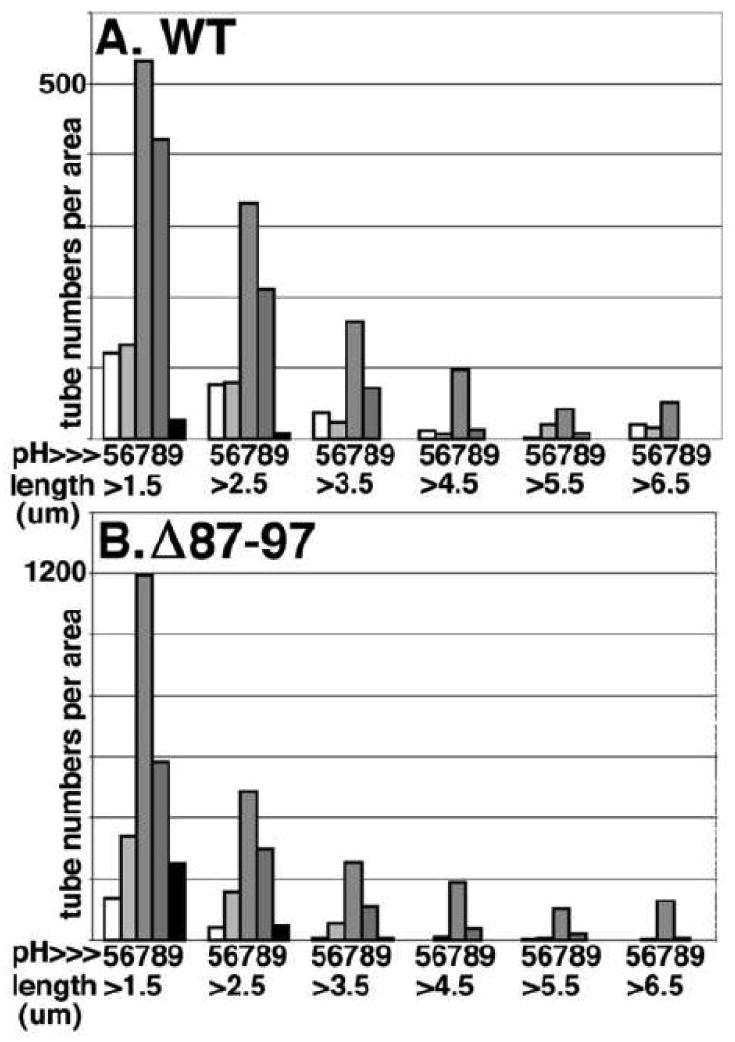
WT (A) or Δ87-97 (B) capsid proteins at 100 uM were induced to assemble for 48 h at 4°C in 50 mM Tris, 1 M NaCl, 5 mM β-mercaptoethanol at the indicated pHs, and processed for FM using Hy183 as the primary antibody. Tubes in 3-7 separate images for each incubation condition were counted and measured for lengths, and tube numbers per area (0.1 mm2) in length bins of 1.5-2.5, 2.5-3.5, 3.5-4.5, 4.5-5.5, 5.5-6.5, and >6.5 um are as depicted.
The incubations performed for our pH studies (Figure 4) were undertaken for 48 h, because WT tube counts were demonstrably lower for 4°C incubations of shorter durations (Figure 2). In some circumstances, assembly efficiencies have been shown to increase with temperatures up to 37°C39,43-44, so we also examined the effects of temperature on tube formation. When WT proteins were assembled at 37°C for 15 min or 1-2 days, tube numbers were not significantly increased relative to 1 day, 4°C incubations (Figures 5A-B). In addition, tube numbers for WT 37°C incubations were considerably lower than numbers observed for 2 day, 4°C incubations (Figures 5A-B). However, when 15 min, 37°C incubations preceded incubation at 4°C for 1 d, we found that the numbers of tubes increased about 5-fold, to levels observed in 4°C, 2 day incubations (Figures 5A-B). In contrast, 37°C preincubations before 4°C, 2 day, WT (Figure 5B) or 4°C, 1 day, Δ87-97 (Figure 5C) incubations appeared to have little or no effect. Taken together, these data suggest that heating of WT HIV-1 CA proteins helps them overcome barriers to tube nucleation and/or growth.
Figure 5. Temperature effects on capsid protein assembly.
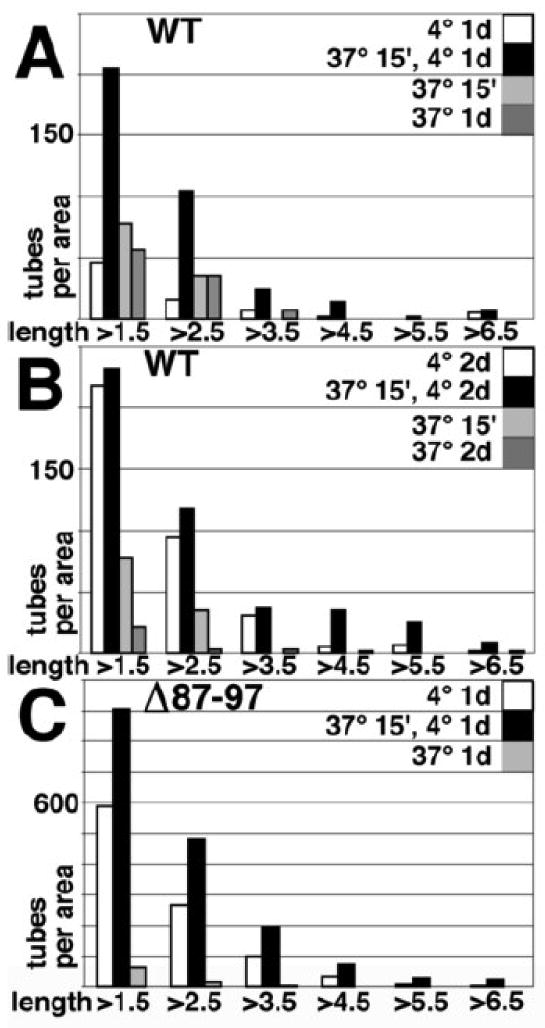
WT (A, B) or Δ87-97 (C) capsid proteins at 100 uM were induced to assemble in 50 mM Tris pH 8.0, 1 M NaCl, 5 mM β-mercaptoethanol for the indicated times at either 4°C (white bars), 37°C (gray bars), or 37° for 15 min, and then 4°C (black bars). After incubations, samples were processed for FM using Hy183 as the primary antibody. Tubes in 3-7 separate images for each incubation condition were counted and measured for lengths, and tube numbers per area (0.1 mm2) in length bins of 1.5-2.5, 2.5-3.5, 3.5-4.5, 4.5-5.5, 5.5-6.5, and >6.5 um are as depicted.
As a final test of environmental effects on CA tube assembly, we subjected the products of assembly incubations performed at reduced salt concentration to FM analysis. These experiments were undertaken only with the Δ87-97 protein, because under our standard incubation conditions (4°C, 100 uM protein), salt concentrations of <1M proved too low to support efficient tube assembly for our WT CA (data not shown). However, when Δ87-97 assembly incubations were conducted in the presence of low salt concentrations, we recorded a slight shift towards longer tube sizes at 0.5 M versus 1 M NaCl (Figure 6). In particular, for tubes assembled in 0.5 M NaCl, 32% were >3.5 microns long, and 17% were >4.5 microns long, while the corresponding numbers for tubes assembled in 1 M NaCl were 23% and 10%. These results imply that increasing NaCl from 0.5 to 1 M provides a greater boost to nucleation versus growth, yielding lower percentages of longer tubes.
Figure 6. Effects of varying salt concentration on Δ87-97 CA tube numbers and lengths.

Δ87-97 capsid proteins at 100 uM were induced to assemble for 48 h at 4°C in 50 mM Tris pH 8.0, 5 mM β-mercaptoethanol, plus either 1000 (white), 750 (gray), or 500 mM (black) NaCl. After incubations, samples were processed for FM using Hy183 as the primary antibody. Tubes in 3-7 separate images for each incubation condition were counted and measured for lengths, and tube numbers per area (0.1 mm2) in length bins of 1.5-2.5, 2.5-3.5, 3.5-4.5, 4.5-5.5, 5.5-6.5, and >6.5 um are as depicted.
CAI effects on tube assembly and stability
As noted in the Introduction, CAI is a peptide that binds to the HIV-1 CA CTD and interferes with in vitro assembly reactions28-29. To test its effects in our assembly incubations, we performed 4°C, 48 h assembly incubations in the absence or presence of a 5-fold molar excess of CAI (500 uM CAI versus 100 uM CA), which has been shown to block assembly28-29. Using both EM and FM readouts, we found that tube assembly was inhibited (data not shown). We also tested CAI using a different regimen. In this case, tubes were assembled for 48 h at 4°C and then treated or mock-treated with CAI. Interestingly, while 1 h treatment of assembled tubes with CAI did not reduce tube numbers (data not shown), post-treatment of assembly products with CAI for 3 h dismantled tubes as scored by EM (Figure 7A-D) and FM (Figure 7E-H). Importantly, control treatments of tubes with DMSO and six different unrelated peptides had no apparent effect on either tube assembly or tube disassembly (data not shown).
Figure 7. CAI dismantles pre-assembled HIV-1 capsid tubes.
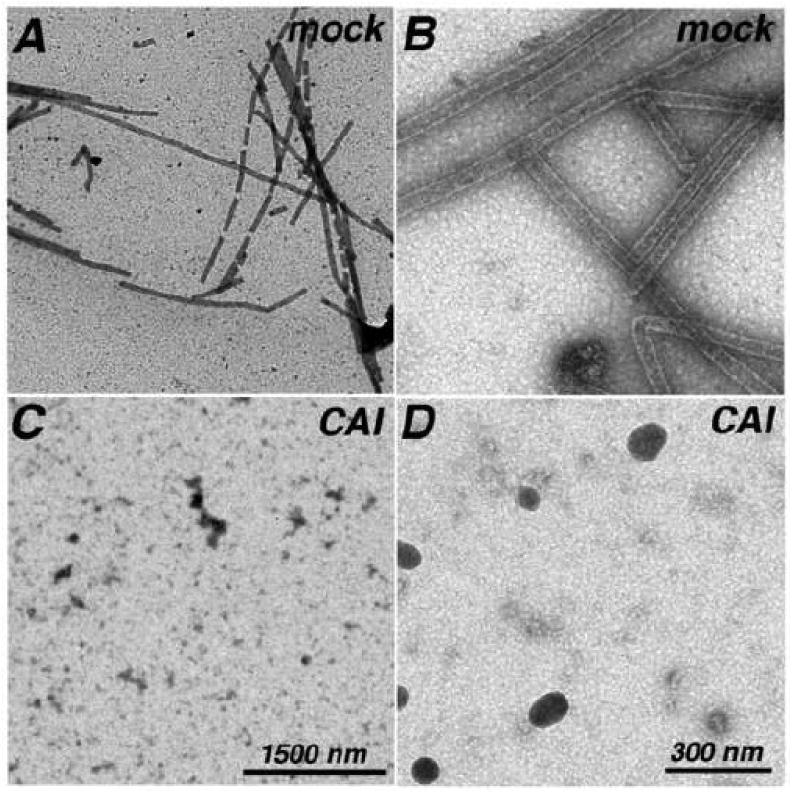
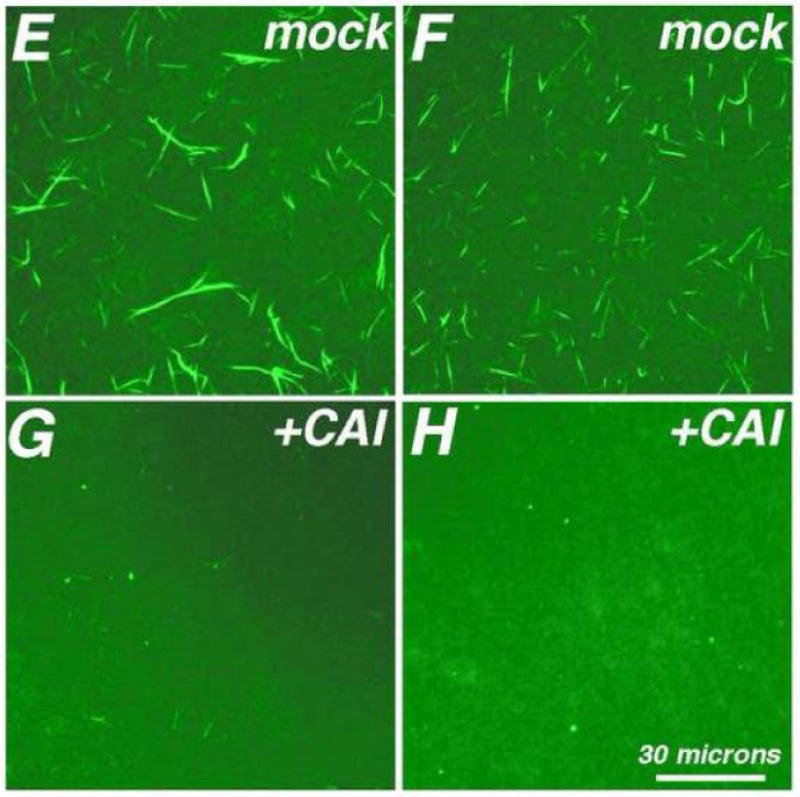
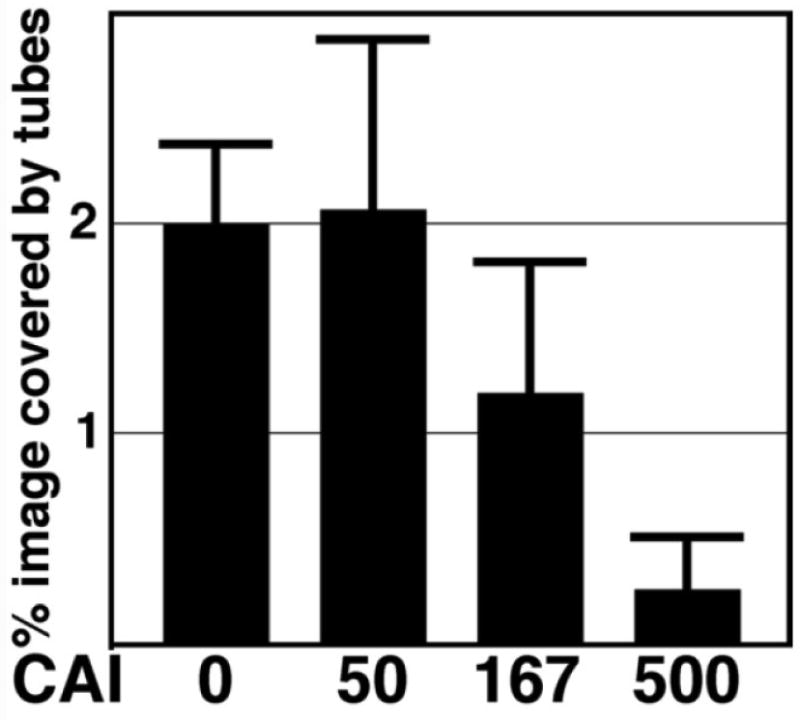
Capsid proteins (100 uM Δ87-97 in 50 mM Tris pH 8.0, 1 M NaCl, 5 mM β-mercaptoethanol) were assembled for 48 h at 4°C, and then treated 3 h at 4°C with DMSO (A, B, E, F; 5% final) or CAI (C, D, G, H; 500 uM final) in DMSO. After incubations, samples were processed for EM at low magnification (A, C; size bar in panel C) or high magnification (B, D; size bar in panel D), or for FM (panels E-H; size bar in panel H), using Hy183 as the primary antibody. For panel I, capsid proteins were assembled as above, and then treated 3 h at 4°C with the indicated final micromolar concentrations of CAI in DMSO (5% final). After incubations, samples were processed for FM using Hy183 as the primary antibody and imaged. For each incubation condition, tube assembly was quantified from at least seven separate images by determination of the percentages of each image that were covered by tubes, as described in the Materials and Methods sections. Average tube coverage percentages plus standard deviations are as shown.
To obtain dose-response data for the disassembly of tubes, assembly products were treated 3 h with different concentrations of CAI and subjected to FM, after which tube coverage in FM images was quantitated. Our data (Figure 7I) show that at CAI:CA ratios of 5:1 (500 uM CAI) and 1.67:1 (167 uM CAI) tube numbers were reduced. These concentrations are similar to those observed as inhibitory for assembly reactions28-29, indicating that tube assembly and disassembly are equally sensitive to the peptide. While sub-stoichiometric concentrations of CAI did not completely dismantle tubes as scored by FM, we considered it worthwhile to examine the effects of low levels of CAI on tube morphologies. To do so, tubes were assembled for 48 h at 4°C, treated with CAI at a CAI:CA ratio of 1:2, and processed for EM. After these steps, we observed that while numerous tubes were present, spheroids also were seen, and the tubes looked anomalous (Figure 8). As illustrated, the tubes tended to show a peapod appearance, with curled and disrupted ends and edges. We do not know the extent to which tube defect regions maintain normal local contacts, but it is possible that the defects were a consequence of altered CA hexamer and/or dimer contacts20,28-29,31-33.
Figure 8. EM visualization of assembly products treated with low concentrations of CAI.
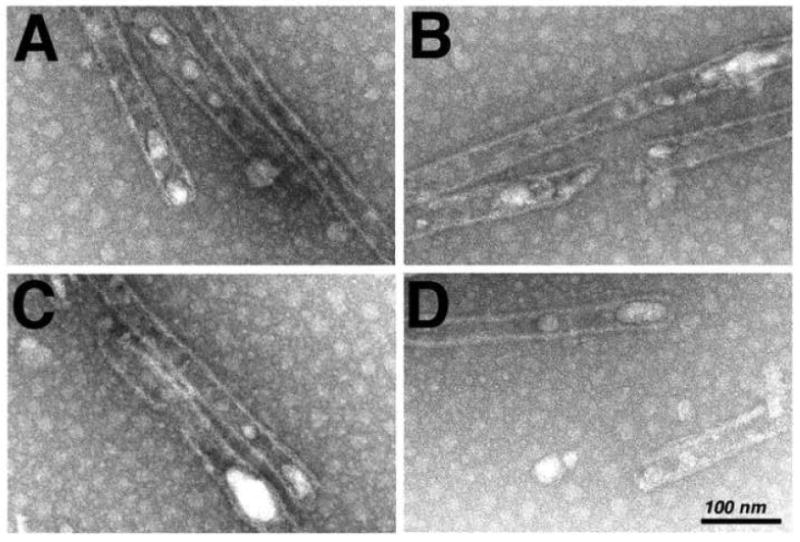
Capsid proteins (100 uM Δ87-97 in 50 mM Tris pH 8.0, 1 M NaCl, 5 mM β-mercaptoethanol) were assembled for 48 h at 4°C, and then treated 3 h at 4°C with 50 uM CAI (final) in 5% DMSO (final). After incubations, samples were processed for EM. The size bar for all four panels is shown in panel D.
Analysis of tube growth and tube morphology
The factors that regulate tube growth and tube morphologies are unknown. In terms of the directionality of tube assembly, there are no obvious impediments to bidirectional growth, unless tubes are capped at some point during the assembly process. Because some HIV-1 CA antibodies have been reported to bind Cyp A loop sequences that are missing in Δ87-97 proteins45-47, we reasoned that it might be possible to distinguish Δ87-97 from WT CA proteins by immunofluorescence, potentially permitting us to examine the directionality of tube growth. As a first step it was necessary to test the specificities of antibodies to the Cyp A loop using our FM approach. To do so, WT (Figure 9A-B) and Δ87-97 (Figure 9C-D) tubes were adhered to coverslips and doubly stained with antibodies to the CA CTD (green; Figures 9A, C), and to the NTD Cyp A loop (red; Figures 9B, D). As illustrated (Figures 9A-B) both antibodies stained WT tubes. In contrast, the WT-specific antibody 13-102-100, which recognizes HIV-1 CA residues 84-94 (see Methods section), did not detect Δ87-97 tubes (Figure 9D).
Figure 9. Use of WT-specific antibodies to analyze capsid tubes.
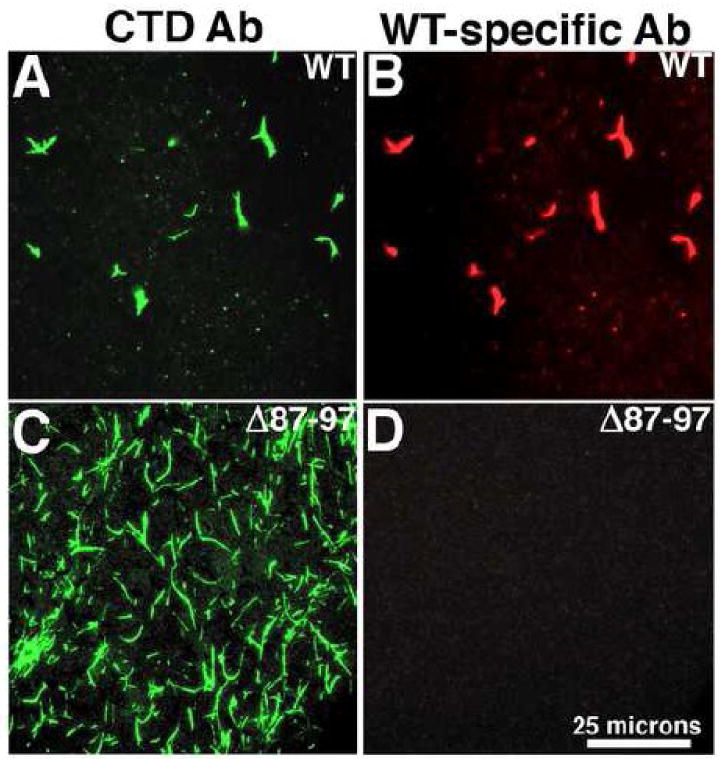
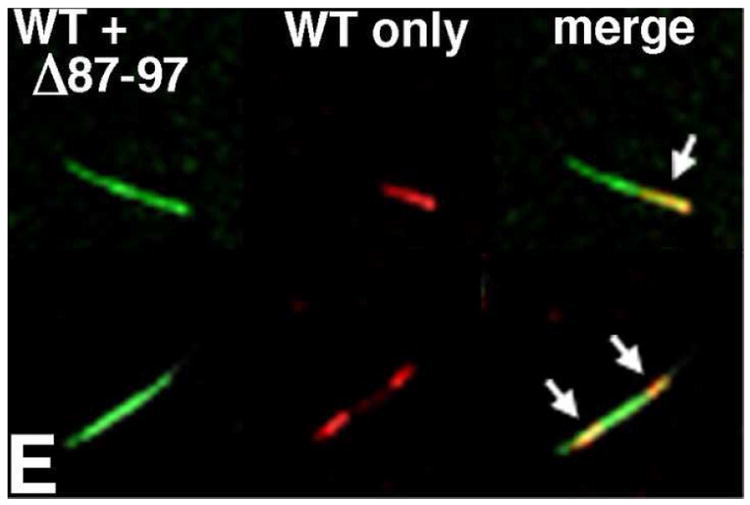
In panels A-D, the specificity of antibody 13-102-100 for WT proteins was tested. WT (A, B) or Δ87-97 (C, D) capsid proteins at 100 uM were induced to assemble for 48 h at 4°C in 50 mM Tris pH 8, 5 mM β-mercaptoethanol and either 1.25 M NaCl (WT) or 1 M NaCl (Δ87-97). After assembly reactions, samples were processed for double immunofluorescence labeling using antibody 13-102-100 (WT-specific) that recognizes cyclophilin loop residues 84-94 (used at a 1:4000 dilution), detected with an Alexafluor-594-conjugated secondary antibody (B, D); followed by the CTD-specific antibody Hy183 which recognizes both WT and Δ87-97 proteins, detected with an Alexafluor-488-conjugated secondary antibody (A, C). Panels A and B were taken at identical gain and exposure (100 msec) settings. Panels C and D were taken at identical gain settings and exposure settings of 50 msec (C) and 150 msec (D). Note that the size bar for panels A-D is shown in panel D. For panel E, Δ87-97 capsid proteins at 100 uM were induced to assemble for 24 h at 4°C in 50 mM Tris pH 8, 1 M NaCl, 5 mM β-mercaptoethanol, mixed with an equal volume and concentration of unassembled WT proteins in the same buffer, and incubated an additional 24 h at 4°C. After assembly reactions, samples were processed for double immunofluorescence labeling using WT-specific antibody 13-102-100 (used at a 1:2000 dilution), detected with an Alexafluor-594-conjugated secondary antibody (red); followed by the CTD-specific antibody Hy183 which recognizes both WT and Δ87-97 proteins, detected with an Alexafluor-488-conjugated secondary antibody (green). Fluorescence micrographs were taken of identical fields to visualize all capsid proteins (lefthand side images), or only WT proteins (center images), and merged images are shown on the righthand sides. Fifty examples of tubes capped with WT proteins on one end (top images) were observed; while twenty-two examples of tubes capped at both ends (bottom images) were observed.
Armed with a reagent capable of binding WT versus Δ87-97 proteins, we performed two step assembly incubations to monitor the directionality of tube growth. Initially, incubations involved assembly of WT proteins for 40 h at 4°C, followed by the addition of an excess of Δ87-97 proteins and incubation for an additional 8 h prior to dual fluorescence processing. Because Δ87-97 proteins assemble tubes more readily than their WT counterparts16 (Figures 2, 4, 5), our hope was to observe Δ87-97 proteins staining poorly with the WT-specific antibody at one end or two ends of WT tube seeds. Problematically, we found that co-assembly of Δ87-97 proteins with just a small percentage of WT proteins allowed for good staining with the Cyp A loop-specific antibody. As a consequence, only seven tubes with clear differential staining patterns were scored: all of these showed bright WT protein staining on one side of each tube rather than in the tube centers (data not shown), suggesting that tube growth may be unidirectional. However, given this tiny sample size, we undertook an alternative incubation sequence for our analysis. Here, Δ87-97 proteins were incubated in assembly reactions for 24 h prior to the addition of an equal amount of unassembled WT proteins in assembly buffer. From these incubations, fifty examples similar to the top panels in Figure 9E were observed, in which WT proteins were assembled asymmetrically onto Δ87-97 tube seeds. In contrast, twenty-two tubes similar to the bottom panels of Figure 9E were counted. We interpret these as examples in which WT proteins were added to both sides of Δ87-97 seeds.
One plausible explanation for the above observations is that occasionally tube ends can be capped in some fashion, potentially blocking growth beyond the cap. Indeed, occurrences of blunt, pointed, or decorated tube ends often were seen in our studies (Figure 10A). In an effort to analyze the relationship between tube end morphologies and possible tube nucleation or capping sites, we characterized the ends of Δ87-97 and WT tubes as being blunt (normal), pointed, decorated or wide. After these end morphology assignments, individual tubes were classified as being either asymmetric (one blunt end), symmetric and blunt, or symmetric and aberrant (decorated or pointed ends). As illustrated in Figure 10B, the preponderance of both Δ87-97 and WT tubes were asymmetric. Since our FM experiments support a model for bidirectional tube growth (Figure 9E) at least in some instances, we postulate that aberrant tube ends are indicative of tube capping rather than tube nucleation events. Assuming that this type of tube termination occurs randomly, the observation of tubes showing bidirectional or unidirectional growth (Figure 8E) is expected. According to our interpretation, tubes with double blunt ends should be capable of oligomerization in both directions, whereas those with two aberrant ends have stopped growing.
Figure 10. Analysis of tube ends.
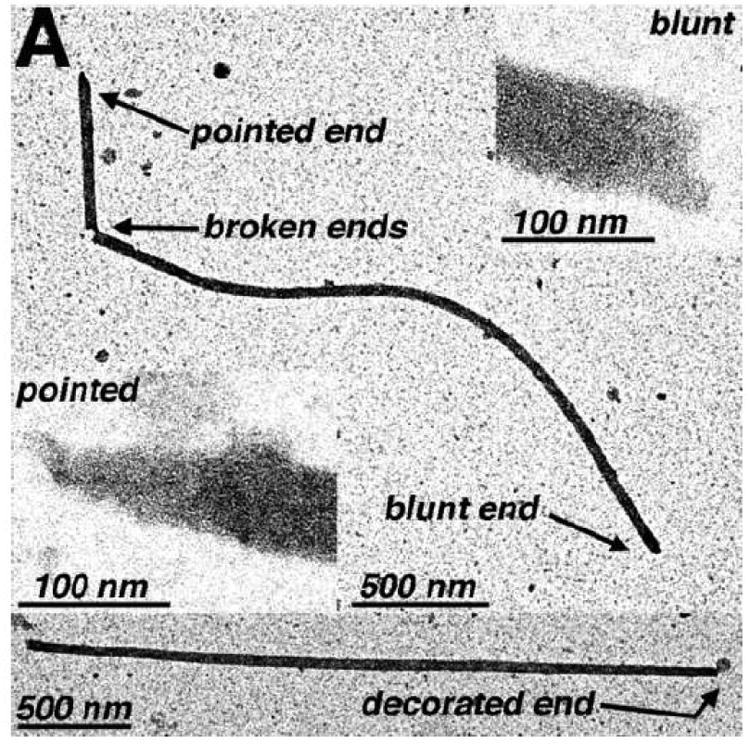

In panel A, examples of tubes with different end morphologies are illustrated. Shown towards the top is a low magnification image of a broken WT capsid tube with a blunt end (upper right inset) and a pointed end (lower left inset). In the bottom low magnification image is a tube with a normal blunt end (left side) and a decorated end, as indicated. Size bars for low magnification images and high magnification insets are 500 nm and 100 nm respectively. In panel B is a tabulation of observed tubes, based on their tube end morphologies. Initially, tube end morphologies of Δ87-97 (gray bars; N=57) and WT (black bars; N=105) tubes were classified as decorated, wide, pointed, and blunt. Decorated ends were defined as having attached electron dense features at the tube ends; wide ends were defined as being >50% wider than their counterpart ends for at least 100 nm of the tube length; blunt and pointed ends were defined as possessing tube end angles of ≥70° or <70° respectively, where tube end angles are the most acute angles measured between lines parallel to tube lengths and lines parallel to the edges that determine tube ends. For the purposes of tabulation, tubes with one decorated end, one pointed end or one wide end were categorized as asymmetric; tubes with two blunt ends were categorized as symmetric blunt; and tubes with two pointed or decorated ends were categorized as symmetric aberrant. Note that in all cases where broken ends were examined (N=19), the opposite ends of the breaks all were categorized as symmetric blunt.
During the course of tube end analysis, we also took the opportunity to measure the widths of WT and Δ87-97 tubes. As illustrated in Figure 11A, WT tubes gave an average width of 54 ± 8 nm, in the range of previous observations3,6-7,11-12,16, and the width histogram appeared to show a single distribution, with the possible exception of a shoulder at about 65-70 nm. Although the mean width for Δ87-97 tubes was only slightly greater than that of WT tubes (55 ± 9 nm), the distribution was significantly broadened, with possible peaks at 49-50 nm, 63-64 nm, and 73-77 nm. Interestingly, the 12-14 nm interval between these putative peaks is approximately double the radial length of HIV-1 CA12,20, implying that the wider Δ87-97 tubes might be multiwalled. To examine this possibility in another way, we boxed the sides of five wide Δ87-97 tubes and calculated their autocorrelation functions (Figures 11B-C). As shown in Figure 11C, the peak (white) lines of the autocorrelation profiles are separated by 6.8 ± 1.0 nm, indicating that the tube edge patterns have a repeat distance similar to the length of HIV-1 CA. These results strongly suggest that Δ87-97 CA proteins can assemble on the surfaces of pre-existing CA tubes, and corroborate the appearance of nested cores occasionally assembled by retroviruses in vivo17,48.
Figure 11. Analysis of WT and Δ87-97 tube widths.
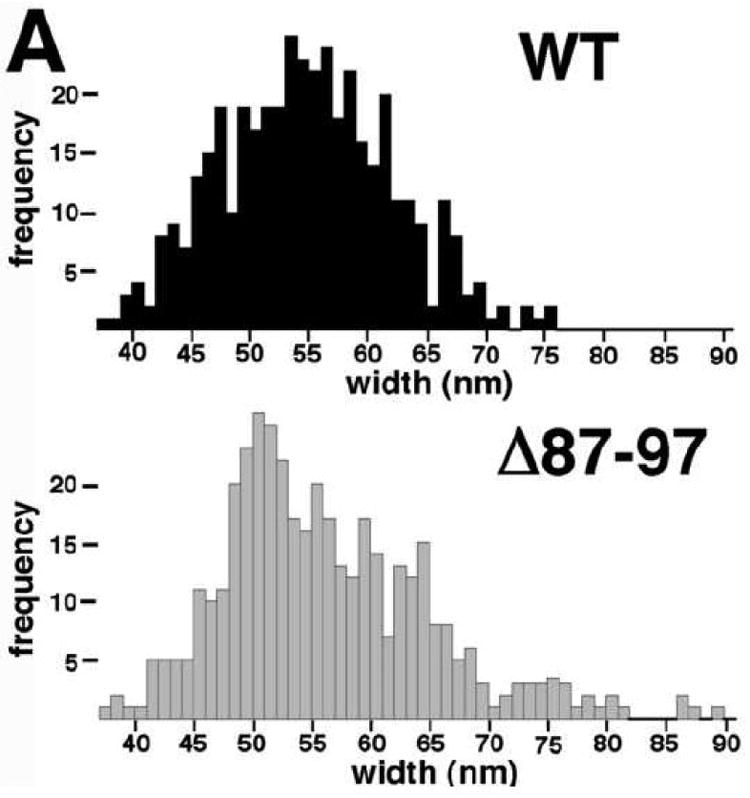
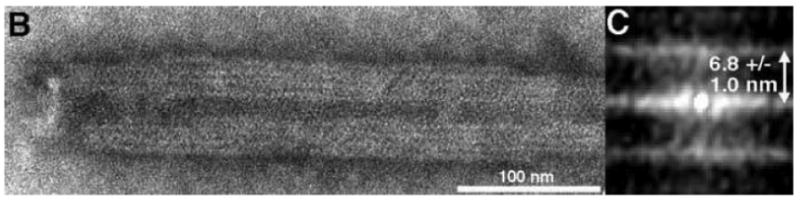
In panel A, width measurements (WT N=419; Δ87-97 N=406) from EM images of 102 WT and 103 Δ87-97 tubes were tabulated, and the frequencies of tube measurements falling into different 1 nm size bins are as depicted in the histogram. Note that the average widths of WT and Δ87-97 tubes were calculated as 54 ± 8 nm and 55 ± 9 nm, respectively. Panel B shows an EM image of a multiwalled Δ87-97 tube, while the autocorrelation function calculated from one of the boxed sides of the tube is presented in panel C. Note that the distance between the center line and the upper or lower lines in the autocorrelation function is indicative of the repeat distance between each layer of the tube walls. As shown, the average repeat distance from 16 measurements on 5 separate tubes was 6.8 ± 1.0 nm.
Discussion
Our model for in vitro HIV-1 CA assembly (Figure 1) assumes a slow nucleation step, followed by a relatively rapid, energetically favored growth phase. We make this assumption because the alternative--more efficient nucleation and less efficient growth steps--would yield high numbers of small structures. Our data do not cast light on the nature of the putative nucleating species, or intermediates that are too small for FM or EM visualization. It is possible that such intermediates could be fractionated by velocity centrifugation49, but our efforts with WT and Δ87-97 tube assembly products have not identified candidate intermediates. Alternatively, the oligomer size of the nucleating species could be determined from the power of the concentration dependence of the reactions, but theoretical work with similar systems suggests the solution is not that simple50. However, by comparison of tube numbers and lengths under different incubation conditions, we can infer how different factors may affect tube nucleation versus tube growth. Our results indicate that lower salt and slightly lower pH conditions than our standard pH 8, 1 M NaCl incubations favored the assembly of longer tubes (Figures 4, 6), possibly via a preferential reduction in assembly nucleation efficiency. We also observed a fourfold increase in WT tube numbers during 4°C, 1 d incubations when samples were preincubated for as little as 15 min at 37°C (Figure 5). Since this effect was much more pronounced for WT versus Δ87-97 CA, it suggests that heat works to help proteins overcome a Cyp A loop-dependent conformational barrier to nucleation, although an additional effect on the oligomerization capacity of CA proteins is not excluded. This interpretation is consistent with the argument that hydrophobic Cyp A loop sequences promote the off-pathway aggregation of CA proteins16.
Our ability to distinguish WT from Δ87-97 proteins permitted us to determine that in vitro tube growth can be bidirectional (Figure 9). This observation demonstrated the capacity of the two different proteins to co-assemble. It also implies that nucleation does not cap tube growth in either direction, although this conclusion must be tempered by two caveats. One reservation is that seeds for bidirectional tube growth may have been generated by fragmentation of pre-existing tubes. A second caveat is that the appearance of co-assembled tubes may result from the linear association of pre-assembled WT and Δ87-97 tube fragments. However, if we can assume that nucleated tubes grow in both directions, it infers that aberrant tube ends (Figure 10) do not represent nucleation sites, but rather, sites of tube termination. In this case, our data show that growth can be capped, seemingly at random, on one or both ends of growing tubes. Nevertheless, even for doubly capped tubes, assembly can continue, at least for Δ87-97 proteins, by virtue of assembling onto the surfaces of pre-existing tubes (Figure 11). The outcome of such an event is the generation of multiwalled or nested17,48 core structures. The existence of such structures suggests that the lengths of tubes may not be restricted by the availability of assembly competent free protein, but future experiments with varying concentrations of protein should address this issue directly. Based on the assembly preferences of retroviral CA proteins12,20, we believe that all layers of multiwalled tubes are oriented in the same fashion (NTDs out), but we have no direct proof that this is the case.
While the results above are pertinent to the spontaneous termination of CA assembly, the peptide CAI has proven itself to be a strong inhibitor of HIV-1 Gag protein assembly28-32. Our investigations extend previous studies by demonstrating that CAI not only blocks Gag assembly, but also can dismantle HIV-1 CA tubes. This disassembly activity of CAI may work via perturbation of the CA CTD dimer interface28,29,32. An alternative model is one in which CAI replaces NTD helix 4 for binding to the CTD groove that helps align NTDs and CTDs around CA hexamers20. The consequence of CAI-CTD binding would be to weaken hexamers, impair assembly, and destabilize assembled cores. Thus, CAI mimics with antiviral activity30 may act on two fronts, during assembly and during uncoating. We believe that the characterization of HIV-1 tube assembly, and our development of a novel FM method to analyze in vitro tube assembly and stability will help define the functions of HIV cores and how to inhibit them.
Materials and Methods
Protein preparation
Bacterial expression vectors for the HIV-1 NL4-3 WT (pWISP98-8512,16,51, W184A (pWISP99-7916) and Δ87-97 (pWISP99-8016) CA proteins were kindly provided by Wes Sundquist. The expression constructs were modified by addition of C-terminal histidine (his) tags via polymerase chain reaction (PCR) amplification of altered C-terminal ends, followed by cloning of the modified fragments into the original plasmids. The his-tag expression constructs, pWISP-WTCAH6, pWISP-W184ACAH6, and pWISP-ΔCycloopCAH6, have 3′ nt sequences of TTG CAT CAT CAT CAT CAT CAT TAA CTC GAC TCT AGA GGA TTC, encoding LHHHHHH, where L represents the natural C-terminal residue of HIV-1 CA. All constructs were transformed into E. coli strain BL21 (DE3)/pLysS14,44,52 (Novagen) for protein expression.
For protein purifications, bacteria were grown in Luria Broth (LB) supplemented with 0.02% maltose plus 10 mM MgSO4, and induced at 25 °C for 4 h with 0.5 mM isopropyl β-D-thiogalactopyranoside (IPTG). Induced bacteria were collected by centrifugation and frozen. For untagged proteins, pellets were suspended in 10 ml ice cold MOPS/BME (25 mM 4-morpholine propanesulfonic acid [MOPS, pH 6.9], 5 mM β-mercaptoethanol [BME]) containing 0.5 mg DNAseI (BMB 104159) and protease inhibitors (15 ug/ml leupeptin, 7.5 ug/ml pepstatin A, 6 ug/ml benzamidine, 36 ug/ml egg white trypsin inhibitor, 36 ug/ml soybean trypsin inhibitor, 30 ug/ml aprotinin, 1.5 mM phenylmethyl sulfonyl fluoride [PMSF])14. After a 10 min incubation on ice, bacterial suspensions were French-pressed twice and cleared by centrifugation at 23,000g for 15 min at 4°C. Proteins were purified by a modification of the method of Yoo et al.51, using a 2 ml S Sepharose column equilibrated in 25 mM MOPS/BME and step elutions of 0, 50, 100, 150, 200, 250, 300, 350, 400, 450, 500, and 750 mM NaCl. CA proteins eluted in the 250-300 mM salt fractions, buffer was exchanged in 10 mM sodium phosphate (pH 7.4), 1 mM BME via G25 Sepharose desalting columns14, and final protein fractions (100-300 uM) were frozen in aliquots at -80°C. For tagged proteins, bacterial pellets were suspended in 10 ml ice cold phosphate/salt/BME buffer (50 mM sodium phosphate [pH 7.8], 300 mM NaCl, 2 mM BME) containing DNAseI and protease inhibitors, incubated on ice, French-pressed twice, cleared by centrifugation, and purified by 1-2 rounds of nickel chelate chromatography14,44,52. Purified fractions were subjected to buffer exchange and stored as described above. For all proteins, protein identities were assessed by immunoblotting39-40,53, protein purities of >90% were verified by Coomassie blue staining of samples fractionated on SDS-PAGE (sodium dodecyl sulfate-polyacrylamide gel electrophoresis)39-40,53, and concentrations were quantitated using BioRad protein assay reagent (#500-0006), 280 nm absorbance readings assuming a molar extinction coefficient of 33,580, and by densitometric comparison of stained SDS-PAGE protein bands versus known standards.
Assembly incubations
HIV-1 CA assembly incubations were similar to those described previously12,16. Typical 20 ul incubations used 100 uM protein in 50 mM Tris pH 8.0, 1 M NaCl, 5 mM BME and were at 4°C for 24-48 h. Variations included time, temperature, salt concentration, and pH changes. In some cases, solutions of dimethylsulfoxide (DMSO), DMSO containing the peptide capsid assembly inhibitor CAI28-29 (ITFEDLLDYYGP, prepared by EZBiolab), or DMSO containing control peptides from the NIH AIDS Research and Reference Reagent Program were added to incubation mixes at various timepoints to final concentrations of 5% DMSO and varying peptide concentrations. After incubations, samples were applied to carbon-coated grids for EM, to glass coverslips for FM analysis, or were split and processed for both EM and FM. For all quantitations, his-tagged WT or Δ87-97 proteins were employed, but similar results were obtained when untagged HIV-1 CA was used in initial FM and EM incubations.
Electron microscopy
For EM, assembly incubation samples were lifted onto 400 mesh carbon-formvar grids (Ted Pella 01822-F), 400 mesh ultrathin carbon over holey carbon grids (Ted Pella 01824), or 300 mesh copper grids (Ted Pella G300) coated with a thin carbon layer prepared by vacuum deposition (Edwards Auto306 carbon evaporator) and flotation. Samples were lifted onto grids for 3 min, washed 15 sec in water, wicked, stained 45 sec in filtered 1.33% uranyl acetate, wicked and dried. Samples were viewed at 100 kV on a Philips CM120 TEM, and images were collected as 1024×1024 pixel, 14 bit grayscale Gatan Digital Micrograph 3 (DM3) files on a Gatan 794 CCD multiscan camera (MSC), and converted to 8 bit grayscale TIF images using the program Digital Micrograph 3.4.0. For tube edge analysis of multiwalled Δ87-97 tubes, the Digital Micrograph 3.4.0 program was used to calculate autocorrelation functions on boxed images. For tube length, width, and end angle measurements, Image J and PixelStick programs were used.
Antibodies
For detection of WT, W184A, and Δ87-97 CA proteins, the mouse anti-CA monoclonal antibodies Hy183 and NEA9306 were employed. Hybridoma cells producing the Hy183 antibody, which recognizes the HIV-1 CA CTD, were kindly provided by Bruce Chesebro, and antibody-containing cell culture media collections were used either undiluted or at dilutions up to 1:5. The NEA9306 monoclonal antibody (NEN/Dupont) recognizes an epitope between HIV-1 CA residues 75-9845, but bound WT, W184A, and Δ87-97 proteins, and was used at dilutions of 1:500-1:2000. For specific detection of WT versus Δ87-97 proteins, the monoclonal antibody 13-102-100 (Advanced Biotechnologies, Inc.; Columbia, MD), which binds to the epitope HPVHAGPIAPG (residues 84-94; www.hiv.lanl.gov/content/immunology)46-47 in the CypA loop, was utilized at dilutions of 1:1000 to 1:8000. Secondary AlexaFluor488- or AlexaFluor594-conjugated goat anti-mouse IgG(H+L) antibodies were from Invitrogen, and were used at 1:500 to 1:2000.
Fluorescence microscopy
For FM substrates, glass 22×22 mm coverslips were placed in 35 mm wide wells of 6 well cell culture plates and treated for 3-5 min at 25°C with 1 ml of 0.1 mg/ml poly-L-lysine (MW 70,000-150,000; Sigma P4707). Following removal of the poly-L-lysine solution, coverslips were air dried 2 min at 4°C, and samples were applied as five 2 ul drops onto the surfaces. Samples were allowed to adhere to coverslips for 30 min at 4°C, after which 0.5 ml of 4% paraformaldehyde (PFA; made fresh weekly) fixative in PBS (9.5 mM sodium potassium phosphate [pH 7.4], 137 mM NaCl, 2.7 mM KCl) was pipetted around the edges of each well and allowed to cover the adhered samples for an additional 30 min at 4°C. Fixative then was removed, and coverslips were washed 1 min in 1 ml 25°C PBS prior to blocking for 5 min at 25°C with 1 ml of DMEM/FBS (Dulbecco's modified Eagle's media containing 10% fetal bovine serum). For immunodetection of CA proteins, primary antibody dilutions were made in DMEM/FBS in a final volume of 1 ml, and incubations were for 30 min at 37°C, followed by three 1 min washes at 25°C in DMEM/FBS. Secondary antibody incubations employed fluorophore-conjugated antibodies diluted in 1 ml DMEM/FBS, and also were for 30 min at 37°C. Following secondary antibody incubations, coverslips were washed three times 1 min at 25°C with DMEM/FBS and once in PBS at 25°C prior to mounting on slides in 30 ul Fluoro-G, sealing with nail polish, and storage at 4°C. For cases in which two different primary antibodies were employed, samples first were subjected to a complete round of antibody binding and wash steps with the first primary antibody and fluorophore-conjugated secondary antibody, and then were subjected to a second complete round of binding and wash steps, using different primary and secondary antibodies prior to mounting, sealing, and storage.
FM imaging was performed on Zeiss AxioPlan or Zeiss AxioObserver fluorescence microscopes using 20× (LDA-Plan) and 63× (Planapochromat) objectives and a Zeiss filter 10 set (excitation BP 450-490; beamsplitter FT 510; emission BP 515-565) for green fluorophores, or Zeiss filter sets 15 (excitation BP 546/12; beamsplitter FT 580; emission LP 590) or 20 (excitation BP 546/12; beamsplitter FT 560; emission BP 575-640) for red fluorophores. Images were collected in grayscale TIF format using Improvision OpenLab or Zeiss Axiovision software. When direct comparisons of sample images were required, exposure and gain settings were kept constant. For the purpose of presenting color images, grayscale TIF images were opened in Adobe Photoshop; adjusted to 8 bit, RGB format; and selective color whites and neutrals were converted to green (100-0-100-0) or red (0-100-100-0) settings. For overlays of green and red images, TIF images were layered using the screen option, and flattened.
Image analysis
For analysis of EM images, tube lengths, widths, and end angles were measured from TIF images with graphical user interfaces available in Image J and PixelStick software packages. For comparison of tube numbers between FM and EM images, tubes from EM images were counted manually using a minimum length criteria of 1.5 microns, because tubes shorter than this could not be scored with confidence from FM images.
For examination of tube assembly from FM images, three protocols were employed. One method was manual counting and measurement with Image J and PixelStick. A second protocol entailed calculation of image areas covered by tubes. To do so, we took advantage of the fact that fluorescently stained tubes appeared much brighter than background areas in FM images, and calculated percentages of image areas covered by tubes. This was accomplished through tabulation of the percentage of image pixels that were greater than two standard deviations brighter than the mean brightness value for each image. The third procedure for analysis of FM tube images was a semi-automated one. For this procedure, 16 bit grayscale TIF images were opened in Image J, and features were highlighted using the Feature J/FJ Laplacian command. Laplacian images then were converted to binary black-white images with the Process/Binary/Make Binary command, employing either auto-thresholding or, for noisier images, manual thresholding. After these steps, tubes appeared as black lines against a white background. For tube tabulation, the Image J Analyze/Analyze Particles command was utilized, with size and circularity parameters respectively set to 100,000-5,000,000 and 0.0-0.6. The tabular output was loaded into Microsoft Excel as an xls file. For each of the table tube entries, tube lengths were calculated from width and height parameters by application of the Pythagorean theorem. At this point, because tubes with lengths of <1.5 microns (approximately 7 pixels with 63× objectives) could not be distinguished reliably from artifacts, particles shorter than 1.5 microns were deleted from lists. Finally, tube numbers from multiple images of each sample incubation were binned according to size via application of the Excel Frequency command.
Acknowledgments
We are grateful to Wes Sundquist for the bacterial capsid expression vectors and to Bruce Chesebro for the hybridoma Hy183 cells. We also appreciate the help and support of Mike Webb, Isabel Scholz, and Seyram Tsagli. This research was supported by National Institutes of Health grants GM060170 and AI071798 to EB.
Footnotes
Publisher's Disclaimer: This is a PDF file of an unedited manuscript that has been accepted for publication. As a service to our customers we are providing this early version of the manuscript. The manuscript will undergo copyediting, typesetting, and review of the resulting proof before it is published in its final citable form. Please note that during the production process errors may be discovered which could affect the content, and all legal disclaimers that apply to the journal pertain.
References
- 1.Ehrlich L, Agresta B, Carter C. Assembly of recombinant Human Immunodeficiency virus type I capsid protein in vitro. J Virol. 1992;66:4874–4883. doi: 10.1128/jvi.66.8.4874-4883.1992. [DOI] [PMC free article] [PubMed] [Google Scholar]
- 2.Campbell S, Vogt V. Self-assembly in vitro of purified CA-NC proteins from Rous Sarcoma virus and Human Immunodeficiency virus type I. J Virol. 1995;69:6487–6497. doi: 10.1128/jvi.69.10.6487-6497.1995. [DOI] [PMC free article] [PubMed] [Google Scholar]
- 3.Gross I, Hohenberg H, Krausslich HG. In vitro assembly properties of purified bacterially expressed capsid proteins of human immunodeficiency virus. Eur J Biochem. 1997;249:592–600. doi: 10.1111/j.1432-1033.1997.t01-1-00592.x. [DOI] [PubMed] [Google Scholar]
- 4.Swanstrom R, Wills J. Synthesis, assembly and processing of viral proteins. In: Coffin J, Hughes S, Varmus H, editors. Retroviruses. Cold Spring Harbor Laboratory Press; NY: 1997. pp. 263–334. [PubMed] [Google Scholar]
- 5.Barklis E, McDermott J, Wilkens S, Fuller S, Thompson D. Organization of HIV-1 capsid proteins on a lipid monolayer. J Biol Chem. 1998;273:7177–80. doi: 10.1074/jbc.273.13.7177. [DOI] [PubMed] [Google Scholar]
- 6.Gross I, Hohenberg H, Huckhagel C, Krausslich HG. N-terminal extension of Human Immunodeficiency virus capsid protein converts the in vitro assembly phenotype from tubular to spherical particles. J Virol. 1998;72:4798–4810. doi: 10.1128/jvi.72.6.4798-4810.1998. [DOI] [PMC free article] [PubMed] [Google Scholar]
- 7.von Schwedler U, Stemmler T, Klishko V, Li S, Albertine K, Davis D, Sundquist W. Proteolytic refolding of the HIV-1 capsid protein amino-terminus facilitates viral core assembly. EMBO J. 1998;17:1555–1568. doi: 10.1093/emboj/17.6.1555. [DOI] [PMC free article] [PubMed] [Google Scholar]
- 8.Campbell S, Rein A. In vitro assembly properties of Human Immunodeficiency virus type I Gag protein lacking the p6 domain. J Virol. 1999;73:2270–2279. doi: 10.1128/jvi.73.3.2270-2279.1999. [DOI] [PMC free article] [PubMed] [Google Scholar]
- 9.Ganser B, Li S, Klishko V, Finch J, Sundquist W. Assembly and analysis of conical models for the HIV-1 core. Science. 1999;283:80–83. doi: 10.1126/science.283.5398.80. [DOI] [PubMed] [Google Scholar]
- 10.Grattinger M, Hohenberg H, Thomas D, Wilk T, Muller B, Krausslich HG. In vitro assembly properties of wild-type and cyclophilin-binding defective human immunodeficiency virus capsid proteins in the presence and absence of cyclophilin A. Virology. 1999;257:247–260. doi: 10.1006/viro.1999.9668. [DOI] [PubMed] [Google Scholar]
- 11.Gross I, Hohenberg H, Wilk T, Wiegers K, Grattinger M, Muller B, Fuller S, Krausslich HG. A conformational switch controlling HIV-1 morphogenesis. EMBO J. 2000;19:103–113. doi: 10.1093/emboj/19.1.103. [DOI] [PMC free article] [PubMed] [Google Scholar]
- 12.Li S, Hill C, Sundquist W, Finch J. Image reconstructions of helical assemblies of the HIV-1 CA protein. Nature. 2000;407:409–13. doi: 10.1038/35030177. [DOI] [PubMed] [Google Scholar]
- 13.Ehrlich L, Liu T, Scarlata S, Chu B, Carter C. HIV-1 capsid protein forms spherical (immature-like) and tubular (mature-like) particles in vitro: structural switching by pH-induced conformational changes. Biophys J. 2001;81:586–594. doi: 10.1016/S0006-3495(01)75725-6. [DOI] [PMC free article] [PubMed] [Google Scholar]
- 14.Mayo K, Huseby D, McDermott J, Arvidson B, Finlay L, Barklis E. Retrovirus capsid protein assembly arrangements. J Mol Biol. 2003;325:225–237. doi: 10.1016/s0022-2836(02)01176-2. [DOI] [PubMed] [Google Scholar]
- 15.Briggs J, Wilk T, Welker R, Krausslich HG, Fuller S. Structural organization of authentic, mature HIV-1 virions and cores. EMBO J. 2003;22:1707–1715. doi: 10.1093/emboj/cdg143. [DOI] [PMC free article] [PubMed] [Google Scholar]
- 16.Ganser-Pornillos B, von Schwedler U, Stray K, Aiken C, Sundquist W. Assembly properties of the human immunodeficiency virus type 1 CA protein. J Virol. 2004;78:2545–2552. doi: 10.1128/JVI.78.5.2545-2552.2004. [DOI] [PMC free article] [PubMed] [Google Scholar]
- 17.Benjamin J, Ganser-Pornillos B, Tivol W, Sundquist W, Jensen G. Three-dimensional sturcture of HIV-1 virus-like particles by electron cryotomography. J Mol Biol. 2005;346:577–588. doi: 10.1016/j.jmb.2004.11.064. [DOI] [PMC free article] [PubMed] [Google Scholar]
- 18.del Alamo M, Rivas G, Mateu M. Effect of macromolecular crowding agents on Human Immunodeficiency virus type 1 capsid protein assembly in vitro. J Virol. 2005;79:14271–14281. doi: 10.1128/JVI.79.22.14271-14281.2005. [DOI] [PMC free article] [PubMed] [Google Scholar]
- 19.Briggs J, Grunewald K, Glass B, Forster F, Krausslich HG, Fuller S. The mechanism of HIV-1 core assembly: insights from three-dimensional reconstructions of authentic virions. Structure. 2006;14:15–20. doi: 10.1016/j.str.2005.09.010. [DOI] [PubMed] [Google Scholar]
- 20.Ganser-Pornillos B, Cheng A, Yeager M. Structure of full-length HIV-1 CA: a model for the mature capsid lattice. Cell. 2007;131:70–79. doi: 10.1016/j.cell.2007.08.018. [DOI] [PubMed] [Google Scholar]
- 21.Ge M, Sattler K. Obervation of fullerene cones. Chem Phys Lett. 1994;220:192–196. [Google Scholar]
- 22.Gamble T, Yoo S, Vajdos F, von Schwedler U, Worthylake D, Wang H, McCutcheon J, Sundquist W, Hill C. Structure of the carboxy-terminal dimerization domain of the HIV-1 capsid protein. Science. 1997;278:849–53. doi: 10.1126/science.278.5339.849. [DOI] [PubMed] [Google Scholar]
- 23.Luban J, Bossolt K, Franke E, Kalpana G, Goff S. Human immunodeficiency virus type 1 Gag protein binds to cyclophilins A and B. Cell. 1993;73:1067–1078. doi: 10.1016/0092-8674(93)90637-6. [DOI] [PubMed] [Google Scholar]
- 24.Gamble T, Vajdos F, Yoo S, Worthylake D, Houseweart M, Sundquist W, Hill C. Crystal structure of human cyclophilin A bound to the amino-terminal domain of HIV-1 capsid. Cell. 1996;87:1285–1294. doi: 10.1016/s0092-8674(00)81823-1. [DOI] [PubMed] [Google Scholar]
- 25.Abdurahman S, Vegvari A, Youssefi M, Levi M, Hoglund S, Andersson E, Horal P, Svennerholm B, Balzarinin J, Vahlne A. Activity of the small modified amino acid α-hydroxy glycinamide on in vitro and in vivo Human Immunodeficiency virus type 1 capsid assembly and infectivity. Antimicrobial Agents and Chemotherapy. 2008;52:3737–3744. doi: 10.1128/AAC.00265-08. [DOI] [PMC free article] [PubMed] [Google Scholar]
- 26.Tang C, Lieliger E, Kinde I, Kyere S, Mayo K, Barklis E, Sun Y, Huang M, Summers MF. Antiviral inhibition of the HIV-1 capsid protein. J Mol Biol. 2003;327:1013–1020. doi: 10.1016/s0022-2836(03)00289-4. [DOI] [PubMed] [Google Scholar]
- 27.Kelly B, Kyere S, Kinde I, Tang C, Howard B, Robinson H, Sundquist W, Summers M, Hill C. Structure of the antiviral assembly inhibitor CAP-1 complex with the HIV-1 CA protein. J Mol Biol. 2007;373:355–366. doi: 10.1016/j.jmb.2007.07.070. [DOI] [PMC free article] [PubMed] [Google Scholar]
- 28.Sticht J, Humbert M, Findlow S, Bodem J, Muller B, Dietrich U, Werner J, Krausslich HG. A peptide inhibitor of HIV-1 assembly in vitro. Nat Struct Mol Biol. 2005;12:671–677. doi: 10.1038/nsmb964. [DOI] [PubMed] [Google Scholar]
- 29.Ternois F, Sticht J, Duquerroy S, Krausslich HG, Rey F. The HIV-1 capsid protein C-terminal domain in complex with a virus assembly inhibitor. Nat Struct Mol Biol. 2005;12:678–682. doi: 10.1038/nsmb967. [DOI] [PubMed] [Google Scholar]
- 30.Zhang H, Zhao Q, Battacharya S, Waheed A, Tong X, Hong A, Heck S, Curreli F, Goger M, Cowburn D, Freed E, Debnath A. A cell-penetrating helical peptide as a potential HIV-1 inhibitor. J Mol Biol. 2008;378:565–580. doi: 10.1016/j.jmb.2008.02.066. [DOI] [PMC free article] [PubMed] [Google Scholar]
- 31.Bhattacharya S, Zhankg H, Debnath A, Cowburn D. Solution structure of a hydrocarbon stapled peptide inhibitor in complex with monomeric C-terminal domain of HIV-1 capsid. J Biol Chem. 2008;283:16274–16278. doi: 10.1074/jbc.C800048200. [DOI] [PMC free article] [PubMed] [Google Scholar]
- 32.Bartonova V, Ignoet S, Sticht J, Glass B, Habermann A, Vaney MC, Sehr P, Lewis J, Rey F, Krausslich HG. Residues in the HIV-1 capsid assembly inhibitor binding site are essential for maintaining the assembly-competent quaternary structure of the capsid protein. J Biol Chem. 2008;283:32024–32033. doi: 10.1074/jbc.M804230200. [DOI] [PubMed] [Google Scholar]
- 33.Lanman J, Lam T, Barnes S, Sakalian M, Emmett M, Marshall A, Prevelige P. Identification of novel interactions in HIV-1 capsid protein assembly by high-resolution mass spectrometry. J Mol Biol. 2003;325:759–772. doi: 10.1016/s0022-2836(02)01245-7. [DOI] [PubMed] [Google Scholar]
- 34.Mammano F, Ohagen A, Hoglund S, Gottlinger HG. Role of the major homology region of human immunodeficiency virus type 1 in virion morphogenesis. J Virol. 1994;68:4927–4936. doi: 10.1128/jvi.68.8.4927-4936.1994. [DOI] [PMC free article] [PubMed] [Google Scholar]
- 35.Dorfman T, Bukovsky A, Ohagen A, Hoglund S, Gottlinger H. Functional domains of the capsid protein of human immunodeficiency virus type 1. J Virol. 1994;68:8180–8187. doi: 10.1128/jvi.68.12.8180-8187.1994. [DOI] [PMC free article] [PubMed] [Google Scholar]
- 36.Reicin A, Paik S, Berkowitz R, Luban J, Lowy I, Goff S. Linker insertion mutations in the human immunodeficiency virus type 1 in virion morphogenesis. J Virol. 1995;68:4927–4936. doi: 10.1128/jvi.69.2.642-650.1995. [DOI] [PMC free article] [PubMed] [Google Scholar]
- 37.McDermott J, Farrell L, Ross R, Barklis E. Structural analysis of human immunodeficiency virus type 1 Gag protein interactions, using cysteine-specific reagents. J Virol. 1996;70:5106–5114. doi: 10.1128/jvi.70.8.5106-5114.1996. [DOI] [PMC free article] [PubMed] [Google Scholar]
- 38.von Schwedler U, Stray K, Garrus J, Sundquist W. Functional surfaces of the human immunodeficiency virus type 1 capsid protein. J Virol. 2003;77:5439–5450. doi: 10.1128/JVI.77.9.5439-5450.2003. [DOI] [PMC free article] [PubMed] [Google Scholar]
- 39.Alfadhli A, Dhenub T, Still A, Barklis E. Analysis of human immunodeficiency virus type-1 Gag dimerization-induced assembly. J Virol. 2005;79:14498–14506. doi: 10.1128/JVI.79.23.14498-14506.2005. [DOI] [PMC free article] [PubMed] [Google Scholar]
- 40.Scholz I, Arvidson B, Huseby D, Barklis E. Virus particle core defects caused by mutations in the human immunodeficiency virus capsid N-terminal domain. J Virol. 2005;79:1470–1479. doi: 10.1128/JVI.79.3.1470-1479.2005. [DOI] [PMC free article] [PubMed] [Google Scholar]
- 41.Lanman J, Sexton J, Sakalian M, Prevelige P. Kinetic analysis of the role of intersubunit interactions in human immunodeficiency virus type 1 capsid protein assembly in vitro. J Virol. 2002;76:6900–6908. doi: 10.1128/JVI.76.14.6900-6908.2002. [DOI] [PMC free article] [PubMed] [Google Scholar]
- 42.Lepault J, Petitpas I, Erk I, Navaza J, Bigot D, Dona M, Vachette P, Cohen J, Rey F. Structural polymorphism of the major capsid protein of rotavirus. EMBO J. 2001;20:1498–1507. doi: 10.1093/emboj/20.7.1498. [DOI] [PMC free article] [PubMed] [Google Scholar]
- 43.Morikawa Y, Goto T, Momose F. Human immunodeficiency virus type 1 Gag assembly through assembly intermediates. J Biol Chem. 2004;279:31964–31972. doi: 10.1074/jbc.M313432200. [DOI] [PubMed] [Google Scholar]
- 44.Huseby D, Barklis R, Alfadhli A, Barklis E. Assembly of human immunodeficiency virus precursor Gag proteins. J Biol Chem. 2005;280:17664–17670. doi: 10.1074/jbc.M412325200. [DOI] [PubMed] [Google Scholar]
- 45.Bon Homme M, Carter C, Scarlata S. The cysteine residues of HIV-1 capsid regulate oligomerization and cyclophilin A-induced changes. Biophys J. 2005;88:2078–2088. doi: 10.1529/biophysj.104.053298. [DOI] [PMC free article] [PubMed] [Google Scholar]
- 46.Parker C, Papac D, Trojak S, Tomer K. Epitope mapping by mass spectrometry: determination of an epitope on HIV-1 IIIB p26 recognized by a monoclonal antibody. J Immunol. 1996;157:198–206. [PubMed] [Google Scholar]
- 47.Qian X, Tomer K. Affinity capillary electrophoresis investigation of an epitope on human immundeficiency virus recognized by a monoclonal antibody. Electrophoresis. 1998;19:415–419. doi: 10.1002/elps.1150190309. [DOI] [PubMed] [Google Scholar]
- 48.Butan C, Winkler D, Heymann J, Craven R, Steven A. RSV capsid polymorphism correlates with polymerization efficiency and envelope glycoprotein content: implications that nucleation controls morphogenesis. J Mol Biol. 2008;376:1168–1181. doi: 10.1016/j.jmb.2007.12.003. [DOI] [PMC free article] [PubMed] [Google Scholar]
- 49.Lingappa J, Hill R, Wong M, Hegde R. A multistep, ATP-dependent pathway for assembly of human immunodeficiency virus capsids in a cell-free system. J Cell Biol. 1997;136:567–581. doi: 10.1083/jcb.136.3.567. [DOI] [PMC free article] [PubMed] [Google Scholar]
- 50.Endres D, Zlotnick A. Model-based analysis of assembly kinetics for virus capsids or other spherical polymers. Biophys J. 2002;83:1217–1230. doi: 10.1016/S0006-3495(02)75245-4. [DOI] [PMC free article] [PubMed] [Google Scholar]
- 51.Yoo S, Myszka D, Yeh CY, McMurray M, Hill C, Sundquist W. Molecular recognition in the HIV-1 capsid/cyclophilin A complex. J Mol Biol. 1997;269:780–795. doi: 10.1006/jmbi.1997.1051. [DOI] [PubMed] [Google Scholar]
- 52.Alfadhli A, Huseby E, Kapit E, Colman D, Barklis E. Human Immunodeficiency virus type I matrix protein assembles on membranes as a hexamer. J Virol. 2007;81:1472–1478. doi: 10.1128/JVI.02122-06. [DOI] [PMC free article] [PubMed] [Google Scholar]
- 53.Scholz I, Still A, Dhenub T, Coday K, Webb M, Barklis E. Analysis of human immunodeficiency virus matrix protein replacements. Virology. 2008;371:322–335. doi: 10.1016/j.virol.2007.10.010. [DOI] [PMC free article] [PubMed] [Google Scholar]